
|
|||||
|
 | |
| |
| |
| |
| |
| |
|
Gene: NUP42 |
Gene summary for NUP42 |
| Gene information | Species | Human | Gene symbol | NUP42 | Gene ID | 11097 |
| Gene name | nucleoporin 42 | |
| Gene Alias | CG1 | |
| Cytomap | 7p15.3 | |
| Gene Type | protein-coding | GO ID | GO:0006403 | UniProtAcc | O15504 |
Top |
Malignant transformation analysis |
| Identification of the aberrant gene expression in precancerous and cancerous lesions by comparing the gene expression of stem-like cells in diseased tissues with normal stem cells |
| Entrez ID | Symbol | Replicates | Species | Organ | Tissue | Adj P-value | Log2FC | Malignancy |
| 11097 | NUP42 | HTA11_3410_2000001011 | Human | Colorectum | AD | 2.54e-08 | 1.93e-01 | 0.0155 |
| 11097 | NUP42 | HTA11_2487_2000001011 | Human | Colorectum | SER | 3.70e-09 | 3.00e-01 | -0.1808 |
| 11097 | NUP42 | HTA11_1938_2000001011 | Human | Colorectum | AD | 1.66e-15 | 4.12e-01 | -0.0811 |
| 11097 | NUP42 | HTA11_78_2000001011 | Human | Colorectum | AD | 7.82e-22 | 4.42e-01 | -0.1088 |
| 11097 | NUP42 | HTA11_347_2000001011 | Human | Colorectum | AD | 7.85e-24 | 5.01e-01 | -0.1954 |
| 11097 | NUP42 | HTA11_411_2000001011 | Human | Colorectum | SER | 5.61e-03 | 3.68e-01 | -0.2602 |
| 11097 | NUP42 | HTA11_3361_2000001011 | Human | Colorectum | AD | 1.91e-05 | 2.13e-01 | -0.1207 |
| 11097 | NUP42 | HTA11_83_2000001011 | Human | Colorectum | SER | 3.64e-05 | 2.04e-01 | -0.1526 |
| 11097 | NUP42 | HTA11_696_2000001011 | Human | Colorectum | AD | 2.46e-16 | 3.01e-01 | -0.1464 |
| 11097 | NUP42 | HTA11_866_2000001011 | Human | Colorectum | AD | 7.63e-19 | 3.45e-01 | -0.1001 |
| 11097 | NUP42 | HTA11_1391_2000001011 | Human | Colorectum | AD | 2.01e-20 | 5.04e-01 | -0.059 |
| 11097 | NUP42 | HTA11_2992_2000001011 | Human | Colorectum | SER | 1.51e-04 | 2.87e-01 | -0.1706 |
| 11097 | NUP42 | HTA11_546_2000001011 | Human | Colorectum | AD | 8.36e-09 | 3.04e-01 | -0.0842 |
| 11097 | NUP42 | HTA11_7862_2000001011 | Human | Colorectum | AD | 1.96e-03 | 2.16e-01 | -0.0179 |
| 11097 | NUP42 | HTA11_866_3004761011 | Human | Colorectum | AD | 1.36e-07 | 2.00e-01 | 0.096 |
| 11097 | NUP42 | HTA11_4255_2000001011 | Human | Colorectum | SER | 3.22e-05 | 3.36e-01 | 0.0446 |
| 11097 | NUP42 | HTA11_9408_2000001011 | Human | Colorectum | AD | 9.81e-03 | 2.34e-01 | 0.0451 |
| 11097 | NUP42 | HTA11_8622_2000001021 | Human | Colorectum | SER | 6.14e-04 | 2.26e-01 | 0.0528 |
| 11097 | NUP42 | HTA11_7663_2000001011 | Human | Colorectum | SER | 7.58e-09 | 4.07e-01 | 0.0131 |
| 11097 | NUP42 | HTA11_10623_2000001011 | Human | Colorectum | AD | 3.27e-11 | 4.04e-01 | -0.0177 |
| Page: 1 2 |
| Tissue | Expression Dynamics | Abbreviation |
| Colorectum (GSE201348) |  | FAP: Familial adenomatous polyposis |
| CRC: Colorectal cancer | ||
| Colorectum (HTA11) | 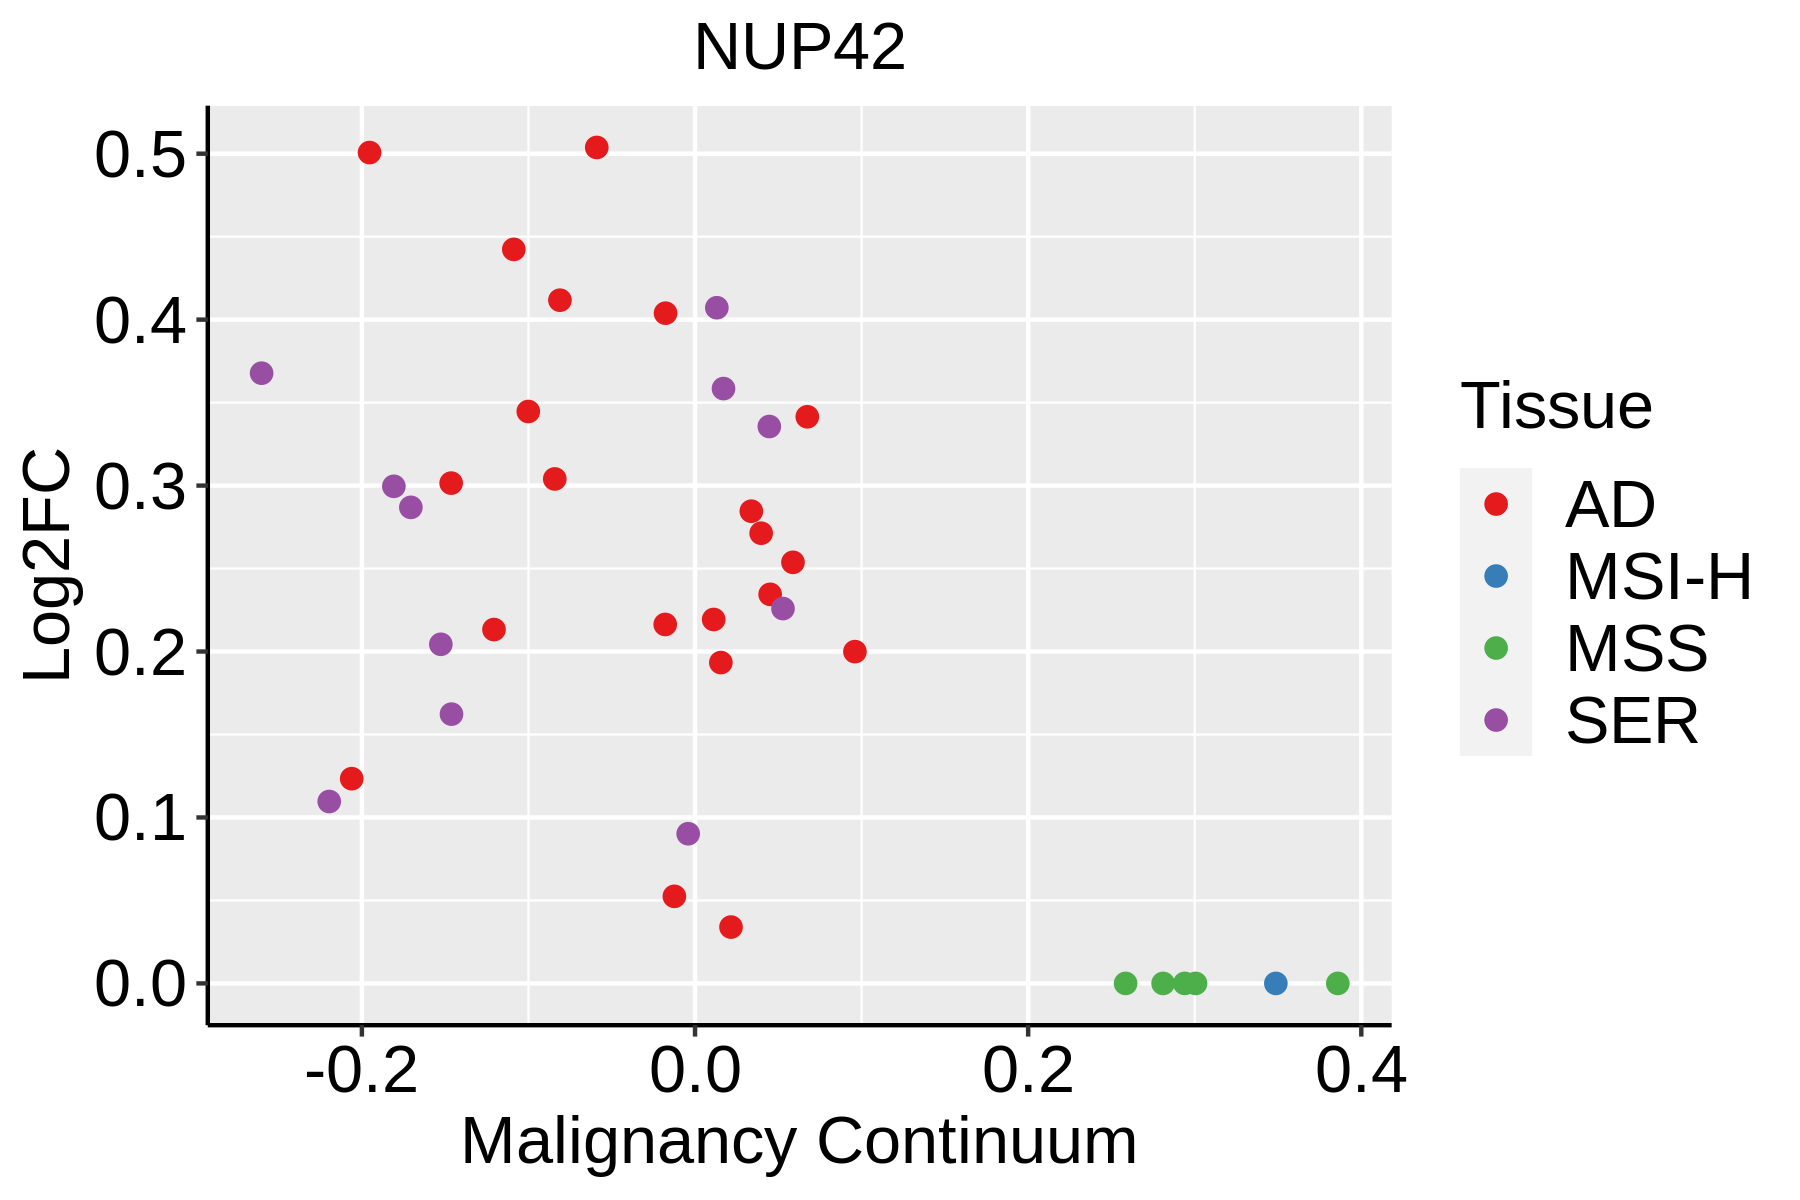 | AD: Adenomas |
| SER: Sessile serrated lesions | ||
| MSI-H: Microsatellite-high colorectal cancer | ||
| MSS: Microsatellite stable colorectal cancer | ||
| Esophagus |  | ESCC: Esophageal squamous cell carcinoma |
| HGIN: High-grade intraepithelial neoplasias | ||
| LGIN: Low-grade intraepithelial neoplasias |
| ∗log2FC in expression of this searched gene in stem-like cells from each diseased tissue sample relative to stem-like cells in normal samples in each tissue plotted against the malignancy continuum. Samples are colored based on if they are from different disease stage. |
Top |
Malignant transformation related pathway analysis |
| Find out the enriched GO biological processes and KEGG pathways involved in transition from healthy to precancer to cancer |
| Tissue | Disease Stage | Enriched GO biological Processes |
| Colorectum | AD |  |
| Colorectum | SER |  |
| Colorectum | MSS |  |
| Colorectum | MSI-H |  |
| Colorectum | FAP |  |
| ∗Top 15 enriched GO BP terms are showed in the bar plot of each disease state in each tissue. Each row represents a significant GO biological process which is colored according to the -log10(p.adjust). |
| Page: 1 2 3 4 5 6 7 8 9 |
| GO ID | Tissue | Disease Stage | Description | Gene Ratio | Bg Ratio | pvalue | p.adjust | Count |
| GO:0006913 | Colorectum | AD | nucleocytoplasmic transport | 102/3918 | 301/18723 | 1.00e-07 | 4.85e-06 | 102 |
| GO:0051169 | Colorectum | AD | nuclear transport | 102/3918 | 301/18723 | 1.00e-07 | 4.85e-06 | 102 |
| GO:0006403 | Colorectum | AD | RNA localization | 71/3918 | 201/18723 | 1.54e-06 | 4.76e-05 | 71 |
| GO:0051236 | Colorectum | AD | establishment of RNA localization | 58/3918 | 166/18723 | 1.95e-05 | 4.01e-04 | 58 |
| GO:0015931 | Colorectum | AD | nucleobase-containing compound transport | 73/3918 | 222/18723 | 2.02e-05 | 4.10e-04 | 73 |
| GO:0050657 | Colorectum | AD | nucleic acid transport | 57/3918 | 163/18723 | 2.22e-05 | 4.39e-04 | 57 |
| GO:0050658 | Colorectum | AD | RNA transport | 57/3918 | 163/18723 | 2.22e-05 | 4.39e-04 | 57 |
| GO:0051168 | Colorectum | AD | nuclear export | 53/3918 | 154/18723 | 6.89e-05 | 1.11e-03 | 53 |
| GO:0006611 | Colorectum | AD | protein export from nucleus | 23/3918 | 57/18723 | 6.62e-04 | 6.80e-03 | 23 |
| GO:0051028 | Colorectum | AD | mRNA transport | 42/3918 | 130/18723 | 1.57e-03 | 1.32e-02 | 42 |
| GO:00069131 | Colorectum | SER | nucleocytoplasmic transport | 77/2897 | 301/18723 | 3.39e-06 | 1.32e-04 | 77 |
| GO:00511691 | Colorectum | SER | nuclear transport | 77/2897 | 301/18723 | 3.39e-06 | 1.32e-04 | 77 |
| GO:00066111 | Colorectum | SER | protein export from nucleus | 22/2897 | 57/18723 | 1.91e-05 | 5.58e-04 | 22 |
| GO:00064031 | Colorectum | SER | RNA localization | 53/2897 | 201/18723 | 4.51e-05 | 1.13e-03 | 53 |
| GO:00511681 | Colorectum | SER | nuclear export | 42/2897 | 154/18723 | 1.19e-04 | 2.46e-03 | 42 |
| GO:00159311 | Colorectum | SER | nucleobase-containing compound transport | 54/2897 | 222/18723 | 3.65e-04 | 5.67e-03 | 54 |
| GO:00512361 | Colorectum | SER | establishment of RNA localization | 42/2897 | 166/18723 | 6.70e-04 | 8.96e-03 | 42 |
| GO:00506571 | Colorectum | SER | nucleic acid transport | 41/2897 | 163/18723 | 8.74e-04 | 1.06e-02 | 41 |
| GO:00506581 | Colorectum | SER | RNA transport | 41/2897 | 163/18723 | 8.74e-04 | 1.06e-02 | 41 |
| GO:000640320 | Esophagus | HGIN | RNA localization | 66/2587 | 201/18723 | 4.06e-12 | 5.41e-10 | 66 |
| Page: 1 2 |
| Pathway ID | Tissue | Disease Stage | Description | Gene Ratio | Bg Ratio | pvalue | p.adjust | qvalue | Count |
| hsa030137 | Esophagus | HGIN | Nucleocytoplasmic transport | 31/1383 | 108/8465 | 8.29e-04 | 7.95e-03 | 6.31e-03 | 31 |
| hsa0301312 | Esophagus | HGIN | Nucleocytoplasmic transport | 31/1383 | 108/8465 | 8.29e-04 | 7.95e-03 | 6.31e-03 | 31 |
| hsa0301321 | Esophagus | ESCC | Nucleocytoplasmic transport | 89/4205 | 108/8465 | 1.20e-12 | 2.37e-11 | 1.21e-11 | 89 |
| hsa0301331 | Esophagus | ESCC | Nucleocytoplasmic transport | 89/4205 | 108/8465 | 1.20e-12 | 2.37e-11 | 1.21e-11 | 89 |
| Page: 1 |
Top |
Cell-cell communication analysis |
| Identification of potential cell-cell interactions between two cell types and their ligand-receptor pairs for different disease states |
| Ligand | Receptor | LRpair | Pathway | Tissue | Disease Stage |
| Page: 1 |
Top |
Single-cell gene regulatory network inference analysis |
| Find out the significant the regulons (TFs) and the target genes of each regulon across cell types for different disease states |
| TF | Cell Type | Tissue | Disease Stage | Target Gene | RSS | Regulon Activity |
| ∗The dot plots of a searched regulon are shown for all cell subpopulations in each disease state of each tissue based on the regulon specific score inferred using pySCENIC and by calculating the average expression. |
| Page: 1 |
Top |
Somatic mutation of malignant transformation related genes |
| Annotation of somatic variants for genes involved in malignant transformation |
| Hugo Symbol | Variant Class | Variant Classification | dbSNP RS | HGVSc | HGVSp | HGVSp Short | SWISSPROT | BIOTYPE | SIFT | PolyPhen | Tumor Sample Barcode | Tissue | Histology | Sex | Age | Stage | Therapy Types | Drugs | Outcome |
| Page: 1 |
Top |
Related drugs of malignant transformation related genes |
| Identification of chemicals and drugs interact with genes involved in malignant transfromation |
| (DGIdb 4.0) |
| Entrez ID | Symbol | Category | Interaction Types | Drug Claim Name | Drug Name | PMIDs |
| Page: 1 |

Copyright 2023-Present -The University of Texas Health Science Center at Houston |