| Tissue | Expression Dynamics | Abbreviation |
| Cervix | 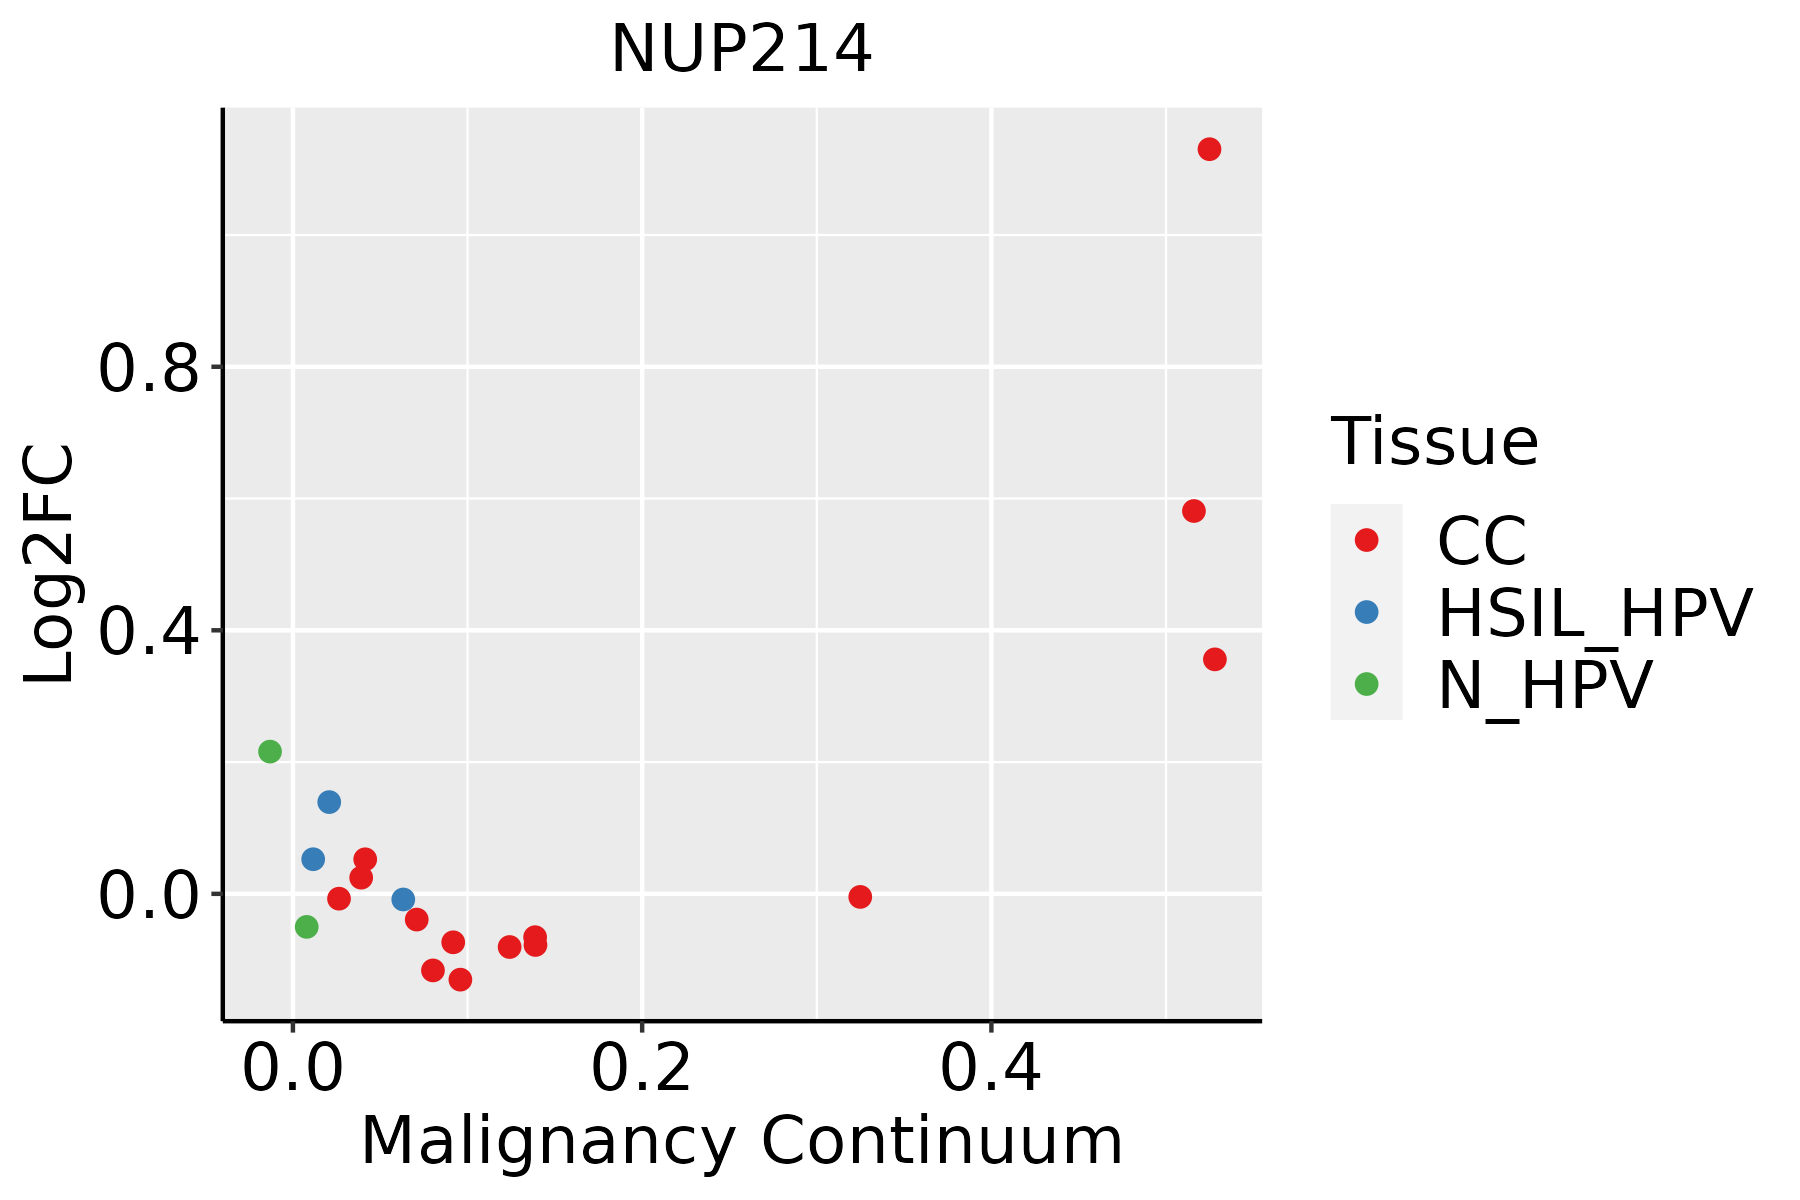 | CC: Cervix cancer |
| HSIL_HPV: HPV-infected high-grade squamous intraepithelial lesions |
| N_HPV: HPV-infected normal cervix |
| Endometrium | 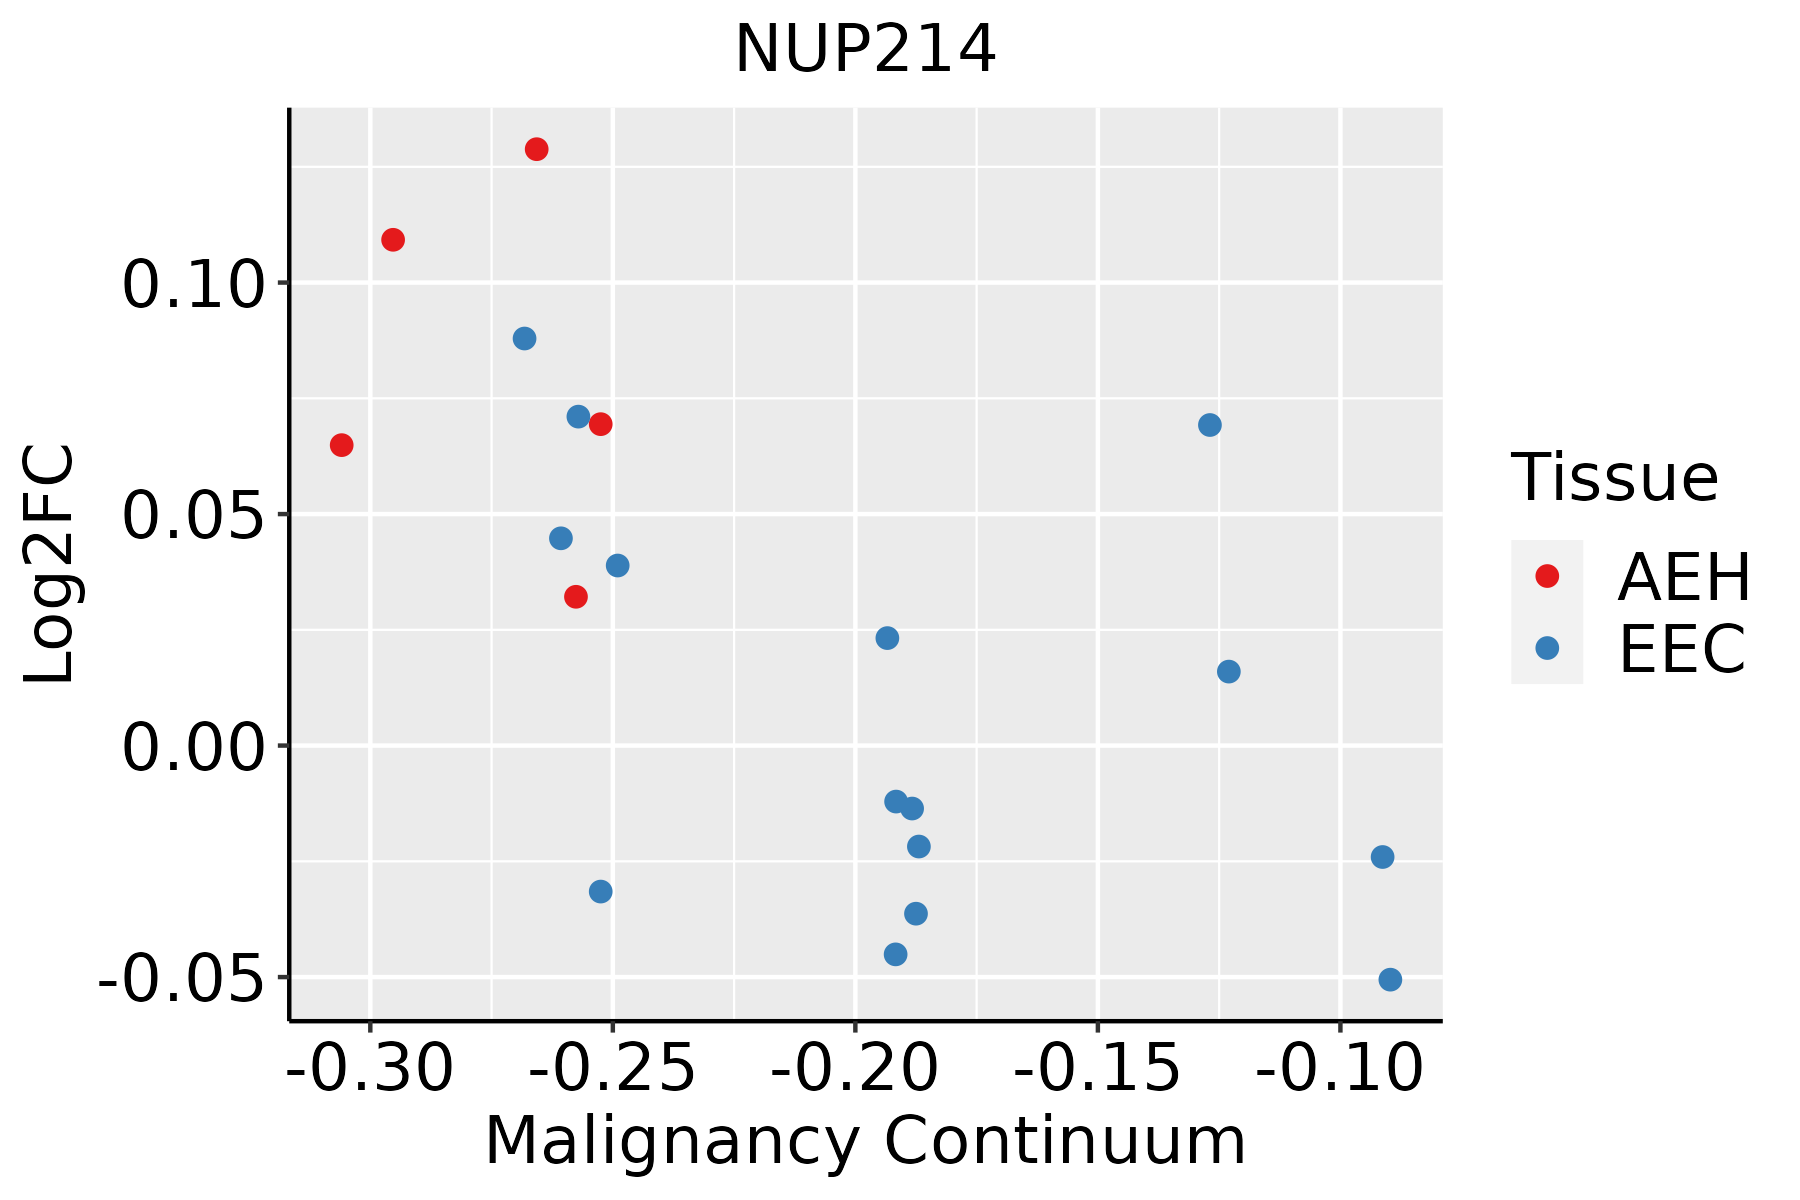 | AEH: Atypical endometrial hyperplasia |
| EEC: Endometrioid Cancer |
| Esophagus | 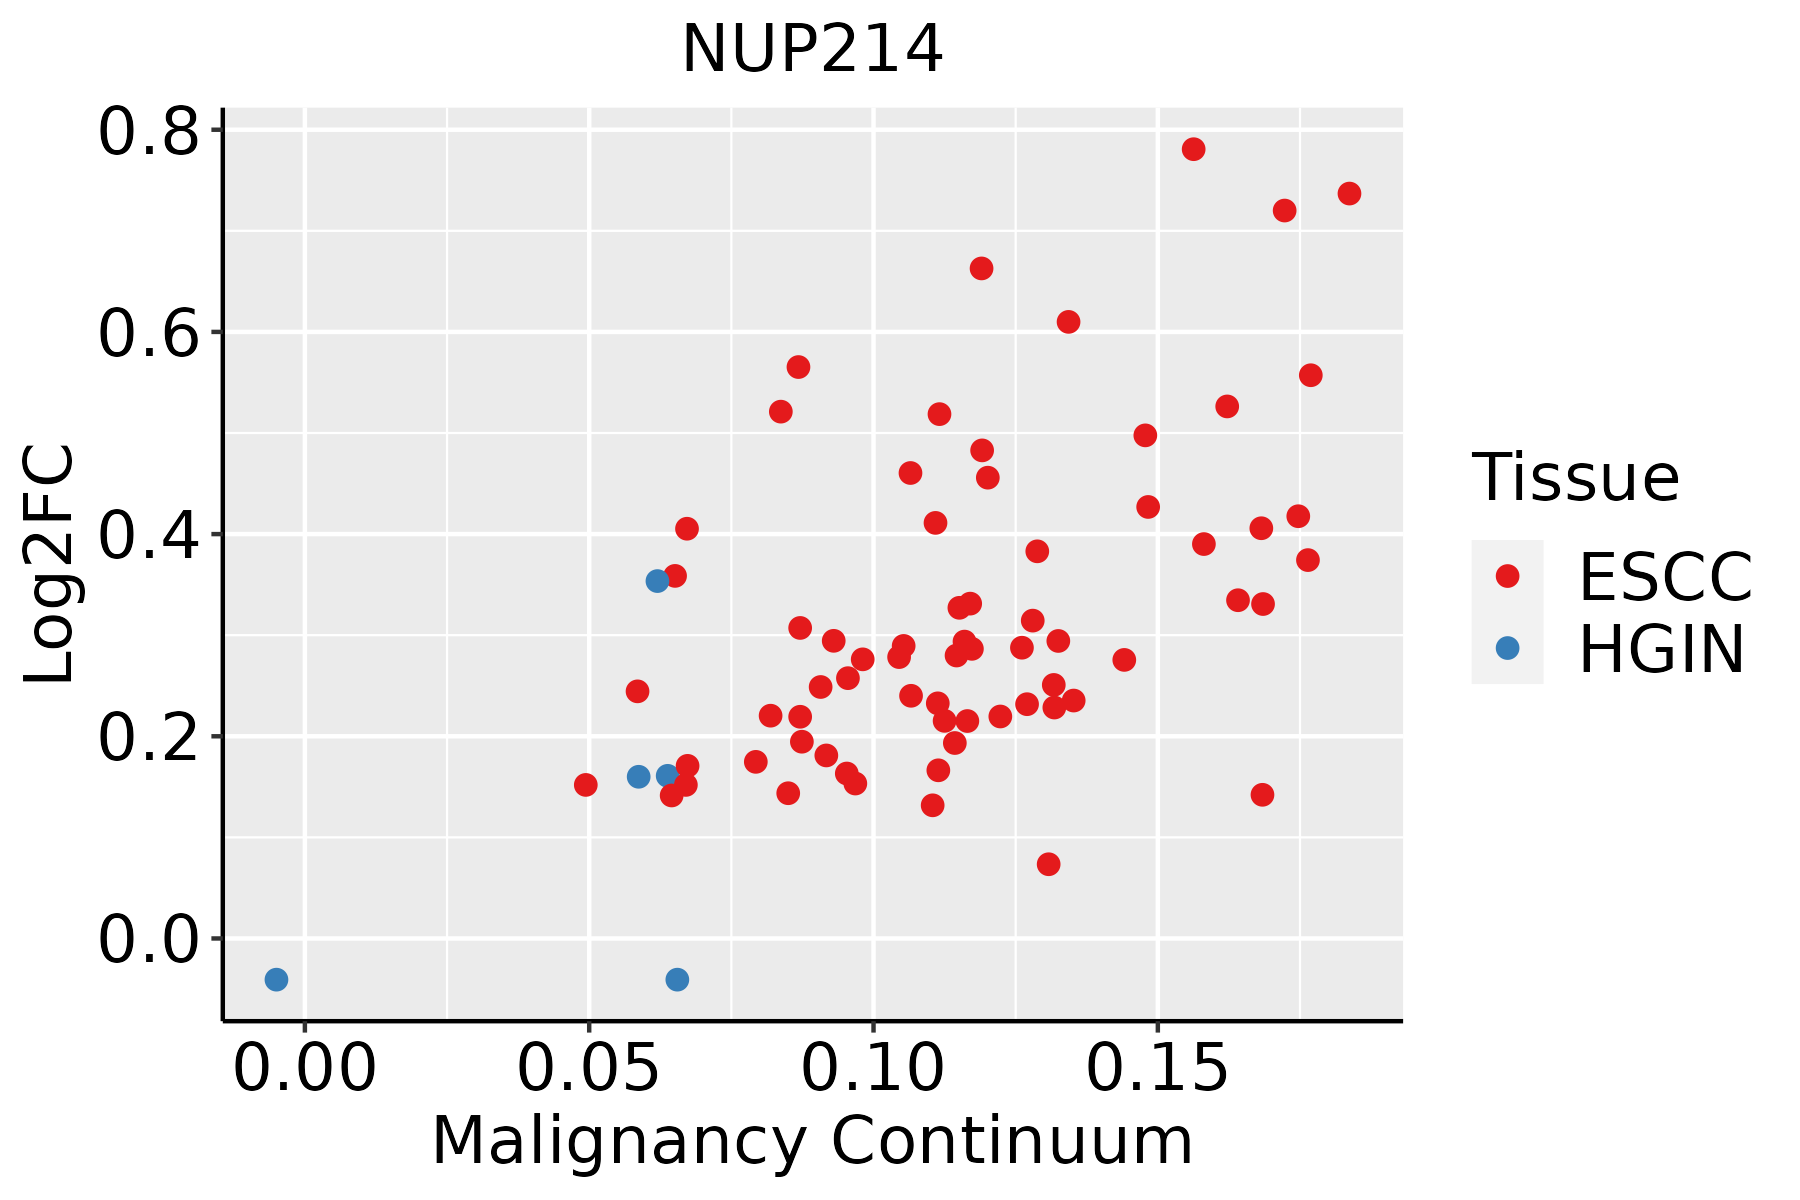 | ESCC: Esophageal squamous cell carcinoma |
| HGIN: High-grade intraepithelial neoplasias |
| LGIN: Low-grade intraepithelial neoplasias |
| Liver |  | HCC: Hepatocellular carcinoma |
| NAFLD: Non-alcoholic fatty liver disease |
| Oral Cavity |  | EOLP: Erosive Oral lichen planus |
| LP: leukoplakia |
| NEOLP: Non-erosive oral lichen planus |
| OSCC: Oral squamous cell carcinoma |
| GO ID | Tissue | Disease Stage | Description | Gene Ratio | Bg Ratio | pvalue | p.adjust | Count |
| GO:00725949 | Cervix | CC | establishment of protein localization to organelle | 99/2311 | 422/18723 | 1.23e-10 | 2.11e-08 | 99 |
| GO:00069139 | Cervix | CC | nucleocytoplasmic transport | 71/2311 | 301/18723 | 4.04e-08 | 2.54e-06 | 71 |
| GO:00511699 | Cervix | CC | nuclear transport | 71/2311 | 301/18723 | 4.04e-08 | 2.54e-06 | 71 |
| GO:00345048 | Cervix | CC | protein localization to nucleus | 68/2311 | 290/18723 | 9.91e-08 | 5.25e-06 | 68 |
| GO:00468229 | Cervix | CC | regulation of nucleocytoplasmic transport | 31/2311 | 106/18723 | 2.68e-06 | 7.87e-05 | 31 |
| GO:00323868 | Cervix | CC | regulation of intracellular transport | 71/2311 | 337/18723 | 3.70e-06 | 9.74e-05 | 71 |
| GO:00170388 | Cervix | CC | protein import | 48/2311 | 206/18723 | 8.62e-06 | 1.98e-04 | 48 |
| GO:00511689 | Cervix | CC | nuclear export | 38/2311 | 154/18723 | 1.86e-05 | 3.46e-04 | 38 |
| GO:00511707 | Cervix | CC | import into nucleus | 38/2311 | 159/18723 | 3.98e-05 | 6.18e-04 | 38 |
| GO:00512368 | Cervix | CC | establishment of RNA localization | 39/2311 | 166/18723 | 4.76e-05 | 7.25e-04 | 39 |
| GO:00066067 | Cervix | CC | protein import into nucleus | 37/2311 | 155/18723 | 5.13e-05 | 7.71e-04 | 37 |
| GO:00506578 | Cervix | CC | nucleic acid transport | 38/2311 | 163/18723 | 7.06e-05 | 9.85e-04 | 38 |
| GO:00506588 | Cervix | CC | RNA transport | 38/2311 | 163/18723 | 7.06e-05 | 9.85e-04 | 38 |
| GO:000640310 | Cervix | CC | RNA localization | 43/2311 | 201/18723 | 2.00e-04 | 2.29e-03 | 43 |
| GO:00510284 | Cervix | CC | mRNA transport | 31/2311 | 130/18723 | 2.05e-04 | 2.33e-03 | 31 |
| GO:00066116 | Cervix | CC | protein export from nucleus | 17/2311 | 57/18723 | 3.61e-04 | 3.75e-03 | 17 |
| GO:00159318 | Cervix | CC | nucleobase-containing compound transport | 43/2311 | 222/18723 | 1.72e-03 | 1.30e-02 | 43 |
| GO:00714262 | Cervix | CC | ribonucleoprotein complex export from nucleus | 18/2311 | 76/18723 | 4.45e-03 | 2.71e-02 | 18 |
| GO:00711662 | Cervix | CC | ribonucleoprotein complex localization | 18/2311 | 77/18723 | 5.15e-03 | 3.03e-02 | 18 |
| GO:00064054 | Cervix | CC | RNA export from nucleus | 19/2311 | 84/18723 | 6.02e-03 | 3.43e-02 | 19 |
| Pathway ID | Tissue | Disease Stage | Description | Gene Ratio | Bg Ratio | pvalue | p.adjust | qvalue | Count |
| hsa0501418 | Cervix | CC | Amyotrophic lateral sclerosis | 103/1267 | 364/8465 | 1.79e-11 | 4.47e-10 | 2.64e-10 | 103 |
| hsa0501419 | Cervix | CC | Amyotrophic lateral sclerosis | 103/1267 | 364/8465 | 1.79e-11 | 4.47e-10 | 2.64e-10 | 103 |
| hsa0501425 | Endometrium | EEC | Amyotrophic lateral sclerosis | 128/1237 | 364/8465 | 9.83e-24 | 4.04e-22 | 3.01e-22 | 128 |
| hsa0501435 | Endometrium | EEC | Amyotrophic lateral sclerosis | 128/1237 | 364/8465 | 9.83e-24 | 4.04e-22 | 3.01e-22 | 128 |
| hsa0501430 | Esophagus | HGIN | Amyotrophic lateral sclerosis | 140/1383 | 364/8465 | 2.13e-25 | 1.16e-23 | 9.19e-24 | 140 |
| hsa030137 | Esophagus | HGIN | Nucleocytoplasmic transport | 31/1383 | 108/8465 | 8.29e-04 | 7.95e-03 | 6.31e-03 | 31 |
| hsa05014113 | Esophagus | HGIN | Amyotrophic lateral sclerosis | 140/1383 | 364/8465 | 2.13e-25 | 1.16e-23 | 9.19e-24 | 140 |
| hsa0301312 | Esophagus | HGIN | Nucleocytoplasmic transport | 31/1383 | 108/8465 | 8.29e-04 | 7.95e-03 | 6.31e-03 | 31 |
| hsa05014210 | Esophagus | ESCC | Amyotrophic lateral sclerosis | 266/4205 | 364/8465 | 1.31e-20 | 2.20e-18 | 1.13e-18 | 266 |
| hsa0301321 | Esophagus | ESCC | Nucleocytoplasmic transport | 89/4205 | 108/8465 | 1.20e-12 | 2.37e-11 | 1.21e-11 | 89 |
| hsa0501438 | Esophagus | ESCC | Amyotrophic lateral sclerosis | 266/4205 | 364/8465 | 1.31e-20 | 2.20e-18 | 1.13e-18 | 266 |
| hsa0301331 | Esophagus | ESCC | Nucleocytoplasmic transport | 89/4205 | 108/8465 | 1.20e-12 | 2.37e-11 | 1.21e-11 | 89 |
| hsa0501422 | Liver | HCC | Amyotrophic lateral sclerosis | 252/4020 | 364/8465 | 8.85e-18 | 7.41e-16 | 4.12e-16 | 252 |
| hsa03013 | Liver | HCC | Nucleocytoplasmic transport | 81/4020 | 108/8465 | 4.28e-09 | 6.83e-08 | 3.80e-08 | 81 |
| hsa0501432 | Liver | HCC | Amyotrophic lateral sclerosis | 252/4020 | 364/8465 | 8.85e-18 | 7.41e-16 | 4.12e-16 | 252 |
| hsa030131 | Liver | HCC | Nucleocytoplasmic transport | 81/4020 | 108/8465 | 4.28e-09 | 6.83e-08 | 3.80e-08 | 81 |
| hsa0501428 | Oral cavity | OSCC | Amyotrophic lateral sclerosis | 246/3704 | 364/8465 | 6.65e-21 | 1.11e-18 | 5.67e-19 | 246 |
| hsa030136 | Oral cavity | OSCC | Nucleocytoplasmic transport | 82/3704 | 108/8465 | 7.93e-12 | 1.33e-10 | 6.77e-11 | 82 |
| hsa05014112 | Oral cavity | OSCC | Amyotrophic lateral sclerosis | 246/3704 | 364/8465 | 6.65e-21 | 1.11e-18 | 5.67e-19 | 246 |
| hsa0301311 | Oral cavity | OSCC | Nucleocytoplasmic transport | 82/3704 | 108/8465 | 7.93e-12 | 1.33e-10 | 6.77e-11 | 82 |
| Hugo Symbol | Variant Class | Variant Classification | dbSNP RS | HGVSc | HGVSp | HGVSp Short | SWISSPROT | BIOTYPE | SIFT | PolyPhen | Tumor Sample Barcode | Tissue | Histology | Sex | Age | Stage | Therapy Types | Drugs | Outcome |
| NUP214 | SNV | Missense_Mutation | novel | c.1931N>C | p.Leu644Ser | p.L644S | P35658 | protein_coding | tolerated(0.51) | benign(0) | TCGA-A7-A3J0-01 | Breast | breast invasive carcinoma | Female | <65 | I/II | Hormone Therapy | anastrazole | SD |
| NUP214 | SNV | Missense_Mutation | | c.1030N>C | p.Glu344Gln | p.E344Q | P35658 | protein_coding | deleterious(0) | probably_damaging(0.996) | TCGA-A8-A09I-01 | Breast | breast invasive carcinoma | Female | >=65 | I/II | Hormone Therapy | anastrozole | SD |
| NUP214 | SNV | Missense_Mutation | | c.3387N>C | p.Lys1129Asn | p.K1129N | P35658 | protein_coding | deleterious(0.01) | possibly_damaging(0.73) | TCGA-AC-A23H-01 | Breast | breast invasive carcinoma | Female | >=65 | I/II | Unknown | Unknown | PD |
| NUP214 | SNV | Missense_Mutation | | c.3961N>A | p.Leu1321Met | p.L1321M | P35658 | protein_coding | deleterious_low_confidence(0.03) | probably_damaging(0.984) | TCGA-AC-A23H-01 | Breast | breast invasive carcinoma | Female | >=65 | I/II | Unknown | Unknown | PD |
| NUP214 | SNV | Missense_Mutation | | c.197A>G | p.Asn66Ser | p.N66S | P35658 | protein_coding | tolerated(0.17) | benign(0.001) | TCGA-BH-A0EB-01 | Breast | breast invasive carcinoma | Female | >=65 | I/II | Hormone Therapy | arimidex | SD |
| NUP214 | SNV | Missense_Mutation | | c.3920C>T | p.Ser1307Phe | p.S1307F | P35658 | protein_coding | deleterious(0.01) | possibly_damaging(0.568) | TCGA-C8-A1HL-01 | Breast | breast invasive carcinoma | Female | <65 | III/IV | Unknown | Unknown | SD |
| NUP214 | SNV | Missense_Mutation | | c.4487N>T | p.Ala1496Val | p.A1496V | P35658 | protein_coding | tolerated_low_confidence(0.1) | benign(0.006) | TCGA-D8-A1XK-01 | Breast | breast invasive carcinoma | Female | <65 | I/II | Chemotherapy | doxorubicine+cyclophosphamide | SD |
| NUP214 | SNV | Missense_Mutation | | c.4288N>G | p.Thr1430Ala | p.T1430A | P35658 | protein_coding | tolerated_low_confidence(0.64) | benign(0) | TCGA-D8-A1XQ-01 | Breast | breast invasive carcinoma | Female | >=65 | I/II | Unknown | Unknown | SD |
| NUP214 | insertion | Nonsense_Mutation | novel | c.5849_5850insCTCCCCCTCCTCCAGTCCTCTCCTTTCACTTTGCTTGTGA | p.Gly1951SerfsTer13 | p.G1951Sfs*13 | P35658 | protein_coding | | | TCGA-A7-A0CD-01 | Breast | breast invasive carcinoma | Female | >=65 | I/II | Hormone Therapy | arimidex | SD |
| NUP214 | insertion | Frame_Shift_Ins | novel | c.3185_3186insGTATTTT | p.Gln1063TyrfsTer7 | p.Q1063Yfs*7 | P35658 | protein_coding | | | TCGA-BH-A0BV-01 | Breast | breast invasive carcinoma | Female | >=65 | I/II | Chemotherapy | doxorubicin | SD |


