
|
|||||
|
 | |
| |
| |
| |
| |
| |
|
Gene: NUP210L |
Gene summary for NUP210L |
| Gene information | Species | Human | Gene symbol | NUP210L | Gene ID | 91181 |
| Gene name | nucleoporin 210 like | |
| Gene Alias | NUP210L | |
| Cytomap | 1q21.3 | |
| Gene Type | protein-coding | GO ID | GO:0005575 | UniProtAcc | Q5VU65 |
Top |
Malignant transformation analysis |
| Identification of the aberrant gene expression in precancerous and cancerous lesions by comparing the gene expression of stem-like cells in diseased tissues with normal stem cells |
| Entrez ID | Symbol | Replicates | Species | Organ | Tissue | Adj P-value | Log2FC | Malignancy |
| 91181 | NUP210L | EEC-subject1 | Human | Endometrium | EEC | 1.34e-09 | 4.04e-01 | -0.2682 |
| 91181 | NUP210L | EEC-subject4 | Human | Endometrium | EEC | 6.22e-03 | 2.22e-01 | -0.2571 |
| 91181 | NUP210L | RNA-P17T-P17T-4 | Human | Lung | IAC | 1.48e-03 | 5.91e-01 | 0.343 |
| 91181 | NUP210L | RNA-P17T-P17T-6 | Human | Lung | IAC | 1.48e-03 | 5.52e-01 | 0.3385 |
| 91181 | NUP210L | RNA-P17T-P17T-8 | Human | Lung | IAC | 1.55e-04 | 4.29e-01 | 0.3329 |
| 91181 | NUP210L | RNA-P6T2-P6T2-1 | Human | Lung | IAC | 4.20e-04 | 2.27e-01 | -0.0166 |
| 91181 | NUP210L | RNA-P6T2-P6T2-2 | Human | Lung | IAC | 1.06e-02 | 1.67e-01 | -0.0132 |
| 91181 | NUP210L | RNA-P6T2-P6T2-3 | Human | Lung | IAC | 4.32e-03 | 1.48e-01 | -0.013 |
| 91181 | NUP210L | RNA-P6T2-P6T2-4 | Human | Lung | IAC | 6.25e-03 | 1.80e-01 | -0.0121 |
| Page: 1 |
| Tissue | Expression Dynamics | Abbreviation |
| Endometrium | 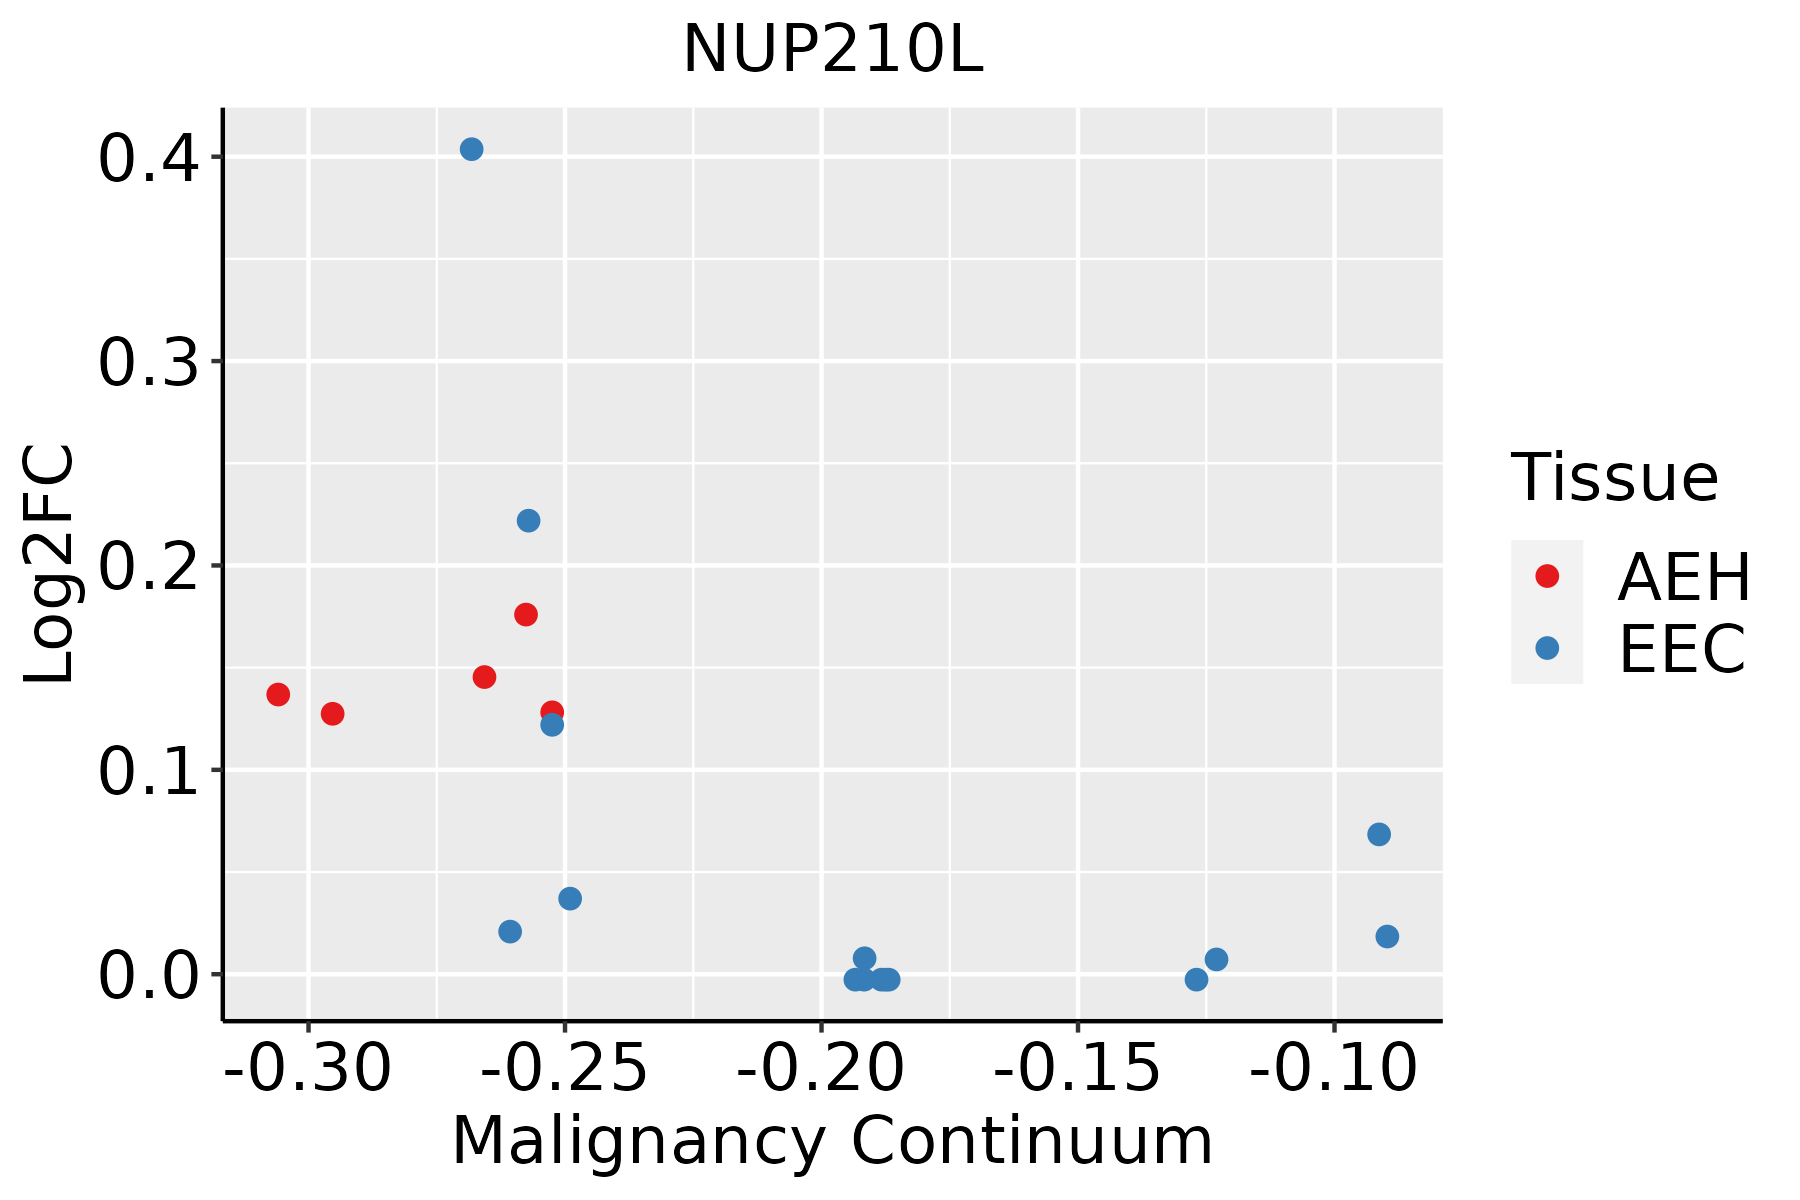 | AEH: Atypical endometrial hyperplasia |
| EEC: Endometrioid Cancer | ||
| Lung | 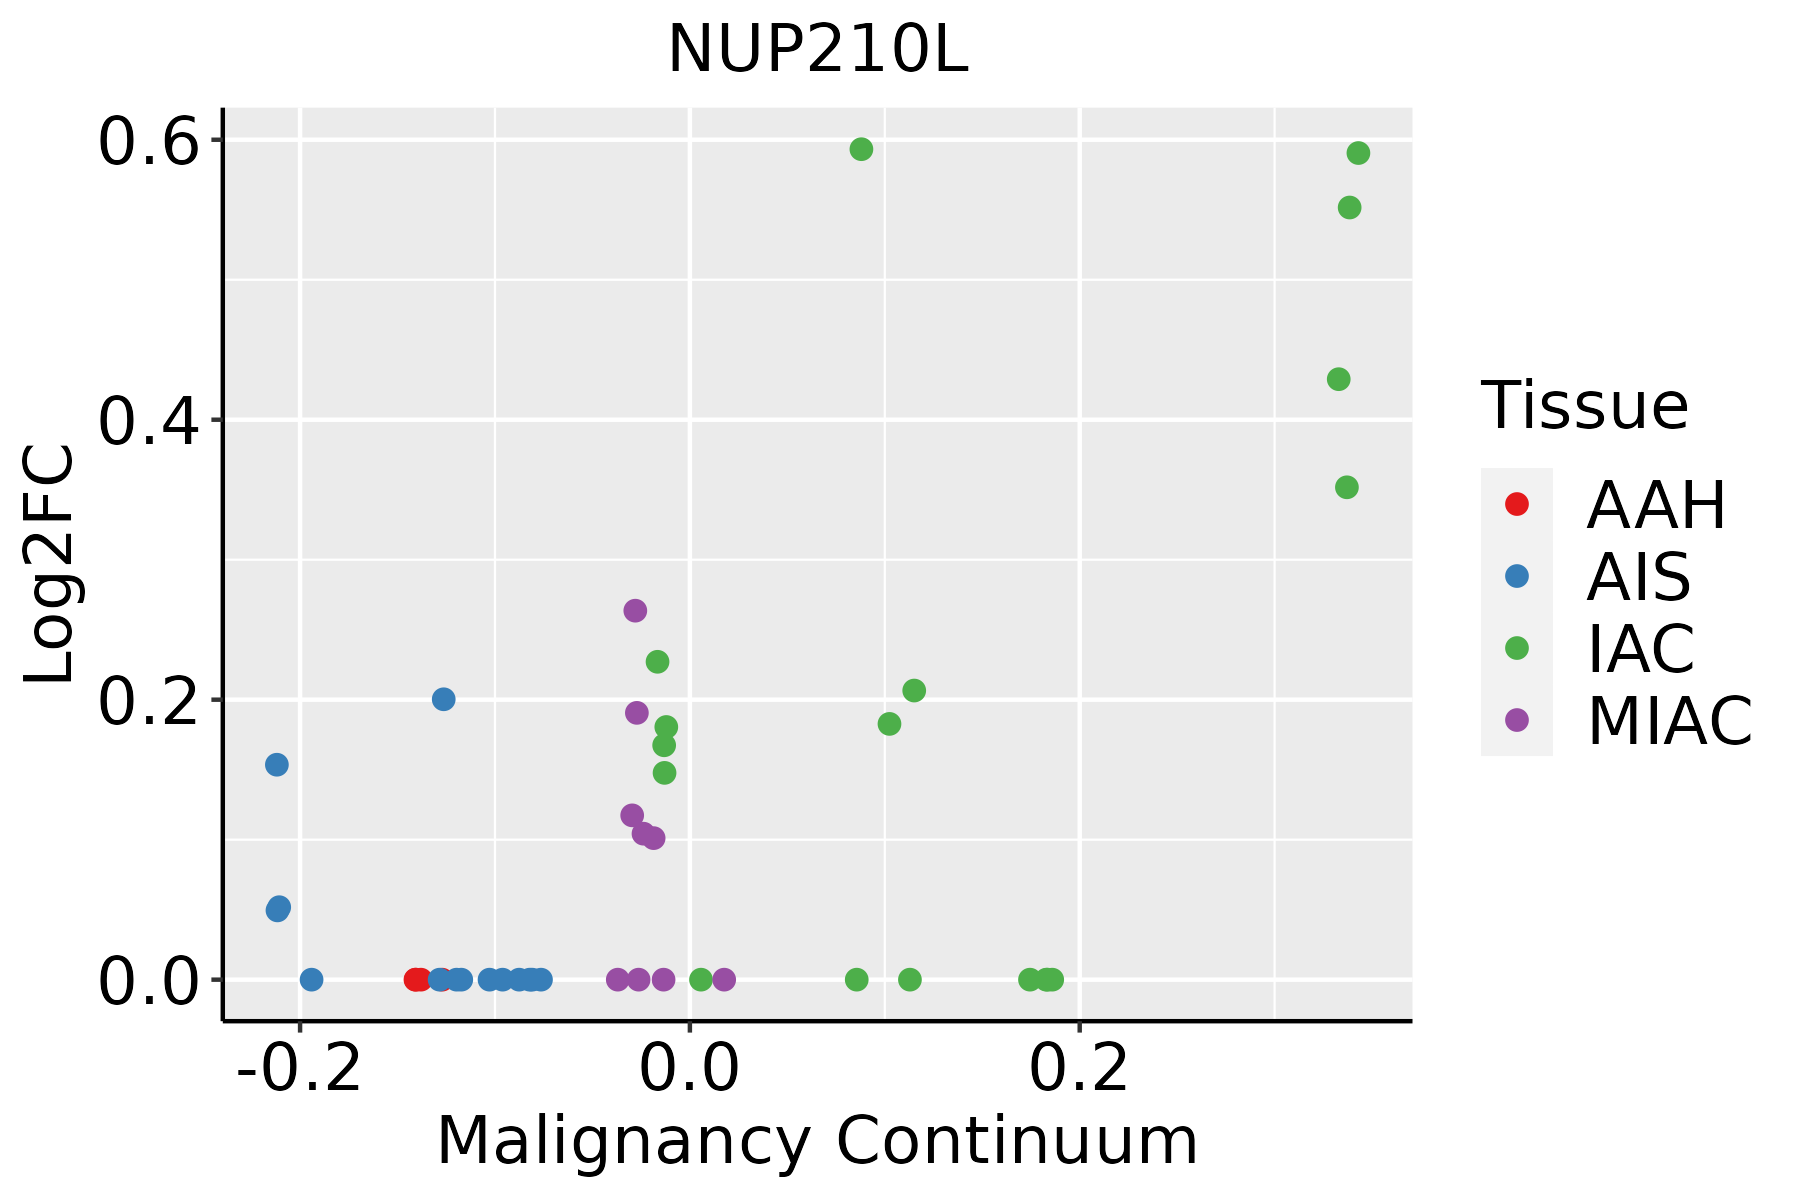 | AAH: Atypical adenomatous hyperplasia |
| AIS: Adenocarcinoma in situ | ||
| IAC: Invasive lung adenocarcinoma | ||
| MIA: Minimally invasive adenocarcinoma |
| ∗log2FC in expression of this searched gene in stem-like cells from each diseased tissue sample relative to stem-like cells in normal samples in each tissue plotted against the malignancy continuum. Samples are colored based on if they are from different disease stage. |
Top |
Malignant transformation related pathway analysis |
| Find out the enriched GO biological processes and KEGG pathways involved in transition from healthy to precancer to cancer |
| Tissue | Disease Stage | Enriched GO biological Processes |
| Colorectum | AD |  |
| Colorectum | SER |  |
| Colorectum | MSS |  |
| Colorectum | MSI-H |  |
| Colorectum | FAP |  |
| ∗Top 15 enriched GO BP terms are showed in the bar plot of each disease state in each tissue. Each row represents a significant GO biological process which is colored according to the -log10(p.adjust). |
| Page: 1 2 3 4 5 6 7 8 9 |
| GO ID | Tissue | Disease Stage | Description | Gene Ratio | Bg Ratio | pvalue | p.adjust | Count |
| Page: 1 |
| Pathway ID | Tissue | Disease Stage | Description | Gene Ratio | Bg Ratio | pvalue | p.adjust | qvalue | Count |
| hsa0501425 | Endometrium | EEC | Amyotrophic lateral sclerosis | 128/1237 | 364/8465 | 9.83e-24 | 4.04e-22 | 3.01e-22 | 128 |
| hsa0501435 | Endometrium | EEC | Amyotrophic lateral sclerosis | 128/1237 | 364/8465 | 9.83e-24 | 4.04e-22 | 3.01e-22 | 128 |
| Page: 1 |
Top |
Cell-cell communication analysis |
| Identification of potential cell-cell interactions between two cell types and their ligand-receptor pairs for different disease states |
| Ligand | Receptor | LRpair | Pathway | Tissue | Disease Stage |
| Page: 1 |
Top |
Single-cell gene regulatory network inference analysis |
| Find out the significant the regulons (TFs) and the target genes of each regulon across cell types for different disease states |
| TF | Cell Type | Tissue | Disease Stage | Target Gene | RSS | Regulon Activity |
| ∗The dot plots of a searched regulon are shown for all cell subpopulations in each disease state of each tissue based on the regulon specific score inferred using pySCENIC and by calculating the average expression. |
| Page: 1 |
Top |
Somatic mutation of malignant transformation related genes |
| Annotation of somatic variants for genes involved in malignant transformation |
| Hugo Symbol | Variant Class | Variant Classification | dbSNP RS | HGVSc | HGVSp | HGVSp Short | SWISSPROT | BIOTYPE | SIFT | PolyPhen | Tumor Sample Barcode | Tissue | Histology | Sex | Age | Stage | Therapy Types | Drugs | Outcome |
| NUP210L | SNV | Missense_Mutation | c.2483C>A | p.Ala828Asp | p.A828D | Q5VU65 | protein_coding | deleterious(0) | possibly_damaging(0.669) | TCGA-A2-A25A-01 | Breast | breast invasive carcinoma | Female | <65 | I/II | Unspecific | Cytoxan | SD | |
| NUP210L | SNV | Missense_Mutation | rs547869716 | c.1651N>G | p.Leu551Val | p.L551V | Q5VU65 | protein_coding | deleterious(0.03) | probably_damaging(0.991) | TCGA-A8-A076-01 | Breast | breast invasive carcinoma | Female | >=65 | I/II | Hormone Therapy | anastrozole | SD |
| NUP210L | SNV | Missense_Mutation | c.4509N>G | p.Ser1503Arg | p.S1503R | Q5VU65 | protein_coding | deleterious(0.01) | benign(0.117) | TCGA-A8-A08F-01 | Breast | breast invasive carcinoma | Female | <65 | III/IV | Chemotherapy | 5-fluorouracil | CR | |
| NUP210L | SNV | Missense_Mutation | c.2961G>C | p.Glu987Asp | p.E987D | Q5VU65 | protein_coding | tolerated(0.96) | probably_damaging(0.978) | TCGA-AC-A62X-01 | Breast | breast invasive carcinoma | Female | >=65 | I/II | Unknown | Unknown | SD | |
| NUP210L | SNV | Missense_Mutation | rs540132385 | c.4472T>C | p.Val1491Ala | p.V1491A | Q5VU65 | protein_coding | deleterious(0.03) | benign(0.371) | TCGA-AN-A046-01 | Breast | breast invasive carcinoma | Female | >=65 | I/II | Unknown | Unknown | SD |
| NUP210L | SNV | Missense_Mutation | rs182423356 | c.695G>A | p.Arg232Gln | p.R232Q | Q5VU65 | protein_coding | tolerated(0.05) | benign(0.012) | TCGA-AN-A046-01 | Breast | breast invasive carcinoma | Female | >=65 | I/II | Unknown | Unknown | SD |
| NUP210L | SNV | Missense_Mutation | c.1876N>G | p.Leu626Val | p.L626V | Q5VU65 | protein_coding | tolerated(0.28) | benign(0.007) | TCGA-AN-A0XW-01 | Breast | breast invasive carcinoma | Female | <65 | III/IV | Unknown | Unknown | SD | |
| NUP210L | SNV | Missense_Mutation | c.3038C>T | p.Pro1013Leu | p.P1013L | Q5VU65 | protein_coding | deleterious(0) | possibly_damaging(0.82) | TCGA-AR-A0TX-01 | Breast | breast invasive carcinoma | Female | <65 | I/II | Unknown | Unknown | SD | |
| NUP210L | SNV | Missense_Mutation | c.616N>A | p.Glu206Lys | p.E206K | Q5VU65 | protein_coding | deleterious(0.01) | benign(0.012) | TCGA-BH-A0AW-01 | Breast | breast invasive carcinoma | Female | <65 | I/II | Chemotherapy | carboplatin | SD | |
| NUP210L | SNV | Missense_Mutation | c.4544C>G | p.Ala1515Gly | p.A1515G | Q5VU65 | protein_coding | deleterious(0.02) | benign(0.081) | TCGA-BH-A0HX-01 | Breast | breast invasive carcinoma | Female | <65 | I/II | Chemotherapy | adrimycin | SD |
| Page: 1 2 3 4 5 6 7 8 9 10 11 12 13 14 15 16 17 18 19 20 21 22 |
Top |
Related drugs of malignant transformation related genes |
| Identification of chemicals and drugs interact with genes involved in malignant transfromation |
| (DGIdb 4.0) |
| Entrez ID | Symbol | Category | Interaction Types | Drug Claim Name | Drug Name | PMIDs |
| Page: 1 |

Copyright 2023-Present -The University of Texas Health Science Center at Houston |