
|
|||||
|
 | |
| |
| |
| |
| |
| |
|
Gene: NUP210 |
Gene summary for NUP210 |
| Gene information | Species | Human | Gene symbol | NUP210 | Gene ID | 23225 |
| Gene name | nucleoporin 210 | |
| Gene Alias | GP210 | |
| Cytomap | 3p25.1 | |
| Gene Type | protein-coding | GO ID | GO:0006403 | UniProtAcc | Q8TEM1 |
Top |
Malignant transformation analysis |
| Identification of the aberrant gene expression in precancerous and cancerous lesions by comparing the gene expression of stem-like cells in diseased tissues with normal stem cells |
| Entrez ID | Symbol | Replicates | Species | Organ | Tissue | Adj P-value | Log2FC | Malignancy |
| 23225 | NUP210 | CCI_2 | Human | Cervix | CC | 6.15e-11 | 7.45e-01 | 0.5249 |
| 23225 | NUP210 | CCI_3 | Human | Cervix | CC | 8.56e-06 | 4.49e-01 | 0.516 |
| 23225 | NUP210 | CCII_1 | Human | Cervix | CC | 1.54e-04 | 3.15e-01 | 0.3249 |
| 23225 | NUP210 | T1 | Human | Cervix | CC | 4.46e-08 | 3.37e-01 | 0.0918 |
| 23225 | NUP210 | NAFLD1 | Human | Liver | NAFLD | 6.47e-04 | 3.84e-01 | -0.04 |
| 23225 | NUP210 | HCC1_Meng | Human | Liver | HCC | 7.27e-51 | 9.26e-02 | 0.0246 |
| 23225 | NUP210 | HCC2_Meng | Human | Liver | HCC | 1.42e-02 | -3.49e-02 | 0.0107 |
| 23225 | NUP210 | S014 | Human | Liver | HCC | 1.12e-17 | 7.86e-01 | 0.2254 |
| 23225 | NUP210 | S015 | Human | Liver | HCC | 2.29e-15 | 7.57e-01 | 0.2375 |
| 23225 | NUP210 | S016 | Human | Liver | HCC | 3.22e-18 | 6.83e-01 | 0.2243 |
| 23225 | NUP210 | S027 | Human | Liver | HCC | 5.38e-19 | 1.20e+00 | 0.2446 |
| 23225 | NUP210 | S028 | Human | Liver | HCC | 1.06e-39 | 1.55e+00 | 0.2503 |
| 23225 | NUP210 | S029 | Human | Liver | HCC | 3.67e-35 | 1.53e+00 | 0.2581 |
| Page: 1 |
| Tissue | Expression Dynamics | Abbreviation |
| Cervix | 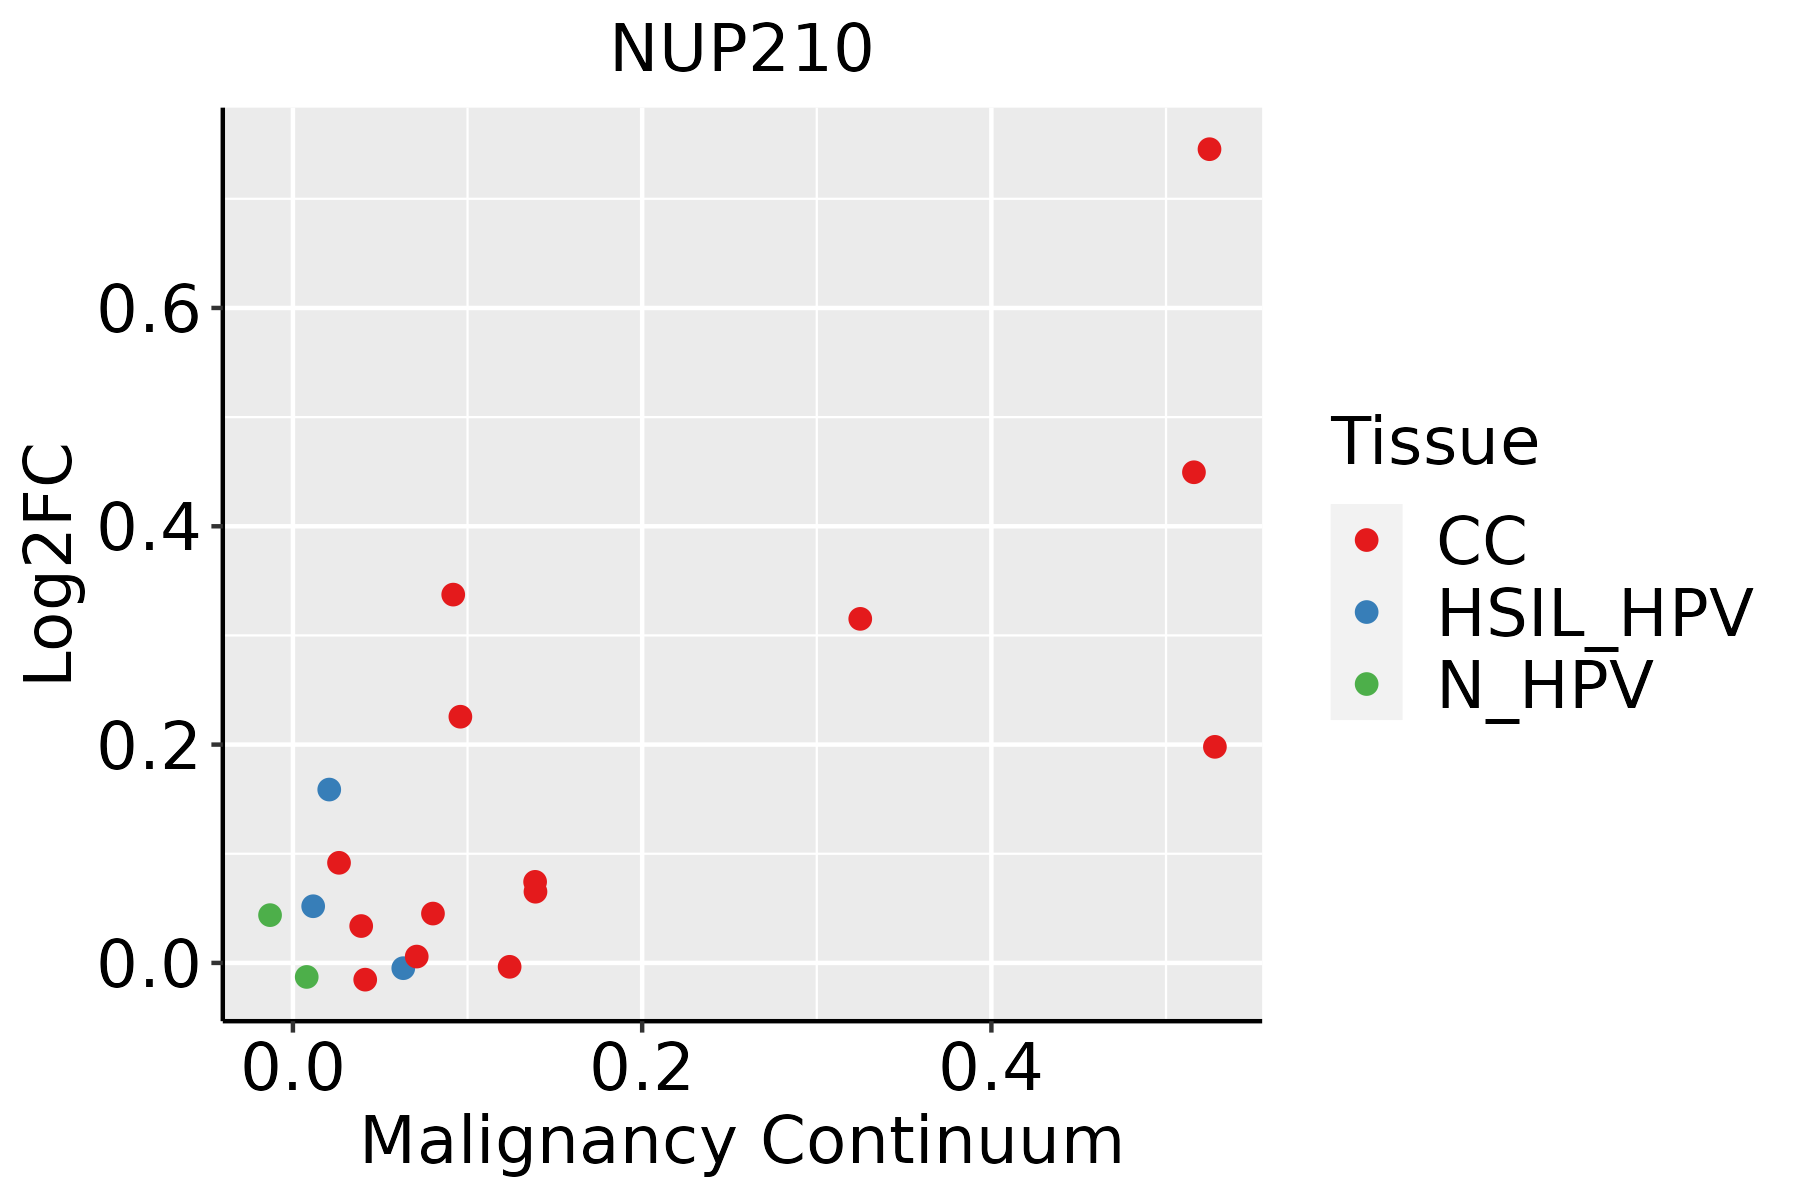 | CC: Cervix cancer |
| HSIL_HPV: HPV-infected high-grade squamous intraepithelial lesions | ||
| N_HPV: HPV-infected normal cervix | ||
| Liver | 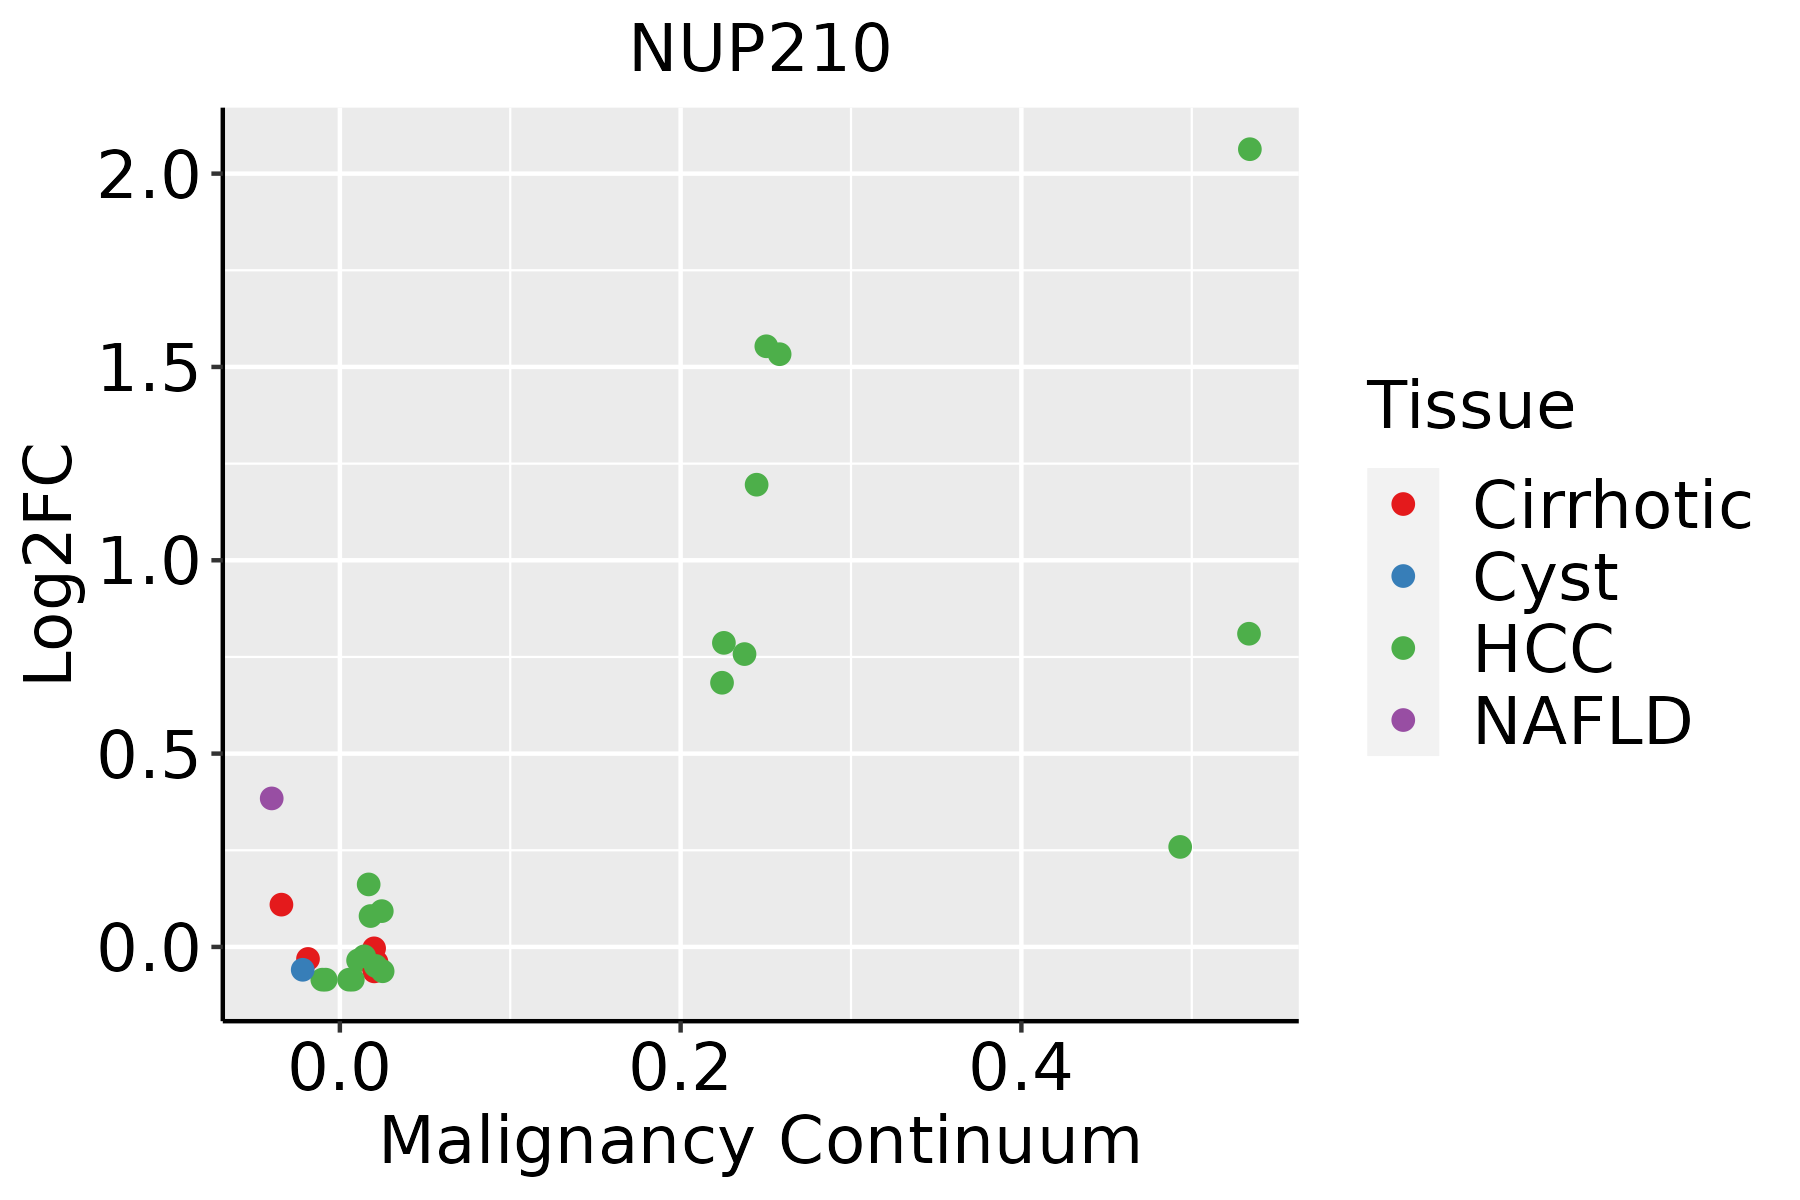 | HCC: Hepatocellular carcinoma |
| NAFLD: Non-alcoholic fatty liver disease |
| ∗log2FC in expression of this searched gene in stem-like cells from each diseased tissue sample relative to stem-like cells in normal samples in each tissue plotted against the malignancy continuum. Samples are colored based on if they are from different disease stage. |
Top |
Malignant transformation related pathway analysis |
| Find out the enriched GO biological processes and KEGG pathways involved in transition from healthy to precancer to cancer |
| Tissue | Disease Stage | Enriched GO biological Processes |
| Colorectum | AD |  |
| Colorectum | SER |  |
| Colorectum | MSS |  |
| Colorectum | MSI-H |  |
| Colorectum | FAP |  |
| ∗Top 15 enriched GO BP terms are showed in the bar plot of each disease state in each tissue. Each row represents a significant GO biological process which is colored according to the -log10(p.adjust). |
| Page: 1 2 3 4 5 6 7 8 9 |
| GO ID | Tissue | Disease Stage | Description | Gene Ratio | Bg Ratio | pvalue | p.adjust | Count |
| GO:00512368 | Cervix | CC | establishment of RNA localization | 39/2311 | 166/18723 | 4.76e-05 | 7.25e-04 | 39 |
| GO:00506578 | Cervix | CC | nucleic acid transport | 38/2311 | 163/18723 | 7.06e-05 | 9.85e-04 | 38 |
| GO:00506588 | Cervix | CC | RNA transport | 38/2311 | 163/18723 | 7.06e-05 | 9.85e-04 | 38 |
| GO:000640310 | Cervix | CC | RNA localization | 43/2311 | 201/18723 | 2.00e-04 | 2.29e-03 | 43 |
| GO:00510284 | Cervix | CC | mRNA transport | 31/2311 | 130/18723 | 2.05e-04 | 2.33e-03 | 31 |
| GO:00159318 | Cervix | CC | nucleobase-containing compound transport | 43/2311 | 222/18723 | 1.72e-03 | 1.30e-02 | 43 |
| GO:00512366 | Liver | NAFLD | establishment of RNA localization | 28/1882 | 166/18723 | 4.35e-03 | 3.57e-02 | 28 |
| GO:00064037 | Liver | NAFLD | RNA localization | 32/1882 | 201/18723 | 5.96e-03 | 4.48e-02 | 32 |
| GO:000640321 | Liver | HCC | RNA localization | 151/7958 | 201/18723 | 3.72e-21 | 5.89e-19 | 151 |
| GO:005123621 | Liver | HCC | establishment of RNA localization | 121/7958 | 166/18723 | 1.61e-15 | 1.19e-13 | 121 |
| GO:005065711 | Liver | HCC | nucleic acid transport | 118/7958 | 163/18723 | 8.30e-15 | 5.60e-13 | 118 |
| GO:005065811 | Liver | HCC | RNA transport | 118/7958 | 163/18723 | 8.30e-15 | 5.60e-13 | 118 |
| GO:001593111 | Liver | HCC | nucleobase-containing compound transport | 150/7958 | 222/18723 | 3.17e-14 | 2.03e-12 | 150 |
| GO:005102811 | Liver | HCC | mRNA transport | 97/7958 | 130/18723 | 9.00e-14 | 5.23e-12 | 97 |
| Page: 1 |
| Pathway ID | Tissue | Disease Stage | Description | Gene Ratio | Bg Ratio | pvalue | p.adjust | qvalue | Count |
| hsa0501418 | Cervix | CC | Amyotrophic lateral sclerosis | 103/1267 | 364/8465 | 1.79e-11 | 4.47e-10 | 2.64e-10 | 103 |
| hsa0501419 | Cervix | CC | Amyotrophic lateral sclerosis | 103/1267 | 364/8465 | 1.79e-11 | 4.47e-10 | 2.64e-10 | 103 |
| hsa0501422 | Liver | HCC | Amyotrophic lateral sclerosis | 252/4020 | 364/8465 | 8.85e-18 | 7.41e-16 | 4.12e-16 | 252 |
| hsa03013 | Liver | HCC | Nucleocytoplasmic transport | 81/4020 | 108/8465 | 4.28e-09 | 6.83e-08 | 3.80e-08 | 81 |
| hsa0501432 | Liver | HCC | Amyotrophic lateral sclerosis | 252/4020 | 364/8465 | 8.85e-18 | 7.41e-16 | 4.12e-16 | 252 |
| hsa030131 | Liver | HCC | Nucleocytoplasmic transport | 81/4020 | 108/8465 | 4.28e-09 | 6.83e-08 | 3.80e-08 | 81 |
| Page: 1 |
Top |
Cell-cell communication analysis |
| Identification of potential cell-cell interactions between two cell types and their ligand-receptor pairs for different disease states |
| Ligand | Receptor | LRpair | Pathway | Tissue | Disease Stage |
| Page: 1 |
Top |
Single-cell gene regulatory network inference analysis |
| Find out the significant the regulons (TFs) and the target genes of each regulon across cell types for different disease states |
| TF | Cell Type | Tissue | Disease Stage | Target Gene | RSS | Regulon Activity |
| ∗The dot plots of a searched regulon are shown for all cell subpopulations in each disease state of each tissue based on the regulon specific score inferred using pySCENIC and by calculating the average expression. |
| Page: 1 |
Top |
Somatic mutation of malignant transformation related genes |
| Annotation of somatic variants for genes involved in malignant transformation |
| Hugo Symbol | Variant Class | Variant Classification | dbSNP RS | HGVSc | HGVSp | HGVSp Short | SWISSPROT | BIOTYPE | SIFT | PolyPhen | Tumor Sample Barcode | Tissue | Histology | Sex | Age | Stage | Therapy Types | Drugs | Outcome |
| NUP210 | SNV | Missense_Mutation | c.1304N>C | p.Val435Ala | p.V435A | Q8TEM1 | protein_coding | tolerated(0.23) | benign(0.248) | TCGA-AO-A128-01 | Breast | breast invasive carcinoma | Female | <65 | I/II | Chemotherapy | doxorubicin | SD | |
| NUP210 | SNV | Missense_Mutation | c.3791N>T | p.Ser1264Leu | p.S1264L | Q8TEM1 | protein_coding | deleterious(0.01) | benign(0.006) | TCGA-BH-A0B7-01 | Breast | breast invasive carcinoma | Female | <65 | I/II | Chemotherapy | adriamycin | CR | |
| NUP210 | SNV | Missense_Mutation | rs372138569 | c.4333N>A | p.Val1445Ile | p.V1445I | Q8TEM1 | protein_coding | tolerated(0.22) | benign(0.003) | TCGA-BH-A18G-01 | Breast | breast invasive carcinoma | Female | >=65 | I/II | Unknown | Unknown | SD |
| NUP210 | SNV | Missense_Mutation | c.4738N>A | p.Ala1580Thr | p.A1580T | Q8TEM1 | protein_coding | tolerated(1) | benign(0) | TCGA-D8-A1Y0-01 | Breast | breast invasive carcinoma | Female | >=65 | III/IV | Chemotherapy | cyclophosphamide+methotrexatum+fluorouracillum | SD | |
| NUP210 | SNV | Missense_Mutation | c.4705N>G | p.Phe1569Val | p.F1569V | Q8TEM1 | protein_coding | tolerated(0.55) | benign(0) | TCGA-E9-A22B-01 | Breast | breast invasive carcinoma | Female | >=65 | I/II | Hormone Therapy | tamoxiphen | SD | |
| NUP210 | SNV | Missense_Mutation | novel | c.4240N>A | p.Asp1414Asn | p.D1414N | Q8TEM1 | protein_coding | deleterious(0.01) | possibly_damaging(0.691) | TCGA-E9-A245-01 | Breast | breast invasive carcinoma | Female | <65 | I/II | Hormone Therapy | tamoxiphen | SD |
| NUP210 | insertion | In_Frame_Ins | novel | c.5020_5021insCTTCCTGGATTCCTACCAGGTCATGTTCTT | p.Ser1674delinsThrSerTrpIleProThrArgSerCysSerCys | p.S1674delinsTSWIPTRSCSC | Q8TEM1 | protein_coding | TCGA-A8-A07U-01 | Breast | breast invasive carcinoma | Female | >=65 | III/IV | Chemotherapy | 5-fluorouracil | SD | ||
| NUP210 | insertion | Nonsense_Mutation | novel | c.2053_2054insTCAGGCCTTGGGTGAGCAGGTGAGTGGGCAGCTGCTCCA | p.Glu685delinsValArgProTrpValSerArgTerValGlySerCysSerLys | p.E685delinsVRPWVSR*VGSCSK | Q8TEM1 | protein_coding | TCGA-A8-A08H-01 | Breast | breast invasive carcinoma | Female | >=65 | I/II | Unknown | Unknown | SD | ||
| NUP210 | insertion | In_Frame_Ins | novel | c.4104_4105insTTAAATGCCCCAAGAGCC | p.Ala1368_Val1369insLeuAsnAlaProArgAla | p.A1368_V1369insLNAPRA | Q8TEM1 | protein_coding | TCGA-A8-A0A7-01 | Breast | breast invasive carcinoma | Female | <65 | I/II | Unknown | Unknown | SD | ||
| NUP210 | insertion | Nonsense_Mutation | novel | c.651_652insTTGTTAGATGTAATAAAAATGTGGGAAGGGCATGCTGGCTGA | p.Leu218_Lys219insLeuAspValIleLysMetTrpGluGlyHisAlaGlyTerLeu | p.L218_K219insLDVIKMWEGHAG*L | Q8TEM1 | protein_coding | TCGA-B6-A0IA-01 | Breast | breast invasive carcinoma | Female | <65 | I/II | Unknown | Unknown | SD |
| Page: 1 2 3 4 5 6 7 8 9 10 11 12 13 14 15 16 17 18 |
Top |
Related drugs of malignant transformation related genes |
| Identification of chemicals and drugs interact with genes involved in malignant transfromation |
| (DGIdb 4.0) |
| Entrez ID | Symbol | Category | Interaction Types | Drug Claim Name | Drug Name | PMIDs |
| Page: 1 |

Copyright 2023-Present -The University of Texas Health Science Center at Houston |