
|
|||||
|
 | |
| |
| |
| |
| |
| |
|
Gene: NUP205 |
Gene summary for NUP205 |
| Gene information | Species | Human | Gene symbol | NUP205 | Gene ID | 23165 |
| Gene name | nucleoporin 205 | |
| Gene Alias | C7orf14 | |
| Cytomap | 7q33 | |
| Gene Type | protein-coding | GO ID | GO:0006403 | UniProtAcc | Q92621 |
Top |
Malignant transformation analysis |
| Identification of the aberrant gene expression in precancerous and cancerous lesions by comparing the gene expression of stem-like cells in diseased tissues with normal stem cells |
| Entrez ID | Symbol | Replicates | Species | Organ | Tissue | Adj P-value | Log2FC | Malignancy |
| 23165 | NUP205 | LZE4T | Human | Esophagus | ESCC | 4.45e-04 | 1.72e-01 | 0.0811 |
| 23165 | NUP205 | LZE7T | Human | Esophagus | ESCC | 1.97e-04 | 3.29e-01 | 0.0667 |
| 23165 | NUP205 | LZE8T | Human | Esophagus | ESCC | 1.78e-04 | 7.45e-02 | 0.067 |
| 23165 | NUP205 | LZE24T | Human | Esophagus | ESCC | 1.78e-06 | 1.35e-01 | 0.0596 |
| 23165 | NUP205 | LZE21T | Human | Esophagus | ESCC | 2.64e-05 | 3.17e-01 | 0.0655 |
| 23165 | NUP205 | P1T-E | Human | Esophagus | ESCC | 2.45e-06 | 3.12e-01 | 0.0875 |
| 23165 | NUP205 | P2T-E | Human | Esophagus | ESCC | 1.41e-14 | 1.22e-01 | 0.1177 |
| 23165 | NUP205 | P4T-E | Human | Esophagus | ESCC | 5.78e-14 | 3.22e-01 | 0.1323 |
| 23165 | NUP205 | P5T-E | Human | Esophagus | ESCC | 4.70e-04 | 1.70e-01 | 0.1327 |
| 23165 | NUP205 | P8T-E | Human | Esophagus | ESCC | 2.50e-09 | 1.60e-01 | 0.0889 |
| 23165 | NUP205 | P9T-E | Human | Esophagus | ESCC | 1.57e-03 | 1.64e-01 | 0.1131 |
| 23165 | NUP205 | P10T-E | Human | Esophagus | ESCC | 1.71e-09 | 1.99e-01 | 0.116 |
| 23165 | NUP205 | P12T-E | Human | Esophagus | ESCC | 1.03e-15 | 3.06e-01 | 0.1122 |
| 23165 | NUP205 | P15T-E | Human | Esophagus | ESCC | 1.63e-19 | 5.76e-01 | 0.1149 |
| 23165 | NUP205 | P16T-E | Human | Esophagus | ESCC | 4.41e-11 | 1.84e-01 | 0.1153 |
| 23165 | NUP205 | P19T-E | Human | Esophagus | ESCC | 3.15e-02 | 3.64e-01 | 0.1662 |
| 23165 | NUP205 | P20T-E | Human | Esophagus | ESCC | 3.60e-07 | 6.38e-02 | 0.1124 |
| 23165 | NUP205 | P21T-E | Human | Esophagus | ESCC | 1.04e-14 | 3.72e-01 | 0.1617 |
| 23165 | NUP205 | P22T-E | Human | Esophagus | ESCC | 4.37e-07 | 4.95e-02 | 0.1236 |
| 23165 | NUP205 | P23T-E | Human | Esophagus | ESCC | 5.40e-13 | 1.37e-01 | 0.108 |
| Page: 1 2 3 4 |
| Tissue | Expression Dynamics | Abbreviation |
| Esophagus | 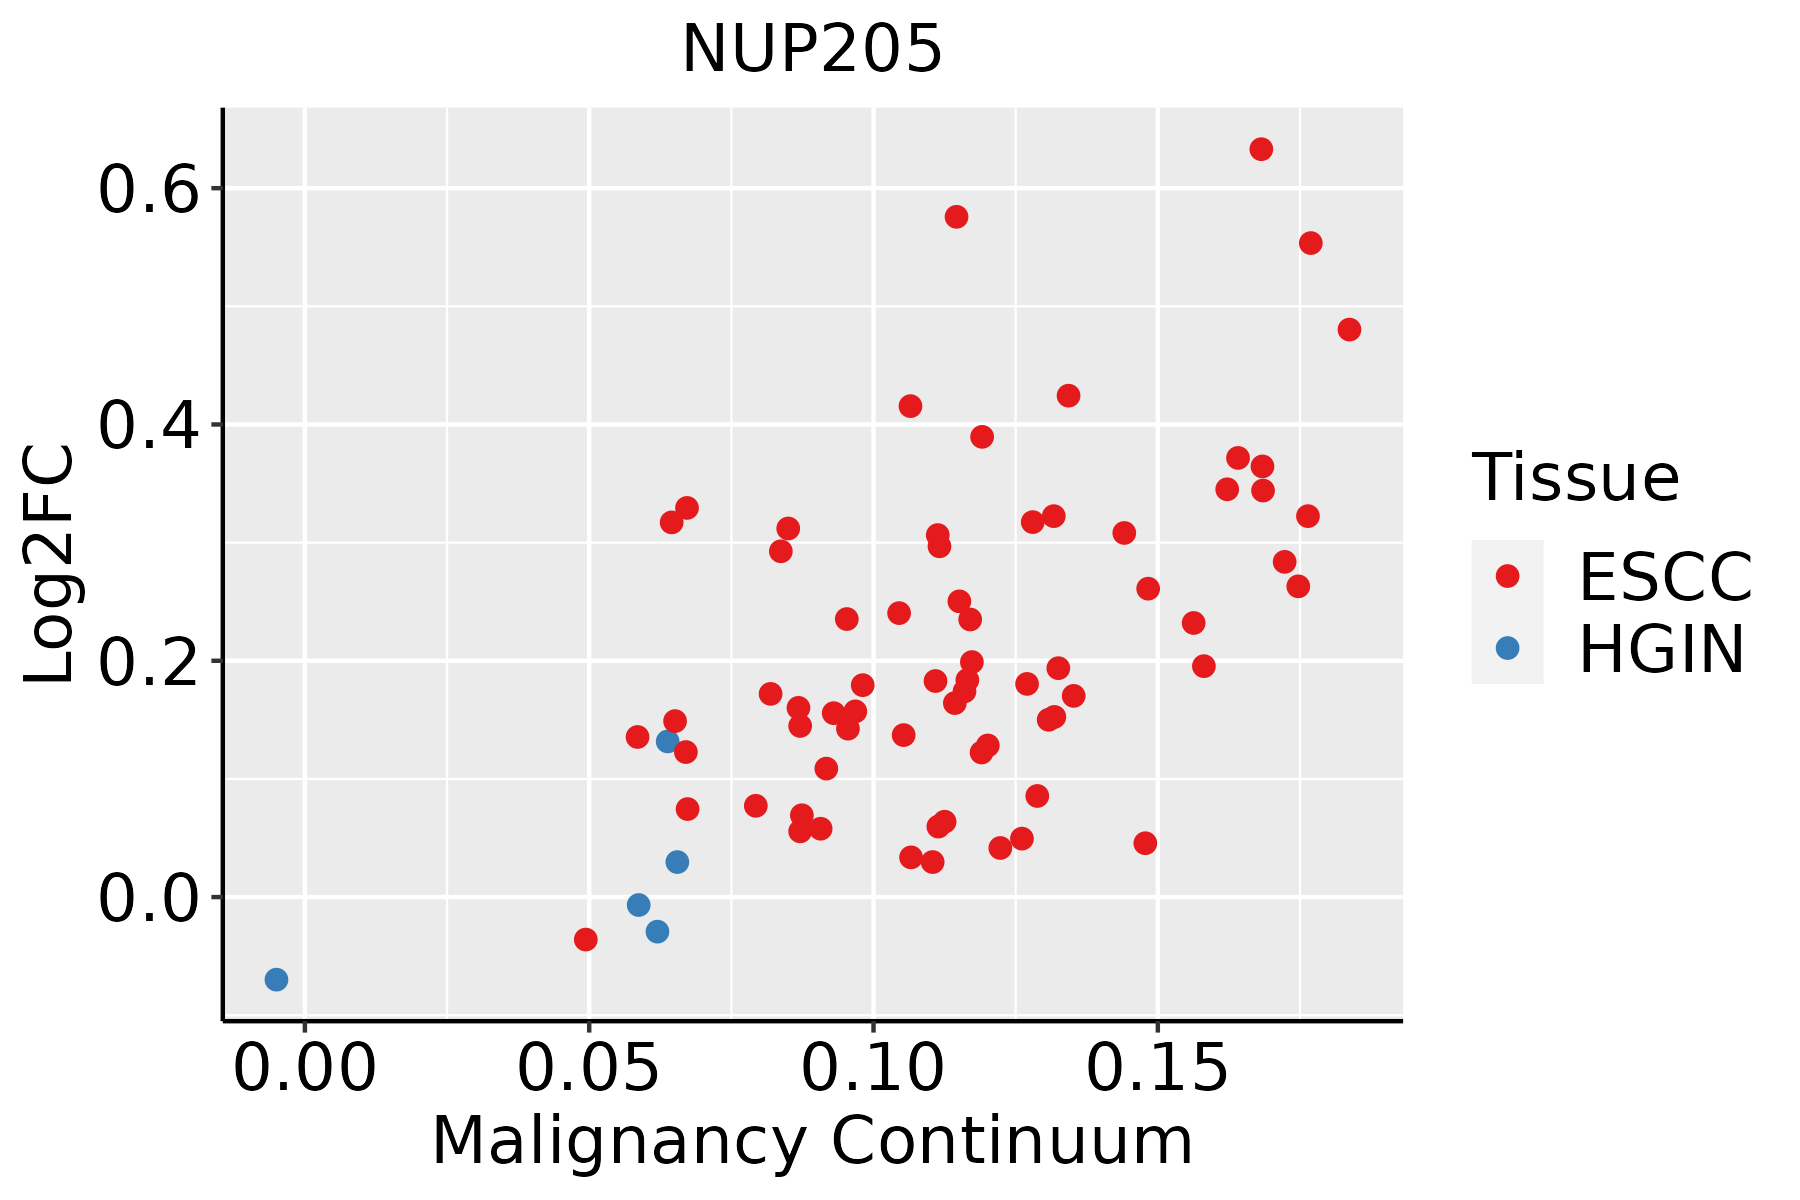 | ESCC: Esophageal squamous cell carcinoma |
| HGIN: High-grade intraepithelial neoplasias | ||
| LGIN: Low-grade intraepithelial neoplasias | ||
| Thyroid | 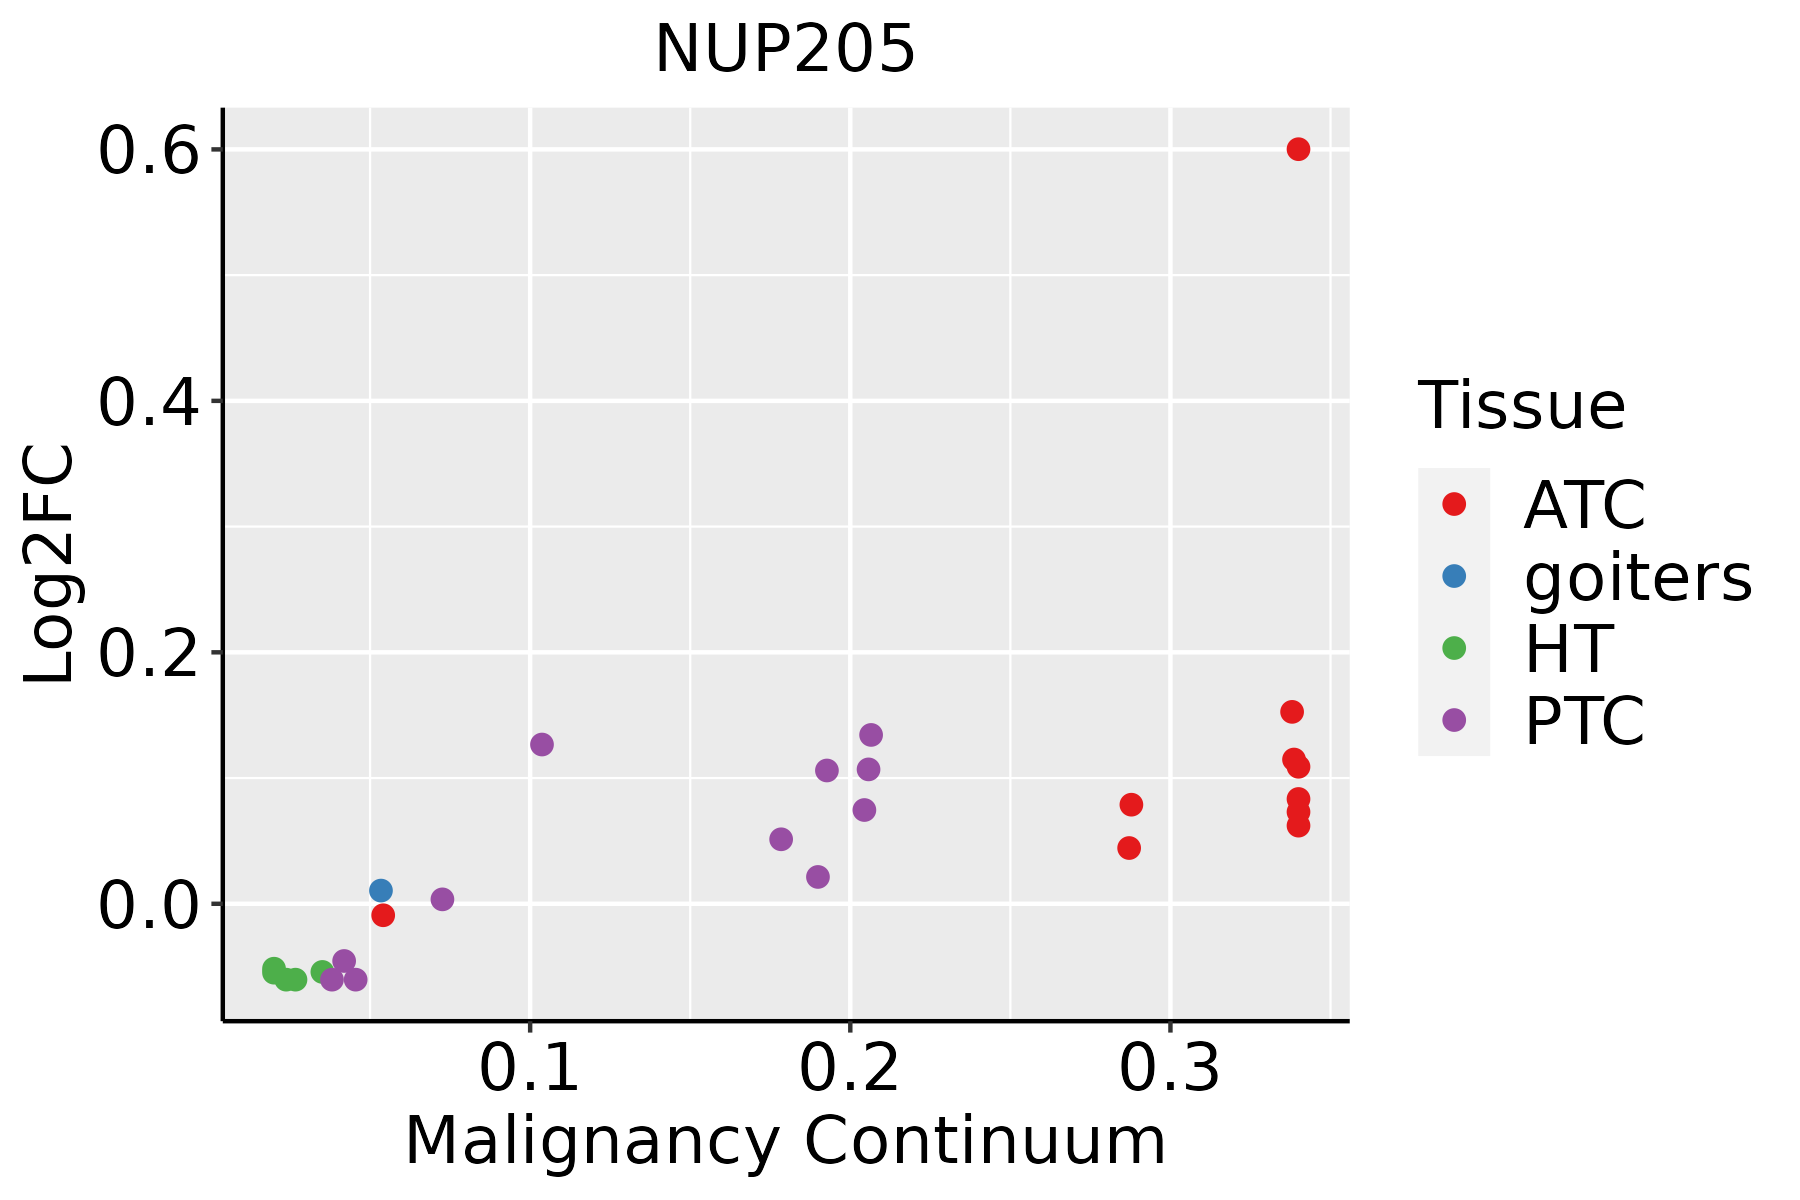 | ATC: Anaplastic thyroid cancer |
| HT: Hashimoto's thyroiditis | ||
| PTC: Papillary thyroid cancer |
| ∗log2FC in expression of this searched gene in stem-like cells from each diseased tissue sample relative to stem-like cells in normal samples in each tissue plotted against the malignancy continuum. Samples are colored based on if they are from different disease stage. |
Top |
Malignant transformation related pathway analysis |
| Find out the enriched GO biological processes and KEGG pathways involved in transition from healthy to precancer to cancer |
| Tissue | Disease Stage | Enriched GO biological Processes |
| Colorectum | AD |  |
| Colorectum | SER |  |
| Colorectum | MSS |  |
| Colorectum | MSI-H |  |
| Colorectum | FAP |  |
| ∗Top 15 enriched GO BP terms are showed in the bar plot of each disease state in each tissue. Each row represents a significant GO biological process which is colored according to the -log10(p.adjust). |
| Page: 1 2 3 4 5 6 7 8 9 |
| GO ID | Tissue | Disease Stage | Description | Gene Ratio | Bg Ratio | pvalue | p.adjust | Count |
| GO:0006913110 | Esophagus | ESCC | nucleocytoplasmic transport | 230/8552 | 301/18723 | 6.04e-28 | 2.02e-25 | 230 |
| GO:0051169110 | Esophagus | ESCC | nuclear transport | 230/8552 | 301/18723 | 6.04e-28 | 2.02e-25 | 230 |
| GO:0006403110 | Esophagus | ESCC | RNA localization | 166/8552 | 201/18723 | 1.95e-27 | 6.18e-25 | 166 |
| GO:005123617 | Esophagus | ESCC | establishment of RNA localization | 134/8552 | 166/18723 | 1.23e-20 | 1.81e-18 | 134 |
| GO:005102815 | Esophagus | ESCC | mRNA transport | 110/8552 | 130/18723 | 2.76e-20 | 3.80e-18 | 110 |
| GO:005065717 | Esophagus | ESCC | nucleic acid transport | 131/8552 | 163/18723 | 6.94e-20 | 8.46e-18 | 131 |
| GO:005065817 | Esophagus | ESCC | RNA transport | 131/8552 | 163/18723 | 6.94e-20 | 8.46e-18 | 131 |
| GO:001593117 | Esophagus | ESCC | nucleobase-containing compound transport | 162/8552 | 222/18723 | 9.87e-17 | 7.93e-15 | 162 |
| GO:000699713 | Esophagus | ESCC | nucleus organization | 96/8552 | 133/18723 | 4.66e-10 | 1.21e-08 | 96 |
| GO:00069994 | Esophagus | ESCC | nuclear pore organization | 14/8552 | 14/18723 | 1.71e-05 | 1.52e-04 | 14 |
| GO:00469316 | Esophagus | ESCC | pore complex assembly | 16/8552 | 20/18723 | 1.85e-03 | 8.40e-03 | 16 |
| GO:0006913112 | Thyroid | PTC | nucleocytoplasmic transport | 181/5968 | 301/18723 | 2.93e-24 | 7.69e-22 | 181 |
| GO:0051169112 | Thyroid | PTC | nuclear transport | 181/5968 | 301/18723 | 2.93e-24 | 7.69e-22 | 181 |
| GO:0006403112 | Thyroid | PTC | RNA localization | 130/5968 | 201/18723 | 9.23e-22 | 1.94e-19 | 130 |
| GO:0051236110 | Thyroid | PTC | establishment of RNA localization | 100/5968 | 166/18723 | 4.26e-14 | 2.58e-12 | 100 |
| GO:0050657110 | Thyroid | PTC | nucleic acid transport | 98/5968 | 163/18723 | 9.08e-14 | 4.90e-12 | 98 |
| GO:0050658110 | Thyroid | PTC | RNA transport | 98/5968 | 163/18723 | 9.08e-14 | 4.90e-12 | 98 |
| GO:0015931110 | Thyroid | PTC | nucleobase-containing compound transport | 120/5968 | 222/18723 | 5.45e-12 | 2.35e-10 | 120 |
| GO:005102817 | Thyroid | PTC | mRNA transport | 78/5968 | 130/18723 | 3.44e-11 | 1.26e-09 | 78 |
| GO:00069977 | Thyroid | PTC | nucleus organization | 65/5968 | 133/18723 | 3.16e-05 | 3.01e-04 | 65 |
| Page: 1 2 |
| Pathway ID | Tissue | Disease Stage | Description | Gene Ratio | Bg Ratio | pvalue | p.adjust | qvalue | Count |
| hsa05014210 | Esophagus | ESCC | Amyotrophic lateral sclerosis | 266/4205 | 364/8465 | 1.31e-20 | 2.20e-18 | 1.13e-18 | 266 |
| hsa0301321 | Esophagus | ESCC | Nucleocytoplasmic transport | 89/4205 | 108/8465 | 1.20e-12 | 2.37e-11 | 1.21e-11 | 89 |
| hsa0501438 | Esophagus | ESCC | Amyotrophic lateral sclerosis | 266/4205 | 364/8465 | 1.31e-20 | 2.20e-18 | 1.13e-18 | 266 |
| hsa0301331 | Esophagus | ESCC | Nucleocytoplasmic transport | 89/4205 | 108/8465 | 1.20e-12 | 2.37e-11 | 1.21e-11 | 89 |
| Page: 1 |
Top |
Cell-cell communication analysis |
| Identification of potential cell-cell interactions between two cell types and their ligand-receptor pairs for different disease states |
| Ligand | Receptor | LRpair | Pathway | Tissue | Disease Stage |
| Page: 1 |
Top |
Single-cell gene regulatory network inference analysis |
| Find out the significant the regulons (TFs) and the target genes of each regulon across cell types for different disease states |
| TF | Cell Type | Tissue | Disease Stage | Target Gene | RSS | Regulon Activity |
| ∗The dot plots of a searched regulon are shown for all cell subpopulations in each disease state of each tissue based on the regulon specific score inferred using pySCENIC and by calculating the average expression. |
| Page: 1 |
Top |
Somatic mutation of malignant transformation related genes |
| Annotation of somatic variants for genes involved in malignant transformation |
| Hugo Symbol | Variant Class | Variant Classification | dbSNP RS | HGVSc | HGVSp | HGVSp Short | SWISSPROT | BIOTYPE | SIFT | PolyPhen | Tumor Sample Barcode | Tissue | Histology | Sex | Age | Stage | Therapy Types | Drugs | Outcome |
| NUP205 | SNV | Missense_Mutation | novel | c.1102N>T | p.Val368Phe | p.V368F | Q92621 | protein_coding | deleterious(0) | possibly_damaging(0.694) | TCGA-A8-A06P-01 | Breast | breast invasive carcinoma | Female | <65 | III/IV | Unspecific | SD | |
| NUP205 | SNV | Missense_Mutation | c.3437A>G | p.Asp1146Gly | p.D1146G | Q92621 | protein_coding | deleterious(0) | probably_damaging(0.977) | TCGA-A8-A08R-01 | Breast | breast invasive carcinoma | Female | <65 | I/II | Unknown | Unknown | SD | |
| NUP205 | SNV | Missense_Mutation | rs566054477 | c.5899N>A | p.Ala1967Thr | p.A1967T | Q92621 | protein_coding | tolerated(0.2) | benign(0.003) | TCGA-AO-A0J5-01 | Breast | breast invasive carcinoma | Female | <65 | III/IV | Other, specify in notesBisphosphonate | zoledronic | PD |
| NUP205 | SNV | Missense_Mutation | rs367553464 | c.4772G>A | p.Arg1591His | p.R1591H | Q92621 | protein_coding | tolerated(0.11) | probably_damaging(0.91) | TCGA-BH-A0HN-01 | Breast | breast invasive carcinoma | Female | >=65 | I/II | Hormone Therapy | arimidex | SD |
| NUP205 | SNV | Missense_Mutation | novel | c.118N>T | p.Asp40Tyr | p.D40Y | Q92621 | protein_coding | deleterious(0) | probably_damaging(0.957) | TCGA-BH-A209-01 | Breast | breast invasive carcinoma | Female | >=65 | I/II | Unknown | Unknown | SD |
| NUP205 | SNV | Missense_Mutation | c.1425C>G | p.Ile475Met | p.I475M | Q92621 | protein_coding | tolerated(0.29) | benign(0.048) | TCGA-D8-A1J8-01 | Breast | breast invasive carcinoma | Female | >=65 | I/II | Hormone Therapy | nolvadex | SD | |
| NUP205 | SNV | Missense_Mutation | rs547020231 | c.1433N>G | p.Ser478Cys | p.S478C | Q92621 | protein_coding | deleterious(0.01) | possibly_damaging(0.853) | TCGA-E2-A152-01 | Breast | breast invasive carcinoma | Female | <65 | I/II | Targeted Molecular therapy | trastuzumab | PD |
| NUP205 | insertion | Frame_Shift_Ins | novel | c.4902_4903insTTCTATTCTAAACACAGCATTTTCAATATAGTATATA | p.Met1635PhefsTer32 | p.M1635Ffs*32 | Q92621 | protein_coding | TCGA-A2-A0EO-01 | Breast | breast invasive carcinoma | Female | <65 | I/II | Hormone Therapy | tamoxiphen | SD | ||
| NUP205 | insertion | Frame_Shift_Ins | novel | c.4607_4608insCCTCCTTCATTTATTTA | p.Leu1536PhefsTer18 | p.L1536Ffs*18 | Q92621 | protein_coding | TCGA-C8-A134-01 | Breast | breast invasive carcinoma | Female | <65 | I/II | Chemotherapy | 5-fluorouracil | CR | ||
| NUP205 | SNV | Missense_Mutation | rs554848551 | c.3155C>T | p.Ala1052Val | p.A1052V | Q92621 | protein_coding | tolerated(0.2) | benign(0.058) | TCGA-2W-A8YY-01 | Cervix | cervical & endocervical cancer | Female | <65 | I/II | Chemotherapy | cisplatin | CR |
| Page: 1 2 3 4 5 6 7 8 9 10 11 12 13 14 15 16 17 18 19 20 21 22 |
Top |
Related drugs of malignant transformation related genes |
| Identification of chemicals and drugs interact with genes involved in malignant transfromation |
| (DGIdb 4.0) |
| Entrez ID | Symbol | Category | Interaction Types | Drug Claim Name | Drug Name | PMIDs |
| Page: 1 |

Copyright 2023-Present -The University of Texas Health Science Center at Houston |