
|
|||||
|
 | |
| |
| |
| |
| |
| |
|
Gene: NUMBL |
Gene summary for NUMBL |
| Gene information | Species | Human | Gene symbol | NUMBL | Gene ID | 9253 |
| Gene name | NUMB like endocytic adaptor protein | |
| Gene Alias | CAG3A | |
| Cytomap | 19q13.2 | |
| Gene Type | protein-coding | GO ID | GO:0000902 | UniProtAcc | A0A0C4DGH3 |
Top |
Malignant transformation analysis |
| Identification of the aberrant gene expression in precancerous and cancerous lesions by comparing the gene expression of stem-like cells in diseased tissues with normal stem cells |
| Entrez ID | Symbol | Replicates | Species | Organ | Tissue | Adj P-value | Log2FC | Malignancy |
| 9253 | NUMBL | HCC1_Meng | Human | Liver | HCC | 2.05e-11 | 1.07e-02 | 0.0246 |
| 9253 | NUMBL | HCC2 | Human | Liver | HCC | 3.05e-03 | 5.68e-01 | 0.5341 |
| 9253 | NUMBL | HCC5 | Human | Liver | HCC | 1.31e-06 | 1.03e+00 | 0.4932 |
| 9253 | NUMBL | S014 | Human | Liver | HCC | 9.12e-05 | 2.37e-01 | 0.2254 |
| 9253 | NUMBL | S016 | Human | Liver | HCC | 2.85e-09 | 2.99e-01 | 0.2243 |
| 9253 | NUMBL | S028 | Human | Liver | HCC | 3.06e-02 | 1.58e-01 | 0.2503 |
| 9253 | NUMBL | C04 | Human | Oral cavity | OSCC | 3.25e-08 | 2.46e-01 | 0.2633 |
| 9253 | NUMBL | C21 | Human | Oral cavity | OSCC | 7.14e-04 | 1.22e-01 | 0.2678 |
| 9253 | NUMBL | C30 | Human | Oral cavity | OSCC | 5.97e-20 | 5.76e-01 | 0.3055 |
| 9253 | NUMBL | C38 | Human | Oral cavity | OSCC | 1.52e-05 | 3.92e-01 | 0.172 |
| 9253 | NUMBL | C43 | Human | Oral cavity | OSCC | 1.33e-08 | 1.68e-01 | 0.1704 |
| 9253 | NUMBL | C51 | Human | Oral cavity | OSCC | 1.79e-02 | 1.53e-01 | 0.2674 |
| 9253 | NUMBL | C57 | Human | Oral cavity | OSCC | 1.01e-03 | 1.10e-01 | 0.1679 |
| 9253 | NUMBL | C08 | Human | Oral cavity | OSCC | 1.57e-14 | 4.02e-01 | 0.1919 |
| 9253 | NUMBL | C09 | Human | Oral cavity | OSCC | 3.14e-04 | 1.05e-01 | 0.1431 |
| 9253 | NUMBL | LN22 | Human | Oral cavity | OSCC | 9.83e-12 | 9.65e-01 | 0.1733 |
| 9253 | NUMBL | LN46 | Human | Oral cavity | OSCC | 3.87e-03 | 1.27e-01 | 0.1666 |
| 9253 | NUMBL | SYSMH1 | Human | Oral cavity | OSCC | 5.50e-06 | 1.14e-01 | 0.1127 |
| 9253 | NUMBL | SYSMH2 | Human | Oral cavity | OSCC | 5.45e-03 | 1.11e-01 | 0.2326 |
| 9253 | NUMBL | SYSMH3 | Human | Oral cavity | OSCC | 1.23e-05 | 1.58e-01 | 0.2442 |
| Page: 1 2 |
| Tissue | Expression Dynamics | Abbreviation |
| Liver | 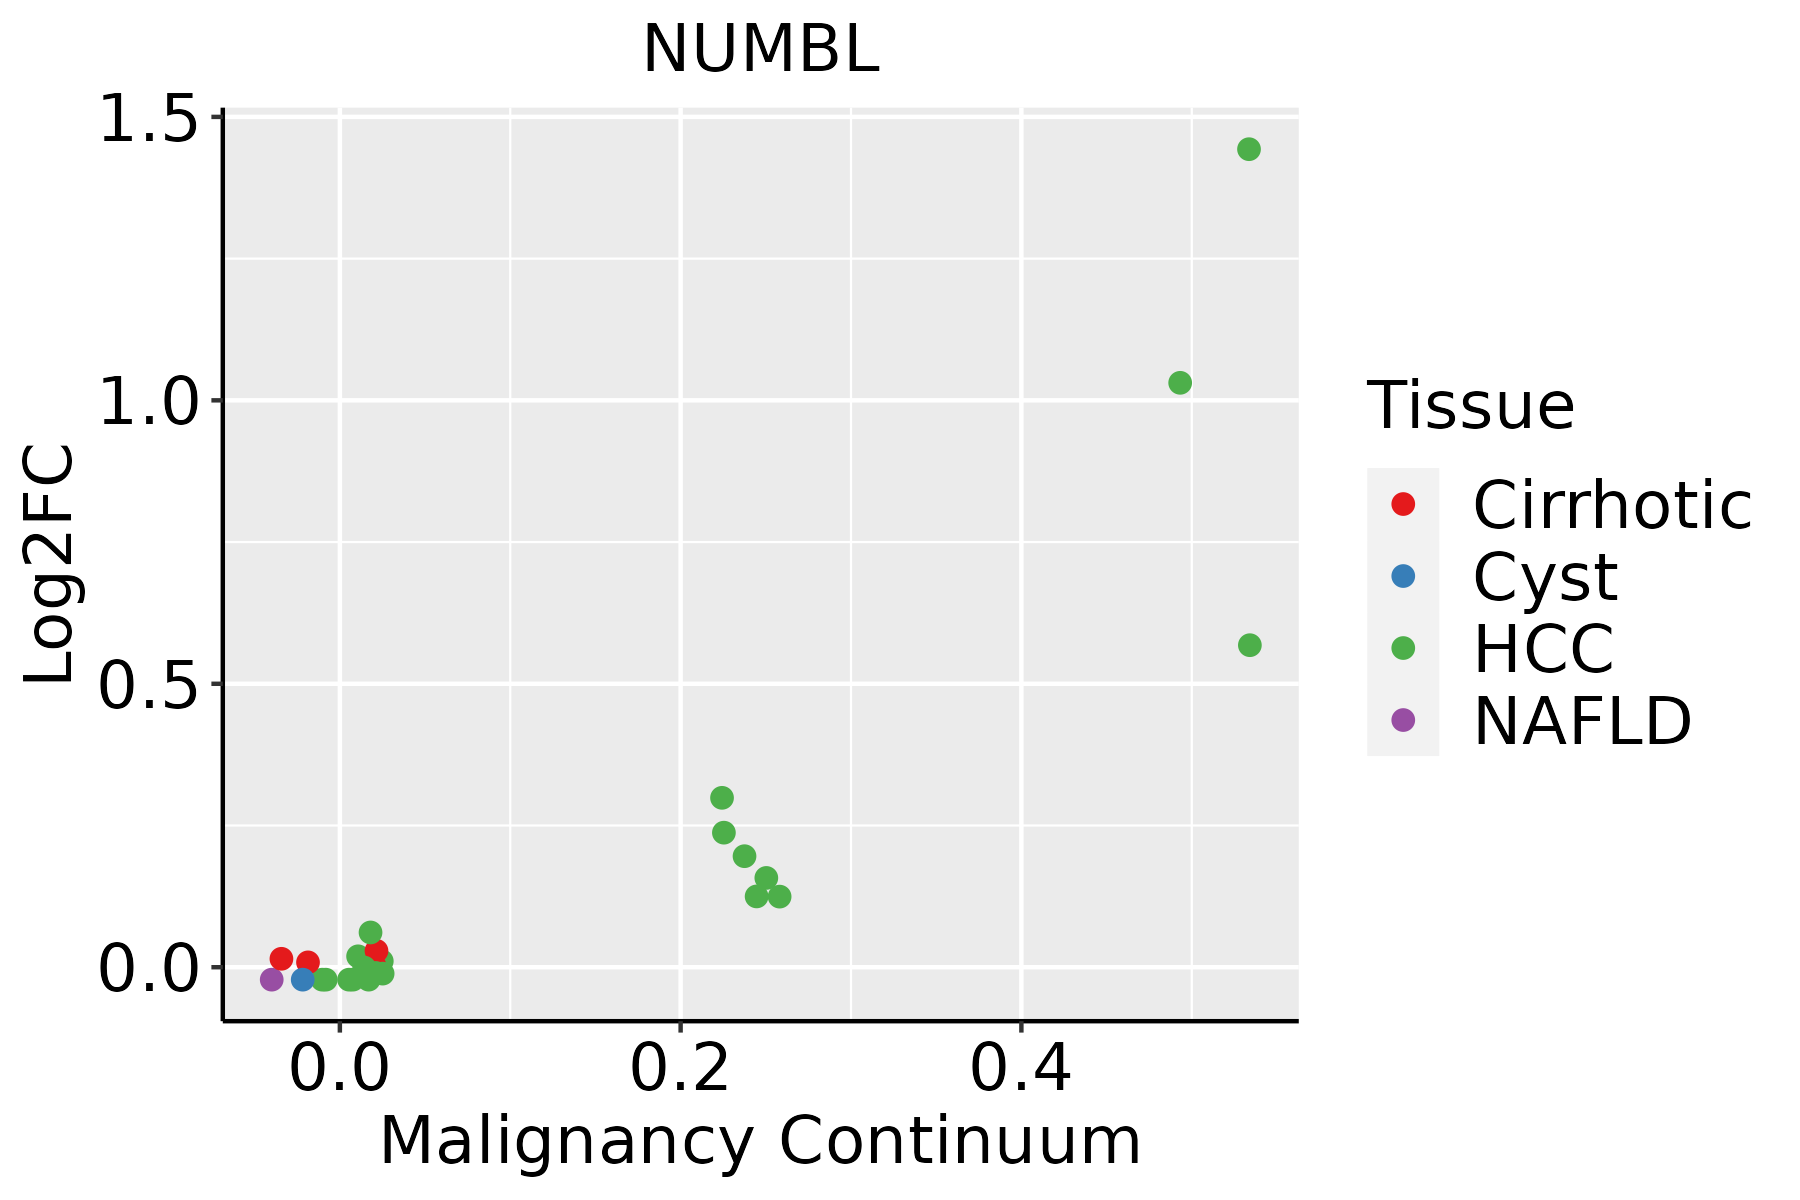 | HCC: Hepatocellular carcinoma |
| NAFLD: Non-alcoholic fatty liver disease | ||
| Oral Cavity | 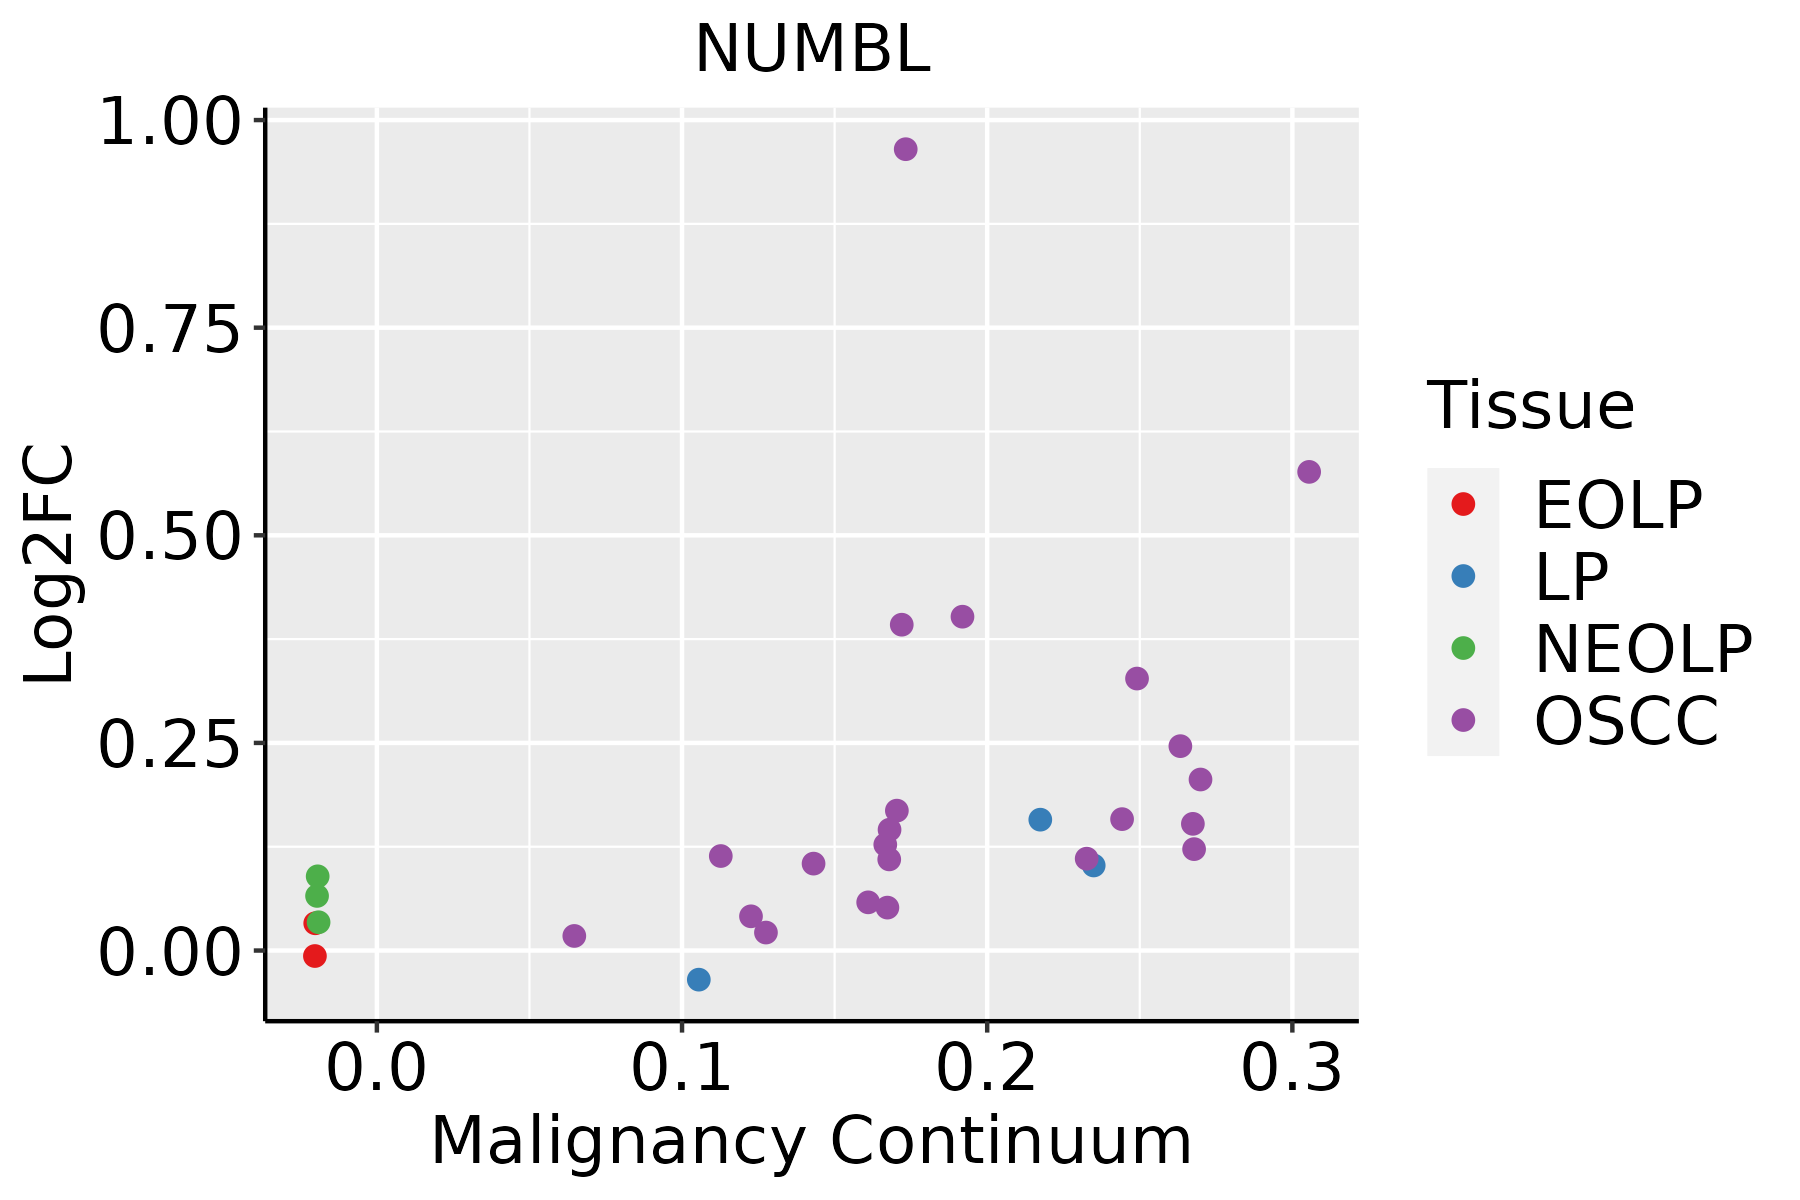 | EOLP: Erosive Oral lichen planus |
| LP: leukoplakia | ||
| NEOLP: Non-erosive oral lichen planus | ||
| OSCC: Oral squamous cell carcinoma | ||
| Thyroid | 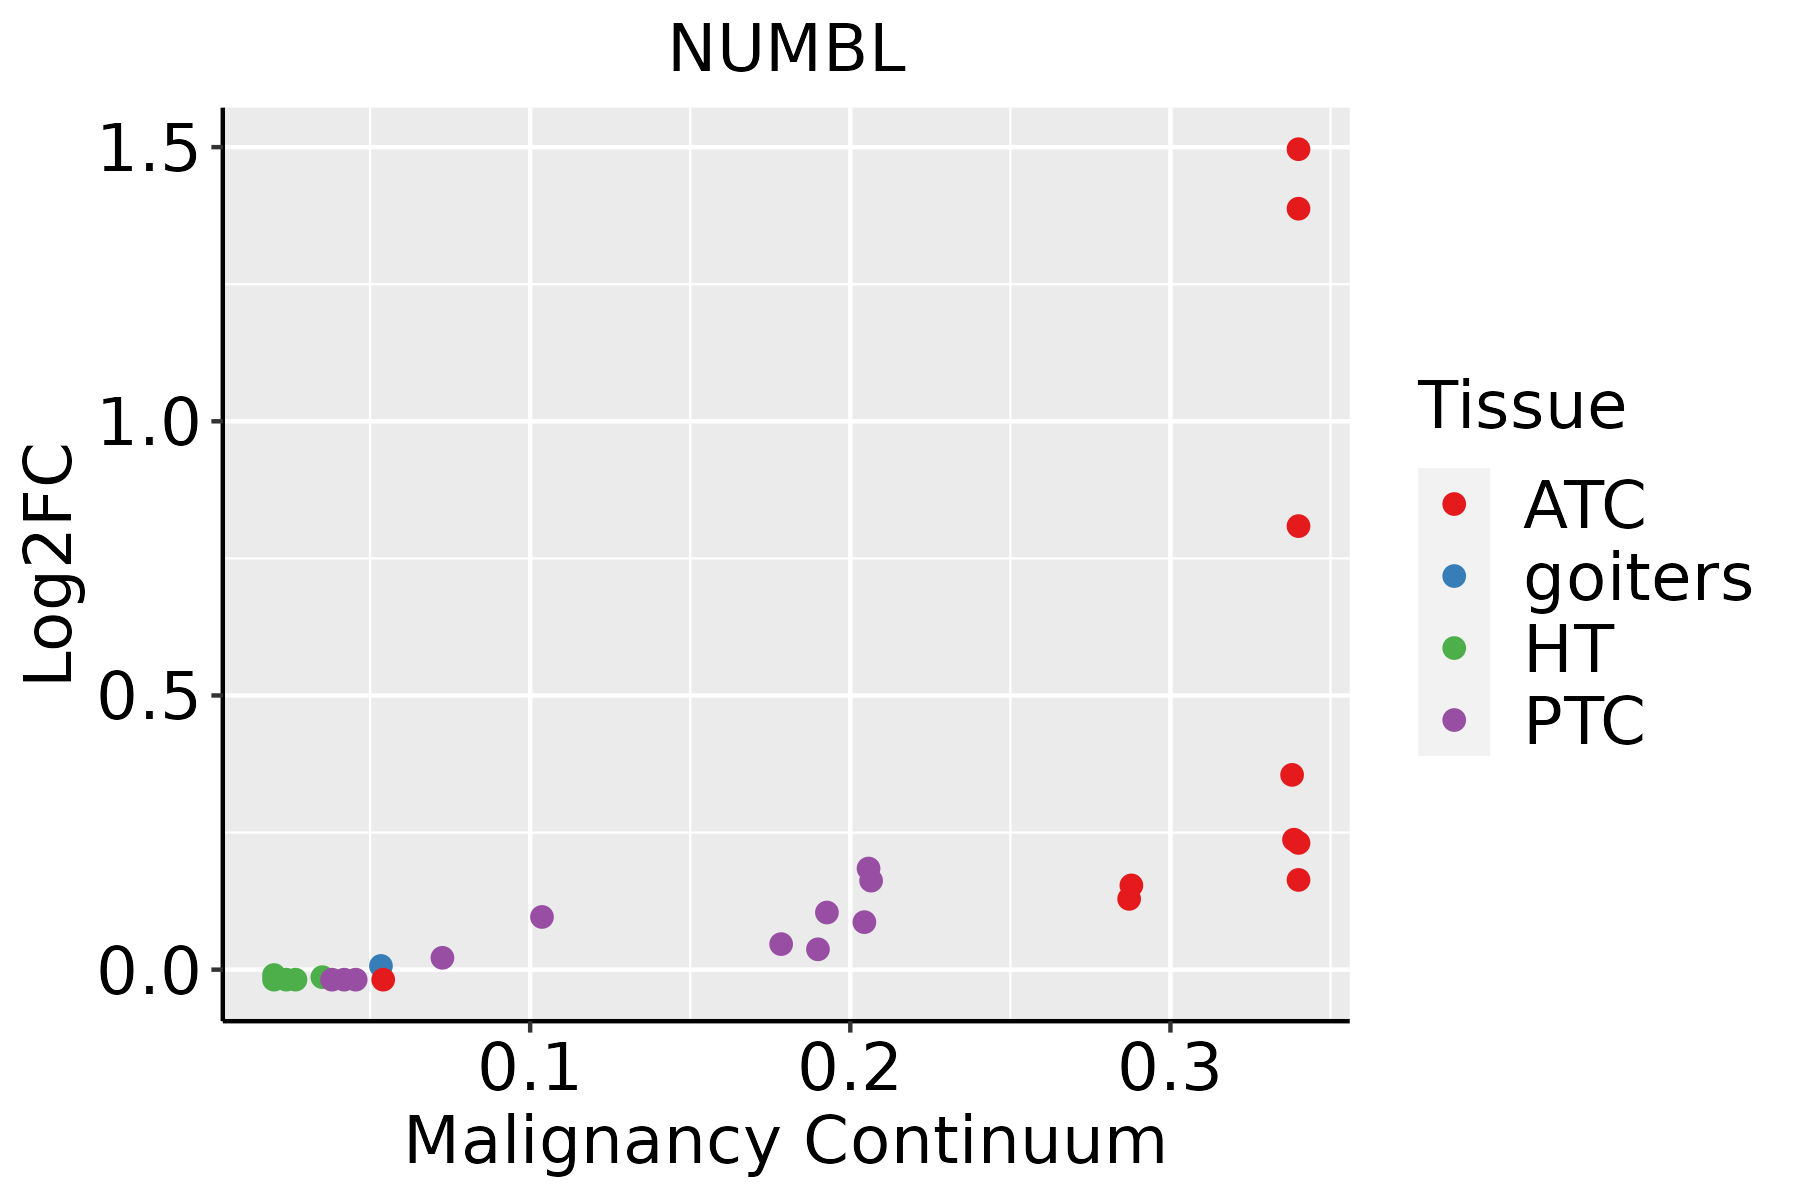 | ATC: Anaplastic thyroid cancer |
| HT: Hashimoto's thyroiditis | ||
| PTC: Papillary thyroid cancer |
| ∗log2FC in expression of this searched gene in stem-like cells from each diseased tissue sample relative to stem-like cells in normal samples in each tissue plotted against the malignancy continuum. Samples are colored based on if they are from different disease stage. |
Top |
Malignant transformation related pathway analysis |
| Find out the enriched GO biological processes and KEGG pathways involved in transition from healthy to precancer to cancer |
| Tissue | Disease Stage | Enriched GO biological Processes |
| Colorectum | AD |  |
| Colorectum | SER |  |
| Colorectum | MSS |  |
| Colorectum | MSI-H |  |
| Colorectum | FAP |  |
| ∗Top 15 enriched GO BP terms are showed in the bar plot of each disease state in each tissue. Each row represents a significant GO biological process which is colored according to the -log10(p.adjust). |
| Page: 1 2 3 4 5 6 7 8 9 |
| GO ID | Tissue | Disease Stage | Description | Gene Ratio | Bg Ratio | pvalue | p.adjust | Count |
| GO:001072011 | Liver | HCC | positive regulation of cell development | 155/7958 | 298/18723 | 5.39e-04 | 3.48e-03 | 155 |
| GO:004521622 | Liver | HCC | cell-cell junction organization | 107/7958 | 200/18723 | 1.06e-03 | 6.11e-03 | 107 |
| GO:00507674 | Liver | HCC | regulation of neurogenesis | 181/7958 | 364/18723 | 3.00e-03 | 1.40e-02 | 181 |
| GO:00507693 | Liver | HCC | positive regulation of neurogenesis | 116/7958 | 225/18723 | 3.67e-03 | 1.63e-02 | 116 |
| GO:003433211 | Liver | HCC | adherens junction organization | 30/7958 | 49/18723 | 6.31e-03 | 2.57e-02 | 30 |
| GO:00107209 | Oral cavity | OSCC | positive regulation of cell development | 159/7305 | 298/18723 | 3.06e-07 | 4.66e-06 | 159 |
| GO:00507696 | Oral cavity | OSCC | positive regulation of neurogenesis | 120/7305 | 225/18723 | 8.45e-06 | 9.02e-05 | 120 |
| GO:00507679 | Oral cavity | OSCC | regulation of neurogenesis | 179/7305 | 364/18723 | 4.49e-05 | 3.84e-04 | 179 |
| GO:00192214 | Oral cavity | OSCC | cytokine-mediated signaling pathway | 222/7305 | 472/18723 | 2.02e-04 | 1.35e-03 | 222 |
| GO:00519624 | Oral cavity | OSCC | positive regulation of nervous system development | 135/7305 | 272/18723 | 2.20e-04 | 1.44e-03 | 135 |
| GO:00519605 | Oral cavity | OSCC | regulation of nervous system development | 205/7305 | 443/18723 | 9.80e-04 | 5.11e-03 | 205 |
| GO:004521618 | Oral cavity | OSCC | cell-cell junction organization | 97/7305 | 200/18723 | 3.83e-03 | 1.57e-02 | 97 |
| GO:0021591 | Oral cavity | OSCC | ventricular system development | 18/7305 | 29/18723 | 1.00e-02 | 3.49e-02 | 18 |
| GO:006156410 | Oral cavity | OSCC | axon development | 207/7305 | 467/18723 | 1.01e-02 | 3.51e-02 | 207 |
| GO:001072018 | Thyroid | PTC | positive regulation of cell development | 138/5968 | 298/18723 | 1.13e-07 | 2.22e-06 | 138 |
| GO:006156419 | Thyroid | PTC | axon development | 199/5968 | 467/18723 | 5.27e-07 | 8.53e-06 | 199 |
| GO:000740918 | Thyroid | PTC | axonogenesis | 178/5968 | 418/18723 | 2.17e-06 | 2.91e-05 | 178 |
| GO:005076914 | Thyroid | PTC | positive regulation of neurogenesis | 105/5968 | 225/18723 | 2.28e-06 | 3.05e-05 | 105 |
| GO:005076716 | Thyroid | PTC | regulation of neurogenesis | 156/5968 | 364/18723 | 5.86e-06 | 7.05e-05 | 156 |
| GO:0045216111 | Thyroid | PTC | cell-cell junction organization | 93/5968 | 200/18723 | 1.01e-05 | 1.12e-04 | 93 |
| Page: 1 2 |
| Pathway ID | Tissue | Disease Stage | Description | Gene Ratio | Bg Ratio | pvalue | p.adjust | qvalue | Count |
| hsa043305 | Oral cavity | OSCC | Notch signaling pathway | 44/3704 | 62/8465 | 1.26e-05 | 5.55e-05 | 2.83e-05 | 44 |
| hsa0433012 | Oral cavity | OSCC | Notch signaling pathway | 44/3704 | 62/8465 | 1.26e-05 | 5.55e-05 | 2.83e-05 | 44 |
| Page: 1 |
Top |
Cell-cell communication analysis |
| Identification of potential cell-cell interactions between two cell types and their ligand-receptor pairs for different disease states |
| Ligand | Receptor | LRpair | Pathway | Tissue | Disease Stage |
| Page: 1 |
Top |
Single-cell gene regulatory network inference analysis |
| Find out the significant the regulons (TFs) and the target genes of each regulon across cell types for different disease states |
| TF | Cell Type | Tissue | Disease Stage | Target Gene | RSS | Regulon Activity |
| ∗The dot plots of a searched regulon are shown for all cell subpopulations in each disease state of each tissue based on the regulon specific score inferred using pySCENIC and by calculating the average expression. |
| Page: 1 |
Top |
Somatic mutation of malignant transformation related genes |
| Annotation of somatic variants for genes involved in malignant transformation |
| Hugo Symbol | Variant Class | Variant Classification | dbSNP RS | HGVSc | HGVSp | HGVSp Short | SWISSPROT | BIOTYPE | SIFT | PolyPhen | Tumor Sample Barcode | Tissue | Histology | Sex | Age | Stage | Therapy Types | Drugs | Outcome |
| NUMBL | SNV | Missense_Mutation | c.715N>G | p.Pro239Ala | p.P239A | Q9Y6R0 | protein_coding | tolerated(0.8) | benign(0) | TCGA-AR-A1AU-01 | Breast | breast invasive carcinoma | Female | <65 | III/IV | Chemotherapy | doxorubicin | SD | |
| NUMBL | SNV | Missense_Mutation | c.448G>C | p.Asp150His | p.D150H | Q9Y6R0 | protein_coding | deleterious(0) | probably_damaging(0.994) | TCGA-MY-A913-01 | Cervix | cervical & endocervical cancer | Female | <65 | I/II | Chemotherapy | cisplatin | CR | |
| NUMBL | SNV | Missense_Mutation | c.445N>T | p.Pro149Ser | p.P149S | Q9Y6R0 | protein_coding | deleterious(0.02) | possibly_damaging(0.896) | TCGA-AA-3821-01 | Colorectum | colon adenocarcinoma | Female | >=65 | I/II | Unknown | Unknown | SD | |
| NUMBL | SNV | Missense_Mutation | rs760792387 | c.28N>A | p.Gly10Arg | p.G10R | Q9Y6R0 | protein_coding | tolerated_low_confidence(0.25) | benign(0.003) | TCGA-AA-3846-01 | Colorectum | colon adenocarcinoma | Female | >=65 | I/II | Unknown | Unknown | SD |
| NUMBL | SNV | Missense_Mutation | novel | c.424G>A | p.Glu142Lys | p.E142K | Q9Y6R0 | protein_coding | deleterious(0) | benign(0.425) | TCGA-AA-3984-01 | Colorectum | colon adenocarcinoma | Female | <65 | I/II | Unknown | Unknown | SD |
| NUMBL | SNV | Missense_Mutation | rs774749633 | c.412G>A | p.Asp138Asn | p.D138N | Q9Y6R0 | protein_coding | deleterious(0.02) | benign(0.4) | TCGA-AA-A00N-01 | Colorectum | colon adenocarcinoma | Male | >=65 | I/II | Unknown | Unknown | PD |
| NUMBL | SNV | Missense_Mutation | rs746765421 | c.1357G>T | p.Val453Leu | p.V453L | Q9Y6R0 | protein_coding | tolerated(0.47) | benign(0) | TCGA-AY-6197-01 | Colorectum | colon adenocarcinoma | Male | <65 | I/II | Unknown | Unknown | SD |
| NUMBL | SNV | Missense_Mutation | c.1666N>T | p.Arg556Cys | p.R556C | Q9Y6R0 | protein_coding | tolerated_low_confidence(0.06) | possibly_damaging(0.586) | TCGA-D5-6928-01 | Colorectum | colon adenocarcinoma | Male | >=65 | I/II | Unknown | Unknown | SD | |
| NUMBL | SNV | Missense_Mutation | novel | c.1489N>G | p.Leu497Val | p.L497V | Q9Y6R0 | protein_coding | tolerated_low_confidence(0.15) | benign(0.066) | TCGA-AP-A1DV-01 | Endometrium | uterine corpus endometrioid carcinoma | Female | <65 | I/II | Unknown | Unknown | SD |
| NUMBL | SNV | Missense_Mutation | novel | c.637N>A | p.Asp213Asn | p.D213N | Q9Y6R0 | protein_coding | deleterious(0.02) | benign(0.34) | TCGA-AX-A2HD-01 | Endometrium | uterine corpus endometrioid carcinoma | Female | >=65 | III/IV | Unknown | Unknown | SD |
| Page: 1 2 3 |
Top |
Related drugs of malignant transformation related genes |
| Identification of chemicals and drugs interact with genes involved in malignant transfromation |
| (DGIdb 4.0) |
| Entrez ID | Symbol | Category | Interaction Types | Drug Claim Name | Drug Name | PMIDs |
| Page: 1 |

Copyright 2023-Present -The University of Texas Health Science Center at Houston |