Schematic overview of the cellular and molecular mechanisms involved in the cancer progression, including the proposed cellular and molecular mechanisms in cancer cells trajectory. AT1: alveolar type 1 cells; AT2: alveolar type 2 cells; AAH: atypical adenomatous hyperplasia; AIS: adenocarcinoma in situ; MIA: minimally invasive adenocarcinoma; IA: invasive adenocarcinoma; EMT: epithelial-mesenchymal transition

Home

Download

Statistics

Help

Contact

Center for Computational Systems Medicine
leaf

Gene summary

leaf

Malignant transformation analysis

leaf

Malignant transformation related pathway analysis

leaf

Cell-cell communication analysis

leaf

Single-cell gene regulatory network inference analysis

leaf

Somatic mutation of malignant transformation related genes

leaf

Related drugs of malignant transformation related genes

Gene: NUMA1

Gene summary for NUMA1

check button Gene summary.

Gene informationSpeciesHuman
Gene symbol

NUMA1

Gene ID

4926

Gene namenuclear mitotic apparatus protein 1
Gene AliasNMP-22
Cytomap11q13.4
Gene Typeprotein-coding
GO ID

GO:0000003

UniProtAcc

A0A024R5M9


Top

Malignant transformation analysis

check button Identification of the aberrant gene expression in precancerous and cancerous lesions by comparing the gene expression of stem-like cells in diseased tissues with normal stem cells
check button Malignant transformation involving gene list.
Entrez IDSymbolReplicatesSpeciesOrganTissueAdj P-valueLog2FCMalignancy
4926NUMA1GSM4909291HumanBreastIDC1.09e-033.98e-010.1753
4926NUMA1GSM4909296HumanBreastIDC2.17e-032.94e-020.1524
4926NUMA1GSM4909297HumanBreastIDC2.40e-07-1.25e-010.1517
4926NUMA1GSM4909311HumanBreastIDC8.26e-12-3.16e-020.1534
4926NUMA1GSM4909312HumanBreastIDC3.12e-023.94e-020.1552
4926NUMA1GSM4909319HumanBreastIDC7.92e-15-1.28e-010.1563
4926NUMA1GSM4909321HumanBreastIDC5.08e-07-1.01e-010.1559
4926NUMA1brca1HumanBreastPrecancer1.63e-05-1.35e-01-0.0338
4926NUMA1M1HumanBreastIDC3.80e-145.86e-010.1577
4926NUMA1M5HumanBreastIDC6.85e-088.05e-010.1598
4926NUMA1P1HumanBreastIDC3.51e-031.19e-010.1527
4926NUMA1DCIS2HumanBreastDCIS1.09e-563.51e-010.0085
4926NUMA1LZE2THumanEsophagusESCC3.68e-054.70e-010.082
4926NUMA1LZE4THumanEsophagusESCC5.62e-124.56e-010.0811
4926NUMA1LZE5THumanEsophagusESCC3.47e-021.07e-010.0514
4926NUMA1LZE7THumanEsophagusESCC1.75e-082.70e-010.0667
4926NUMA1LZE8THumanEsophagusESCC3.91e-141.81e-010.067
4926NUMA1LZE20THumanEsophagusESCC1.88e-071.83e-010.0662
4926NUMA1LZE22D1HumanEsophagusHGIN4.14e-035.57e-010.0595
4926NUMA1LZE22THumanEsophagusESCC8.29e-071.05e+000.068
Page: 1 2 3 4 5 6 7 8 9 

check button Transcriptomic changes along malignancy continuum.
TissueExpression DynamicsAbbreviation
BreastThe image shows the transcriptomic changes along malignancy continuum.log2FC in expression of this searched gene in stem-like cells from each diseased tissue sample relative to stem-like cells in normal samples in each tissue plotted against the malignancy continuum. Samples are colored based on if they are from different disease stage.IDC: Invasive ductal carcinoma
DCIS: Ductal carcinoma in situ
Precancer(BRCA1-mut): Precancerous lesion from BRCA1 mutation carriers
EsophagusThe image shows the transcriptomic changes along malignancy continuum.log2FC in expression of this searched gene in stem-like cells from each diseased tissue sample relative to stem-like cells in normal samples in each tissue plotted against the malignancy continuum. Samples are colored based on if they are from different disease stage.ESCC: Esophageal squamous cell carcinoma
HGIN: High-grade intraepithelial neoplasias
LGIN: Low-grade intraepithelial neoplasias
LiverThe image shows the transcriptomic changes along malignancy continuum.log2FC in expression of this searched gene in stem-like cells from each diseased tissue sample relative to stem-like cells in normal samples in each tissue plotted against the malignancy continuum. Samples are colored based on if they are from different disease stage.HCC: Hepatocellular carcinoma
NAFLD: Non-alcoholic fatty liver disease
Oral CavityThe image shows the transcriptomic changes along malignancy continuum.log2FC in expression of this searched gene in stem-like cells from each diseased tissue sample relative to stem-like cells in normal samples in each tissue plotted against the malignancy continuum. Samples are colored based on if they are from different disease stage.EOLP: Erosive Oral lichen planus
LP: leukoplakia
NEOLP: Non-erosive oral lichen planus
OSCC: Oral squamous cell carcinoma
ProstateThe image shows the transcriptomic changes along malignancy continuum.log2FC in expression of this searched gene in stem-like cells from each diseased tissue sample relative to stem-like cells in normal samples in each tissue plotted against the malignancy continuum. Samples are colored based on if they are from different disease stage.
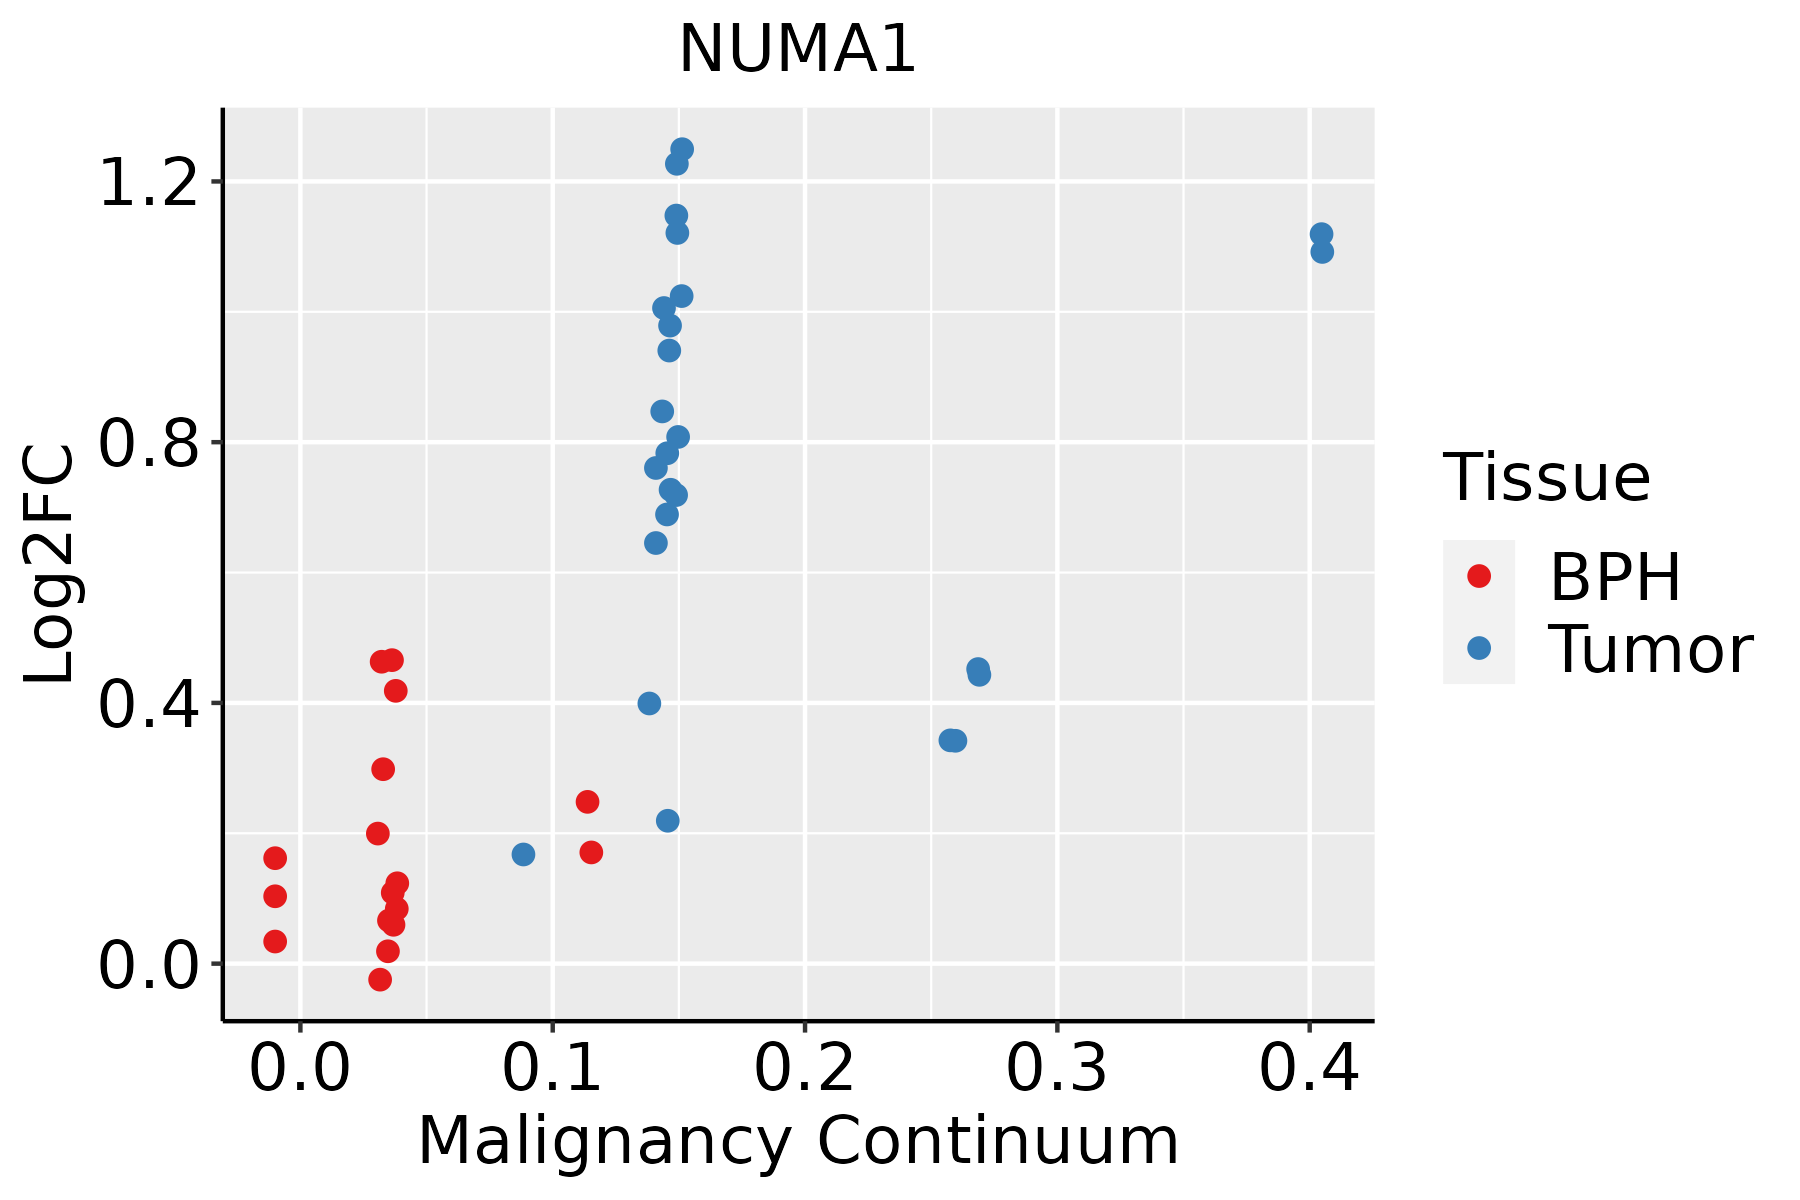
BPH: Benign Prostatic Hyperplasia
SkinThe image shows the transcriptomic changes along malignancy continuum.log2FC in expression of this searched gene in stem-like cells from each diseased tissue sample relative to stem-like cells in normal samples in each tissue plotted against the malignancy continuum. Samples are colored based on if they are from different disease stage.
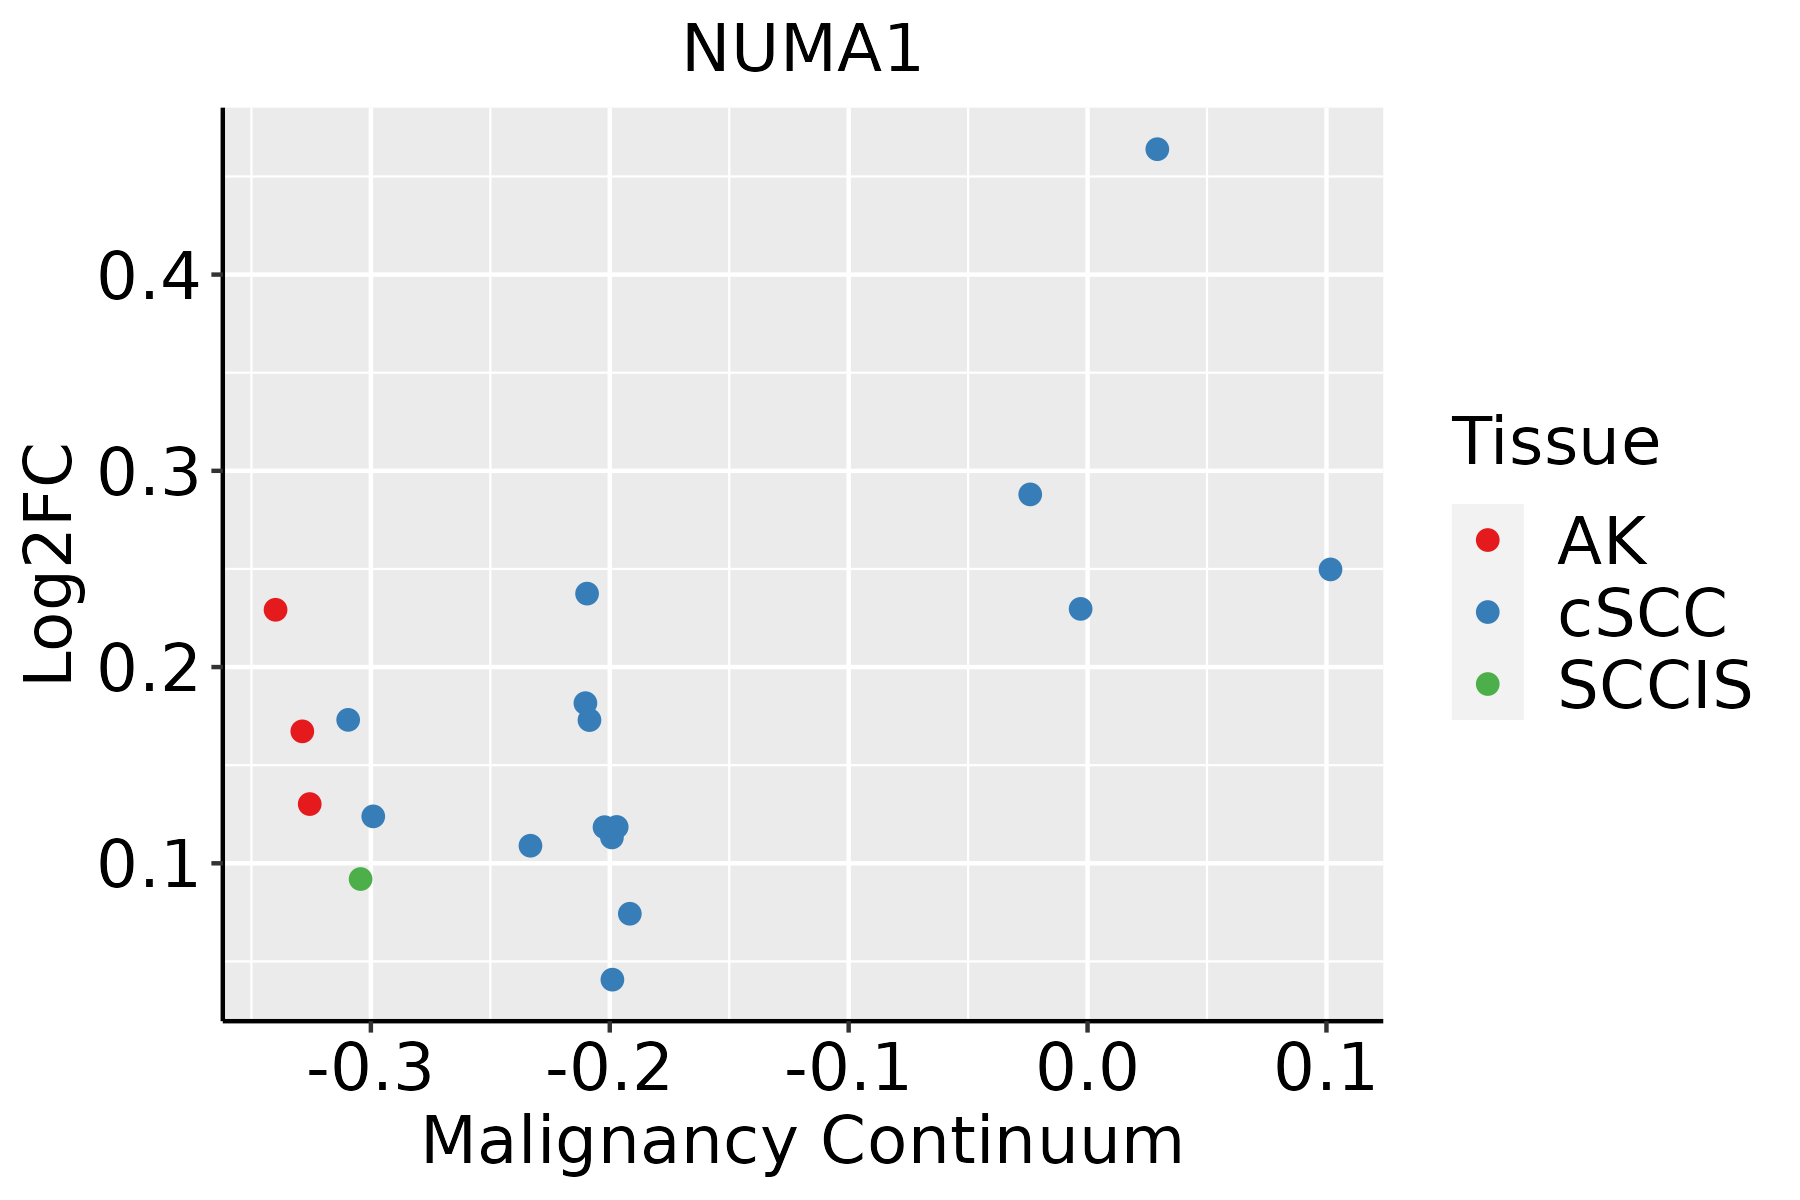
AK: Actinic keratosis
cSCC: Cutaneous squamous cell carcinoma
SCCIS:squamous cell carcinoma in situ
ThyroidThe image shows the transcriptomic changes along malignancy continuum.log2FC in expression of this searched gene in stem-like cells from each diseased tissue sample relative to stem-like cells in normal samples in each tissue plotted against the malignancy continuum. Samples are colored based on if they are from different disease stage.
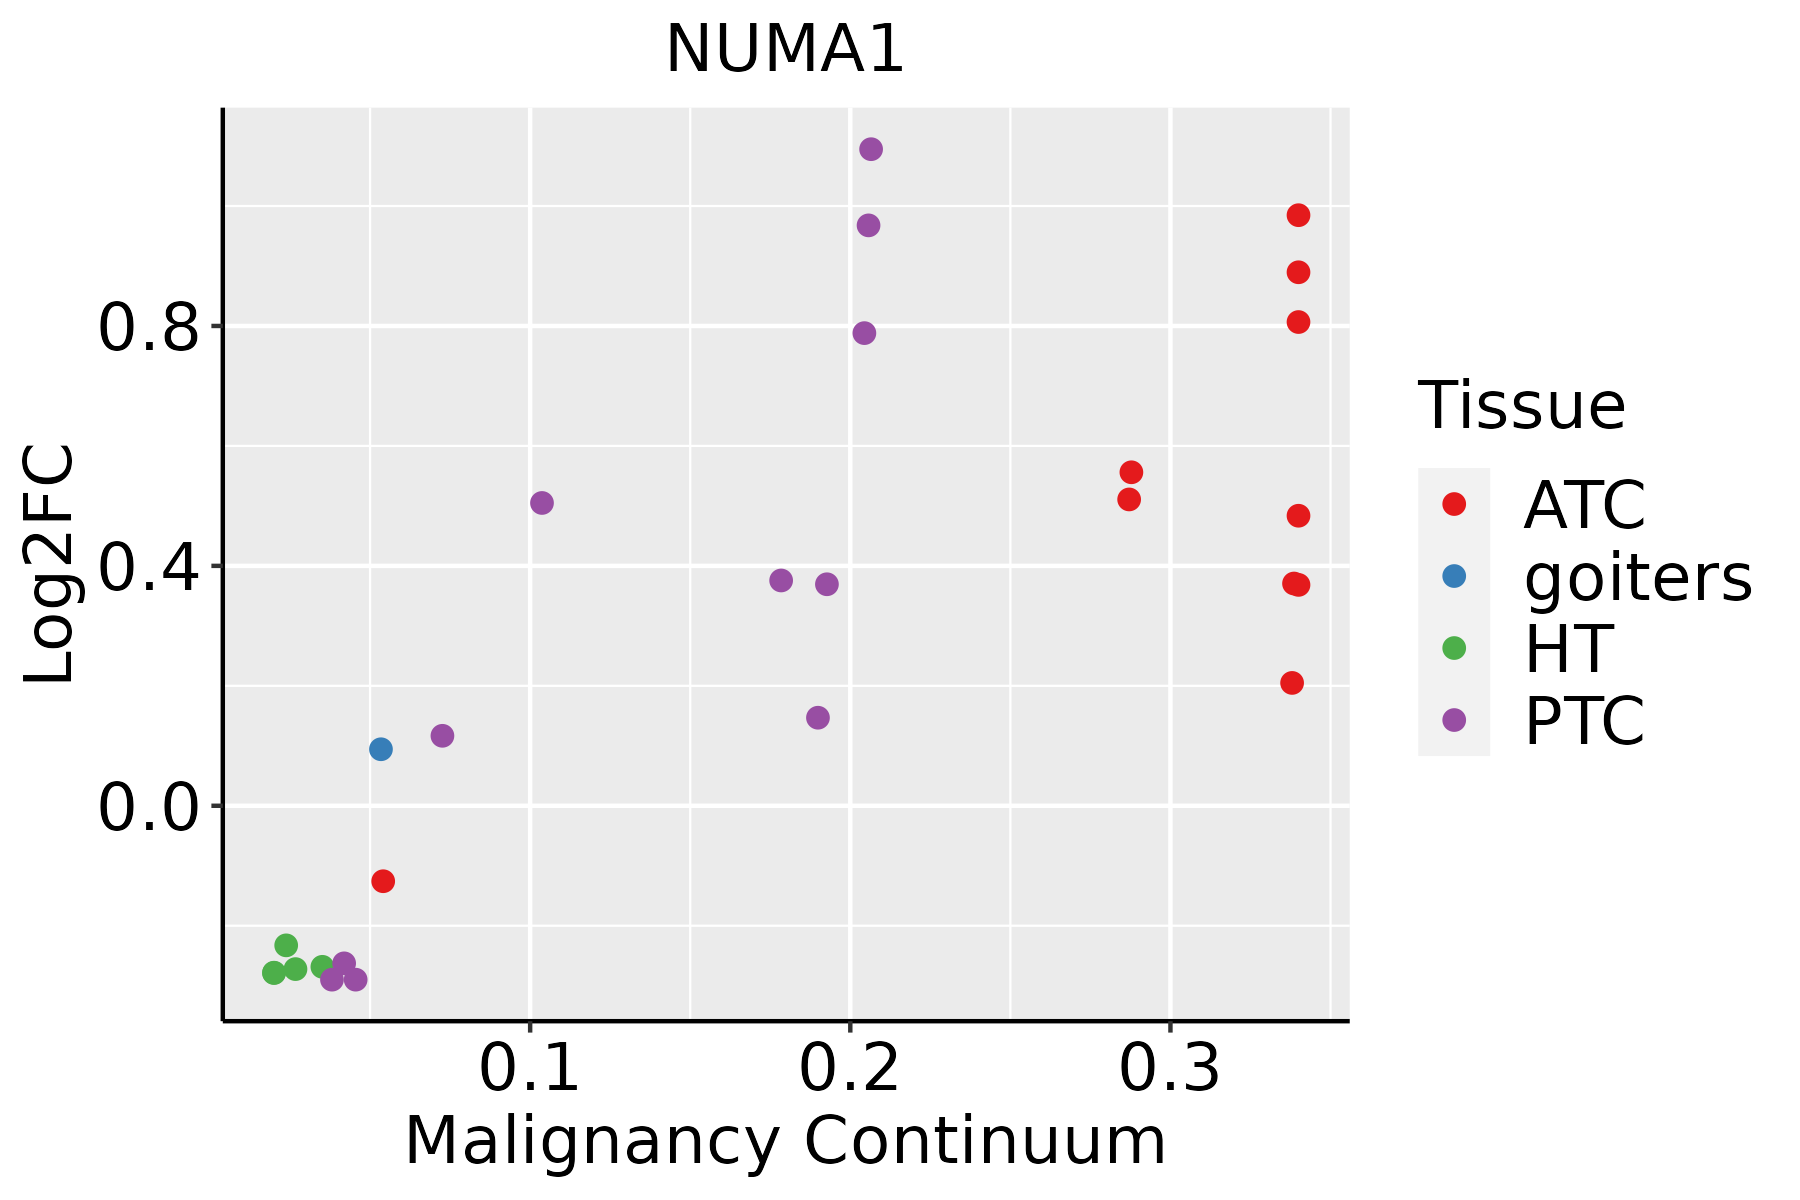
ATC: Anaplastic thyroid cancer
HT: Hashimoto's thyroiditis
PTC: Papillary thyroid cancer
∗log2FC in expression of this searched gene in stem-like cells from each diseased tissue sample relative to stem-like cells in normal samples in each tissue plotted against the malignancy continuum. Samples are colored based on if they are from different disease stage.

Top

Malignant transformation related pathway analysis

check buttonFind out the enriched GO biological processes and KEGG pathways involved in transition from healthy to precancer to cancer
check button Figure of enriched GO biological processes.
TissueDisease StageEnriched GO biological Processes
ColorectumADGO analysis - Figure of enriched GO biological processes: Top 15 enriched GO BP terms are showed in the bar plot of each disease state in each tissue. Each row represents a significant GO biological process which is colored according to the -log10(p.adjust).
ColorectumSERGO analysis - Figure of enriched GO biological processes: Top 15 enriched GO BP terms are showed in the bar plot of each disease state in each tissue. Each row represents a significant GO biological process which is colored according to the -log10(p.adjust).
ColorectumMSSGO analysis - Figure of enriched GO biological processes: Top 15 enriched GO BP terms are showed in the bar plot of each disease state in each tissue. Each row represents a significant GO biological process which is colored according to the -log10(p.adjust).
ColorectumMSI-HGO analysis - Figure of enriched GO biological processes: Top 15 enriched GO BP terms are showed in the bar plot of each disease state in each tissue. Each row represents a significant GO biological process which is colored according to the -log10(p.adjust).
ColorectumFAPGO analysis - Figure of enriched GO biological processes: Top 15 enriched GO BP terms are showed in the bar plot of each disease state in each tissue. Each row represents a significant GO biological process which is colored according to the -log10(p.adjust).
∗Top 15 enriched GO BP terms are showed in the bar plot of each disease state in each tissue. Each row represents a significant GO biological process which is colored according to the -log10(p.adjust).
Page: 1 2 3 4 5 6 7 8 9 

check button Enriched GO biological processes.
GO IDTissueDisease StageDescriptionGene RatioBg Ratiopvaluep.adjustCount
GO:00432549BreastPrecancerregulation of protein-containing complex assembly50/1080428/187231.63e-065.97e-0550
GO:00313349BreastPrecancerpositive regulation of protein-containing complex assembly33/1080237/187232.39e-068.21e-0533
GO:19029059BreastPrecancerpositive regulation of supramolecular fiber organization28/1080209/187232.79e-056.28e-0428
GO:19029039BreastPrecancerregulation of supramolecular fiber organization42/1080383/187234.92e-051.04e-0342
GO:00514959BreastPrecancerpositive regulation of cytoskeleton organization28/1080226/187231.13e-042.04e-0328
GO:00085445BreastPrecancerepidermis development35/1080324/187232.71e-043.96e-0335
GO:19038299BreastPrecancerpositive regulation of cellular protein localization30/1080276/187236.48e-047.99e-0330
GO:00322739BreastPrecancerpositive regulation of protein polymerization18/1080138/187239.85e-041.11e-0218
GO:00099136BreastPrecancerepidermal cell differentiation23/1080202/187231.43e-031.50e-0223
GO:20012529BreastPrecancerpositive regulation of chromosome organization12/108082/187232.51e-032.29e-0212
GO:00302163BreastPrecancerkeratinocyte differentiation17/1080139/187232.71e-032.39e-0217
GO:00071638BreastPrecancerestablishment or maintenance of cell polarity23/1080218/187233.82e-033.06e-0223
GO:19043757BreastPrecancerregulation of protein localization to cell periphery15/1080125/187235.58e-034.07e-0215
GO:19043778BreastPrecancerpositive regulation of protein localization to cell periphery10/108069/187235.98e-034.22e-0210
GO:190290514BreastIDCpositive regulation of supramolecular fiber organization37/1434209/187231.33e-065.75e-0537
GO:004325414BreastIDCregulation of protein-containing complex assembly61/1434428/187231.77e-067.31e-0561
GO:003133414BreastIDCpositive regulation of protein-containing complex assembly40/1434237/187231.77e-067.31e-0540
GO:190290314BreastIDCregulation of supramolecular fiber organization54/1434383/187239.40e-062.66e-0454
GO:003227314BreastIDCpositive regulation of protein polymerization25/1434138/187234.46e-051.01e-0325
GO:005149513BreastIDCpositive regulation of cytoskeleton organization35/1434226/187235.04e-051.09e-0335
Page: 1 2 3 4 5 6 7 8 9 10 11 12 13 14 15 16 17 18 19 20 21 22 23 24 25 26 27 28 29 30 31 32 33 34 35 36 37 38 39 40 41 42 

check button Enriched KEGG pathways.
Pathway IDTissueDisease StageDescriptionGene RatioBg Ratiopvaluep.adjustqvalueCount
Page: 1 

Top

Cell-cell communication analysis

check buttonIdentification of potential cell-cell interactions between two cell types and their ligand-receptor pairs for different disease states
LigandReceptorLRpairPathwayTissueDisease Stage
Page: 1 

Top

Single-cell gene regulatory network inference analysis

check buttonFind out the significant the regulons (TFs) and the target genes of each regulon across cell types for different disease states
TFCell TypeTissueDisease StageTarget GeneRSSRegulon Activity
∗The dot plots of a searched regulon are shown for all cell subpopulations in each disease state of each tissue based on the regulon specific score inferred using pySCENIC and by calculating the average expression.
Page: 1 

Top

Somatic mutation of malignant transformation related genes

check buttonAnnotation of somatic variants for genes involved in malignant transformation
Hugo SymbolVariant ClassVariant ClassificationdbSNP RSHGVScHGVSpHGVSp ShortSWISSPROTBIOTYPESIFTPolyPhenTumor Sample BarcodeTissueHistologySexAgeStageTherapy TypesDrugsOutcome
NUMA1SNVMissense_Mutationnovelc.3952C>Gp.Gln1318Glup.Q1318EQ14980protein_codingtolerated(0.21)possibly_damaging(0.875)TCGA-A2-A0D2-01Breastbreast invasive carcinomaFemale<65I/IIChemotherapyadriamycinSD
NUMA1SNVMissense_Mutationnovelc.3160N>Tp.His1054Tyrp.H1054YQ14980protein_codingdeleterious(0.01)benign(0.244)TCGA-A8-A08H-01Breastbreast invasive carcinomaFemale>=65I/IIUnknownUnknownSD
NUMA1SNVMissense_Mutationrs371974605c.1784C>Tp.Ser595Phep.S595FQ14980protein_codingtolerated(0.09)benign(0.003)TCGA-AC-A23H-01Breastbreast invasive carcinomaFemale>=65I/IIUnknownUnknownPD
NUMA1SNVMissense_Mutationc.1474C>Tp.His492Tyrp.H492YQ14980protein_codingdeleterious(0)benign(0.058)TCGA-AC-A23H-01Breastbreast invasive carcinomaFemale>=65I/IIUnknownUnknownPD
NUMA1SNVMissense_Mutationrs768661581c.1832N>Gp.Lys611Argp.K611RQ14980protein_codingtolerated(0.34)benign(0.254)TCGA-AC-A2BK-01Breastbreast invasive carcinomaFemale>=65III/IVChemotherapycytoxanCR
NUMA1SNVMissense_Mutationrs780069834c.5996G>Ap.Gly1999Glup.G1999EQ14980protein_codingtolerated(0.21)benign(0.328)TCGA-AC-A3W6-01Breastbreast invasive carcinomaFemale>=65III/IVUnknownUnknownSD
NUMA1SNVMissense_Mutationnovelc.5995G>Ap.Gly1999Argp.G1999RQ14980protein_codingdeleterious(0.02)possibly_damaging(0.701)TCGA-AC-A3W6-01Breastbreast invasive carcinomaFemale>=65III/IVUnknownUnknownSD
NUMA1SNVMissense_Mutationrs1053601c.2617N>Ap.Glu873Lysp.E873KQ14980protein_codingtolerated(0.49)benign(0.019)TCGA-AN-A046-01Breastbreast invasive carcinomaFemale>=65I/IIUnknownUnknownSD
NUMA1SNVMissense_Mutationc.1665G>Cp.Gln555Hisp.Q555HQ14980protein_codingdeleterious(0)probably_damaging(0.994)TCGA-AN-A0AT-01Breastbreast invasive carcinomaFemale<65I/IIUnknownUnknownSD
NUMA1SNVMissense_Mutationrs141331520c.5501N>Tp.Ser1834Leup.S1834LQ14980protein_codingdeleterious(0)possibly_damaging(0.9)TCGA-AO-A0JA-01Breastbreast invasive carcinomaFemale<65III/IVHormone TherapyleuprolideSD
Page: 1 2 3 4 5 6 7 8 9 10 11 12 13 14 15 16 17 18 19 20 21 22 23 

Top

Related drugs of malignant transformation related genes

check buttonIdentification of chemicals and drugs interact with genes involved in malignant transfromation
(DGIdb 4.0)
Entrez IDSymbolCategoryInteraction TypesDrug Claim NameDrug NamePMIDs
4926NUMA1CLINICALLY ACTIONABLEcalcium channel blockers24192120
Page: 1