
|
|||||
|
 | |
| |
| |
| |
| |
| |
|
Gene: NUFIP1 |
Gene summary for NUFIP1 |
| Gene information | Species | Human | Gene symbol | NUFIP1 | Gene ID | 26747 |
| Gene name | nuclear FMR1 interacting protein 1 | |
| Gene Alias | NUFIP | |
| Cytomap | 13q14.12 | |
| Gene Type | protein-coding | GO ID | GO:0000491 | UniProtAcc | Q9UHK0 |
Top |
Malignant transformation analysis |
| Identification of the aberrant gene expression in precancerous and cancerous lesions by comparing the gene expression of stem-like cells in diseased tissues with normal stem cells |
| Entrez ID | Symbol | Replicates | Species | Organ | Tissue | Adj P-value | Log2FC | Malignancy |
| 26747 | NUFIP1 | LZE4T | Human | Esophagus | ESCC | 2.97e-05 | 1.35e-01 | 0.0811 |
| 26747 | NUFIP1 | LZE7T | Human | Esophagus | ESCC | 2.29e-02 | 2.54e-01 | 0.0667 |
| 26747 | NUFIP1 | LZE20T | Human | Esophagus | ESCC | 2.88e-02 | 1.10e-02 | 0.0662 |
| 26747 | NUFIP1 | LZE22T | Human | Esophagus | ESCC | 1.14e-02 | 1.83e-01 | 0.068 |
| 26747 | NUFIP1 | LZE24T | Human | Esophagus | ESCC | 6.90e-08 | 8.10e-02 | 0.0596 |
| 26747 | NUFIP1 | P2T-E | Human | Esophagus | ESCC | 3.33e-17 | 3.58e-01 | 0.1177 |
| 26747 | NUFIP1 | P4T-E | Human | Esophagus | ESCC | 4.03e-13 | 1.26e-01 | 0.1323 |
| 26747 | NUFIP1 | P5T-E | Human | Esophagus | ESCC | 3.82e-15 | 1.64e-01 | 0.1327 |
| 26747 | NUFIP1 | P8T-E | Human | Esophagus | ESCC | 2.05e-17 | 2.99e-01 | 0.0889 |
| 26747 | NUFIP1 | P9T-E | Human | Esophagus | ESCC | 4.65e-06 | 2.12e-01 | 0.1131 |
| 26747 | NUFIP1 | P10T-E | Human | Esophagus | ESCC | 3.71e-12 | 3.31e-01 | 0.116 |
| 26747 | NUFIP1 | P11T-E | Human | Esophagus | ESCC | 1.05e-10 | 2.11e-01 | 0.1426 |
| 26747 | NUFIP1 | P12T-E | Human | Esophagus | ESCC | 7.35e-09 | 6.14e-02 | 0.1122 |
| 26747 | NUFIP1 | P15T-E | Human | Esophagus | ESCC | 1.83e-15 | 2.24e-01 | 0.1149 |
| 26747 | NUFIP1 | P16T-E | Human | Esophagus | ESCC | 7.31e-18 | 3.78e-01 | 0.1153 |
| 26747 | NUFIP1 | P17T-E | Human | Esophagus | ESCC | 1.93e-03 | 2.03e-01 | 0.1278 |
| 26747 | NUFIP1 | P19T-E | Human | Esophagus | ESCC | 4.93e-02 | 1.20e-01 | 0.1662 |
| 26747 | NUFIP1 | P20T-E | Human | Esophagus | ESCC | 2.67e-15 | 2.50e-01 | 0.1124 |
| 26747 | NUFIP1 | P21T-E | Human | Esophagus | ESCC | 3.77e-14 | 2.57e-01 | 0.1617 |
| 26747 | NUFIP1 | P22T-E | Human | Esophagus | ESCC | 8.46e-13 | 1.25e-01 | 0.1236 |
| Page: 1 2 3 4 |
| Tissue | Expression Dynamics | Abbreviation |
| Esophagus |  | ESCC: Esophageal squamous cell carcinoma |
| HGIN: High-grade intraepithelial neoplasias | ||
| LGIN: Low-grade intraepithelial neoplasias | ||
| Liver | 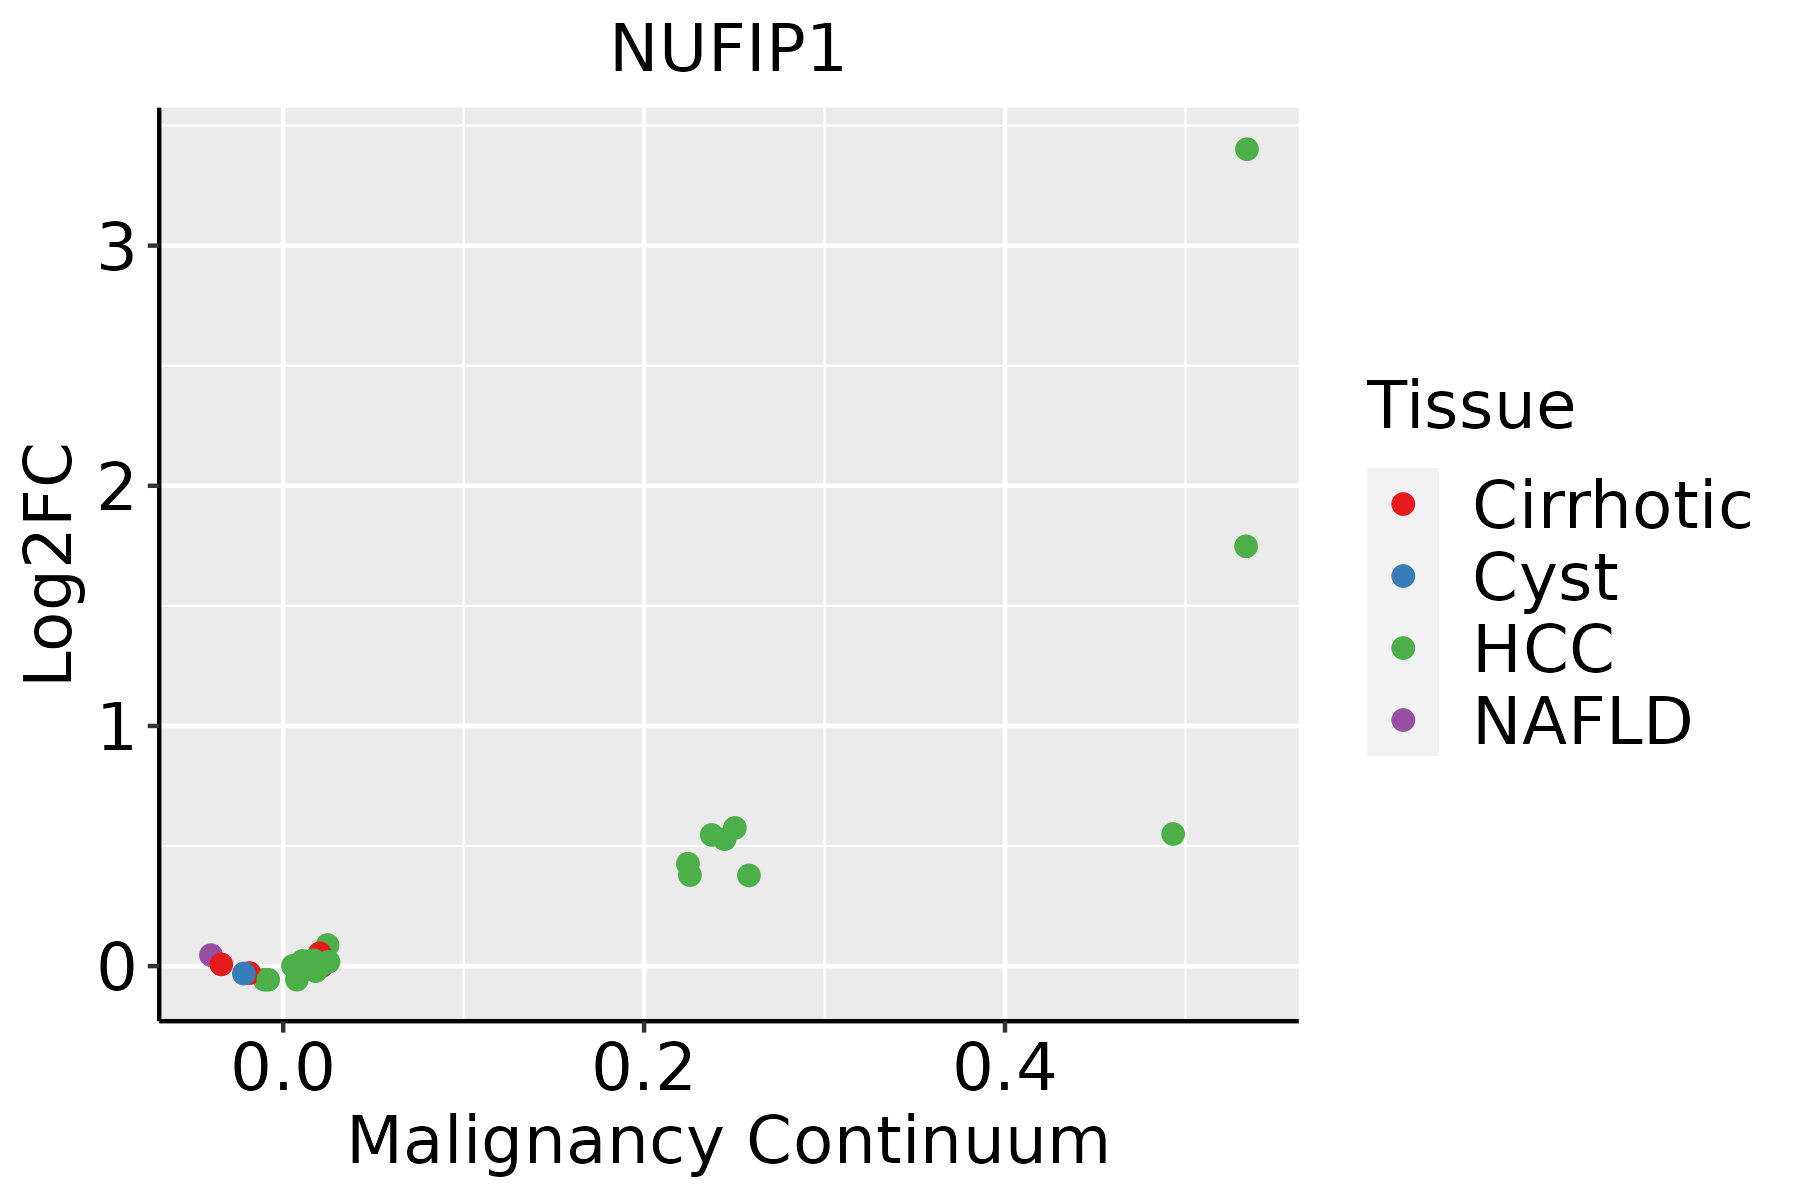 | HCC: Hepatocellular carcinoma |
| NAFLD: Non-alcoholic fatty liver disease | ||
| Oral Cavity |  | EOLP: Erosive Oral lichen planus |
| LP: leukoplakia | ||
| NEOLP: Non-erosive oral lichen planus | ||
| OSCC: Oral squamous cell carcinoma |
| ∗log2FC in expression of this searched gene in stem-like cells from each diseased tissue sample relative to stem-like cells in normal samples in each tissue plotted against the malignancy continuum. Samples are colored based on if they are from different disease stage. |
Top |
Malignant transformation related pathway analysis |
| Find out the enriched GO biological processes and KEGG pathways involved in transition from healthy to precancer to cancer |
| Tissue | Disease Stage | Enriched GO biological Processes |
| Colorectum | AD |  |
| Colorectum | SER |  |
| Colorectum | MSS |  |
| Colorectum | MSI-H |  |
| Colorectum | FAP |  |
| ∗Top 15 enriched GO BP terms are showed in the bar plot of each disease state in each tissue. Each row represents a significant GO biological process which is colored according to the -log10(p.adjust). |
| Page: 1 2 3 4 5 6 7 8 9 |
| GO ID | Tissue | Disease Stage | Description | Gene Ratio | Bg Ratio | pvalue | p.adjust | Count |
| GO:0022613111 | Esophagus | ESCC | ribonucleoprotein complex biogenesis | 365/8552 | 463/18723 | 1.74e-49 | 1.11e-45 | 365 |
| GO:0071826111 | Esophagus | ESCC | ribonucleoprotein complex subunit organization | 166/8552 | 227/18723 | 2.94e-17 | 2.42e-15 | 166 |
| GO:0022618111 | Esophagus | ESCC | ribonucleoprotein complex assembly | 159/8552 | 220/18723 | 8.19e-16 | 5.71e-14 | 159 |
| GO:002261322 | Liver | HCC | ribonucleoprotein complex biogenesis | 355/7958 | 463/18723 | 7.76e-52 | 4.92e-48 | 355 |
| GO:007182622 | Liver | HCC | ribonucleoprotein complex subunit organization | 159/7958 | 227/18723 | 3.14e-17 | 3.06e-15 | 159 |
| GO:002261822 | Liver | HCC | ribonucleoprotein complex assembly | 153/7958 | 220/18723 | 3.44e-16 | 2.91e-14 | 153 |
| GO:002261320 | Oral cavity | OSCC | ribonucleoprotein complex biogenesis | 333/7305 | 463/18723 | 8.28e-48 | 5.24e-44 | 333 |
| GO:007182620 | Oral cavity | OSCC | ribonucleoprotein complex subunit organization | 152/7305 | 227/18723 | 1.05e-17 | 1.01e-15 | 152 |
| GO:002261820 | Oral cavity | OSCC | ribonucleoprotein complex assembly | 146/7305 | 220/18723 | 1.53e-16 | 1.23e-14 | 146 |
| GO:0000492 | Oral cavity | OSCC | box C/D snoRNP assembly | 8/7305 | 10/18723 | 1.03e-02 | 3.53e-02 | 8 |
| GO:0022613110 | Oral cavity | LP | ribonucleoprotein complex biogenesis | 259/4623 | 463/18723 | 7.20e-48 | 2.25e-44 | 259 |
| GO:0071826110 | Oral cavity | LP | ribonucleoprotein complex subunit organization | 130/4623 | 227/18723 | 7.54e-26 | 3.63e-23 | 130 |
| GO:0022618110 | Oral cavity | LP | ribonucleoprotein complex assembly | 125/4623 | 220/18723 | 1.76e-24 | 6.91e-22 | 125 |
| GO:00004921 | Oral cavity | LP | box C/D snoRNP assembly | 7/4623 | 10/18723 | 3.24e-03 | 2.18e-02 | 7 |
| Page: 1 |
| Pathway ID | Tissue | Disease Stage | Description | Gene Ratio | Bg Ratio | pvalue | p.adjust | qvalue | Count |
| Page: 1 |
Top |
Cell-cell communication analysis |
| Identification of potential cell-cell interactions between two cell types and their ligand-receptor pairs for different disease states |
| Ligand | Receptor | LRpair | Pathway | Tissue | Disease Stage |
| Page: 1 |
Top |
Single-cell gene regulatory network inference analysis |
| Find out the significant the regulons (TFs) and the target genes of each regulon across cell types for different disease states |
| TF | Cell Type | Tissue | Disease Stage | Target Gene | RSS | Regulon Activity |
| ∗The dot plots of a searched regulon are shown for all cell subpopulations in each disease state of each tissue based on the regulon specific score inferred using pySCENIC and by calculating the average expression. |
| Page: 1 |
Top |
Somatic mutation of malignant transformation related genes |
| Annotation of somatic variants for genes involved in malignant transformation |
| Hugo Symbol | Variant Class | Variant Classification | dbSNP RS | HGVSc | HGVSp | HGVSp Short | SWISSPROT | BIOTYPE | SIFT | PolyPhen | Tumor Sample Barcode | Tissue | Histology | Sex | Age | Stage | Therapy Types | Drugs | Outcome |
| NUFIP1 | SNV | Missense_Mutation | novel | c.760N>C | p.Glu254Gln | p.E254Q | Q9UHK0 | protein_coding | deleterious(0.04) | probably_damaging(0.999) | TCGA-A2-A04W-01 | Breast | breast invasive carcinoma | Female | <65 | I/II | Chemotherapy | cytoxan | SD |
| NUFIP1 | SNV | Missense_Mutation | c.607N>C | p.Asp203His | p.D203H | Q9UHK0 | protein_coding | deleterious(0.04) | probably_damaging(0.956) | TCGA-AC-A2B8-01 | Breast | breast invasive carcinoma | Female | >=65 | I/II | Chemotherapy | chemo | PD | |
| NUFIP1 | SNV | Missense_Mutation | rs371806496 | c.1423N>T | p.Arg475Trp | p.R475W | Q9UHK0 | protein_coding | deleterious(0) | probably_damaging(0.998) | TCGA-AN-A046-01 | Breast | breast invasive carcinoma | Female | >=65 | I/II | Unknown | Unknown | SD |
| NUFIP1 | SNV | Missense_Mutation | c.675N>T | p.Met225Ile | p.M225I | Q9UHK0 | protein_coding | tolerated(0.26) | benign(0.123) | TCGA-BH-A0H5-01 | Breast | breast invasive carcinoma | Female | <65 | I/II | Chemotherapy | cytoxan | CR | |
| NUFIP1 | insertion | In_Frame_Ins | novel | c.478_479insTCAATTTCGCACCAG | p.Arg160delinsIleAsnPheAlaProGly | p.R160delinsINFAPG | Q9UHK0 | protein_coding | TCGA-AN-A0FN-01 | Breast | breast invasive carcinoma | Female | <65 | I/II | Unknown | Unknown | SD | ||
| NUFIP1 | deletion | Frame_Shift_Del | rs770344882 | c.494delN | p.Lys165ArgfsTer38 | p.K165Rfs*38 | Q9UHK0 | protein_coding | TCGA-EW-A1IZ-01 | Breast | breast invasive carcinoma | Female | <65 | III/IV | Chemotherapy | taxotere | SD | ||
| NUFIP1 | SNV | Missense_Mutation | c.1257N>C | p.Lys419Asn | p.K419N | Q9UHK0 | protein_coding | deleterious(0.05) | benign(0.298) | TCGA-DS-A0VN-01 | Cervix | cervical & endocervical cancer | Female | <65 | I/II | Chemotherapy | cisplatin | SD | |
| NUFIP1 | SNV | Missense_Mutation | c.1238N>T | p.Arg413Ile | p.R413I | Q9UHK0 | protein_coding | tolerated(0.11) | benign(0.246) | TCGA-AA-3510-01 | Colorectum | colon adenocarcinoma | Male | >=65 | I/II | Unknown | Unknown | SD | |
| NUFIP1 | SNV | Missense_Mutation | c.1409T>G | p.Ile470Ser | p.I470S | Q9UHK0 | protein_coding | deleterious(0) | probably_damaging(0.963) | TCGA-AA-A010-01 | Colorectum | colon adenocarcinoma | Female | <65 | I/II | Chemotherapy | folinic | CR | |
| NUFIP1 | SNV | Missense_Mutation | rs371806496 | c.1423N>T | p.Arg475Trp | p.R475W | Q9UHK0 | protein_coding | deleterious(0) | probably_damaging(0.998) | TCGA-AA-A022-01 | Colorectum | colon adenocarcinoma | Female | >=65 | I/II | Unknown | Unknown | SD |
| Page: 1 2 3 4 5 6 7 |
Top |
Related drugs of malignant transformation related genes |
| Identification of chemicals and drugs interact with genes involved in malignant transfromation |
| (DGIdb 4.0) |
| Entrez ID | Symbol | Category | Interaction Types | Drug Claim Name | Drug Name | PMIDs |
| Page: 1 |

Copyright 2023-Present -The University of Texas Health Science Center at Houston |