
|
|||||
|
 | |
| |
| |
| |
| |
| |
|
Gene: NUF2 |
Gene summary for NUF2 |
| Gene information | Species | Human | Gene symbol | NUF2 | Gene ID | 83540 |
| Gene name | NUF2 component of NDC80 kinetochore complex | |
| Gene Alias | CDCA1 | |
| Cytomap | 1q23.3 | |
| Gene Type | protein-coding | GO ID | GO:0000003 | UniProtAcc | Q9BZD4 |
Top |
Malignant transformation analysis |
| Identification of the aberrant gene expression in precancerous and cancerous lesions by comparing the gene expression of stem-like cells in diseased tissues with normal stem cells |
| Entrez ID | Symbol | Replicates | Species | Organ | Tissue | Adj P-value | Log2FC | Malignancy |
| 83540 | NUF2 | LZE2T | Human | Esophagus | ESCC | 9.54e-06 | 1.19e+00 | 0.082 |
| 83540 | NUF2 | LZE22T | Human | Esophagus | ESCC | 1.57e-02 | 3.08e-01 | 0.068 |
| 83540 | NUF2 | P2T-E | Human | Esophagus | ESCC | 4.40e-09 | 4.71e-01 | 0.1177 |
| 83540 | NUF2 | P4T-E | Human | Esophagus | ESCC | 4.13e-17 | 7.23e-01 | 0.1323 |
| 83540 | NUF2 | P5T-E | Human | Esophagus | ESCC | 2.13e-27 | 6.45e-01 | 0.1327 |
| 83540 | NUF2 | P9T-E | Human | Esophagus | ESCC | 1.08e-07 | 3.38e-01 | 0.1131 |
| 83540 | NUF2 | P10T-E | Human | Esophagus | ESCC | 4.44e-08 | 2.93e-01 | 0.116 |
| 83540 | NUF2 | P15T-E | Human | Esophagus | ESCC | 8.45e-06 | 2.58e-01 | 0.1149 |
| 83540 | NUF2 | P16T-E | Human | Esophagus | ESCC | 1.78e-03 | 1.55e-01 | 0.1153 |
| 83540 | NUF2 | P19T-E | Human | Esophagus | ESCC | 6.53e-04 | 3.14e-01 | 0.1662 |
| 83540 | NUF2 | P20T-E | Human | Esophagus | ESCC | 3.97e-02 | 2.62e-01 | 0.1124 |
| 83540 | NUF2 | P21T-E | Human | Esophagus | ESCC | 3.28e-14 | 6.76e-01 | 0.1617 |
| 83540 | NUF2 | P23T-E | Human | Esophagus | ESCC | 2.89e-02 | 1.93e-01 | 0.108 |
| 83540 | NUF2 | P24T-E | Human | Esophagus | ESCC | 9.02e-11 | 4.20e-01 | 0.1287 |
| 83540 | NUF2 | P28T-E | Human | Esophagus | ESCC | 4.44e-08 | 2.09e-01 | 0.1149 |
| 83540 | NUF2 | P31T-E | Human | Esophagus | ESCC | 4.31e-06 | 3.22e-01 | 0.1251 |
| 83540 | NUF2 | P32T-E | Human | Esophagus | ESCC | 2.56e-16 | 4.77e-01 | 0.1666 |
| 83540 | NUF2 | P36T-E | Human | Esophagus | ESCC | 2.98e-06 | 4.23e-01 | 0.1187 |
| 83540 | NUF2 | P37T-E | Human | Esophagus | ESCC | 1.09e-08 | 3.82e-01 | 0.1371 |
| 83540 | NUF2 | P38T-E | Human | Esophagus | ESCC | 3.67e-05 | 2.20e-01 | 0.127 |
| Page: 1 2 3 |
| Tissue | Expression Dynamics | Abbreviation |
| Esophagus | 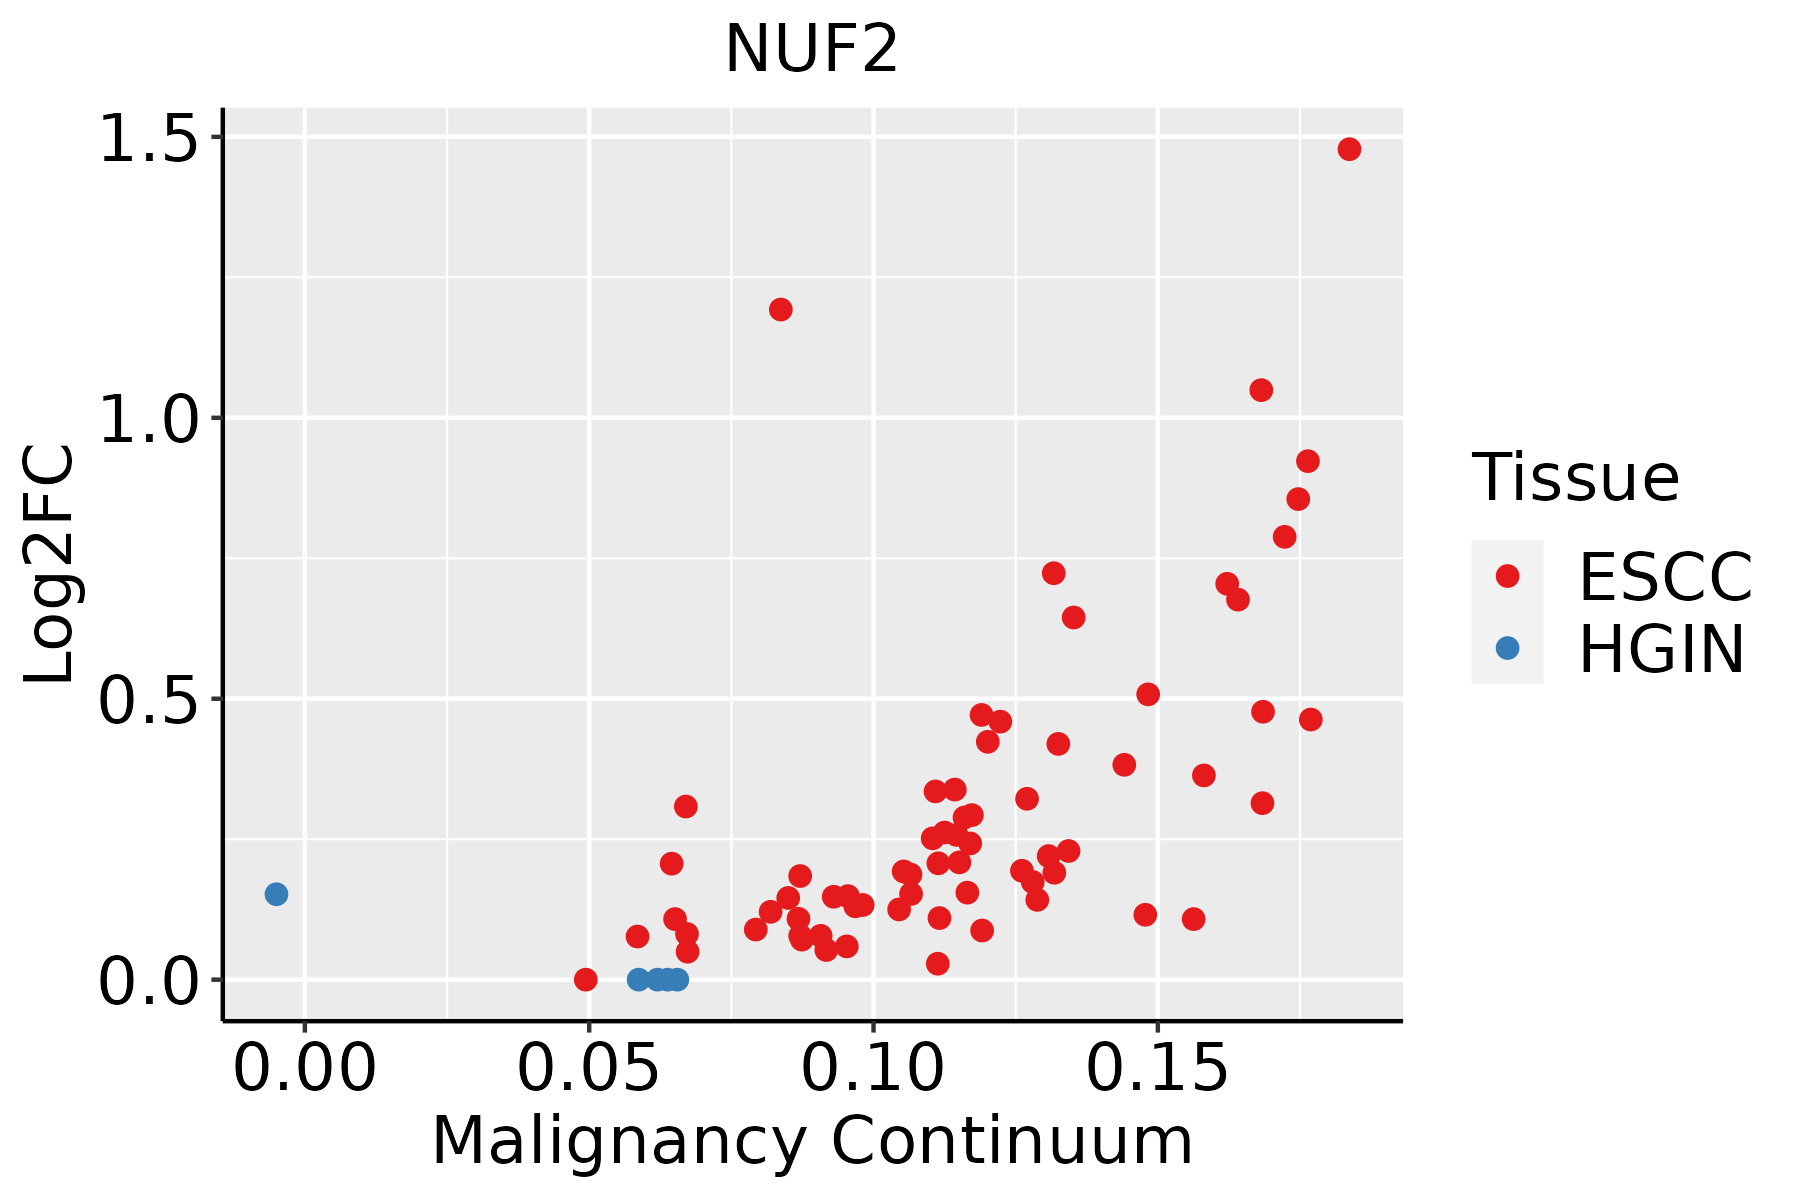 | ESCC: Esophageal squamous cell carcinoma |
| HGIN: High-grade intraepithelial neoplasias | ||
| LGIN: Low-grade intraepithelial neoplasias | ||
| Oral Cavity |  | EOLP: Erosive Oral lichen planus |
| LP: leukoplakia | ||
| NEOLP: Non-erosive oral lichen planus | ||
| OSCC: Oral squamous cell carcinoma | ||
| Skin | 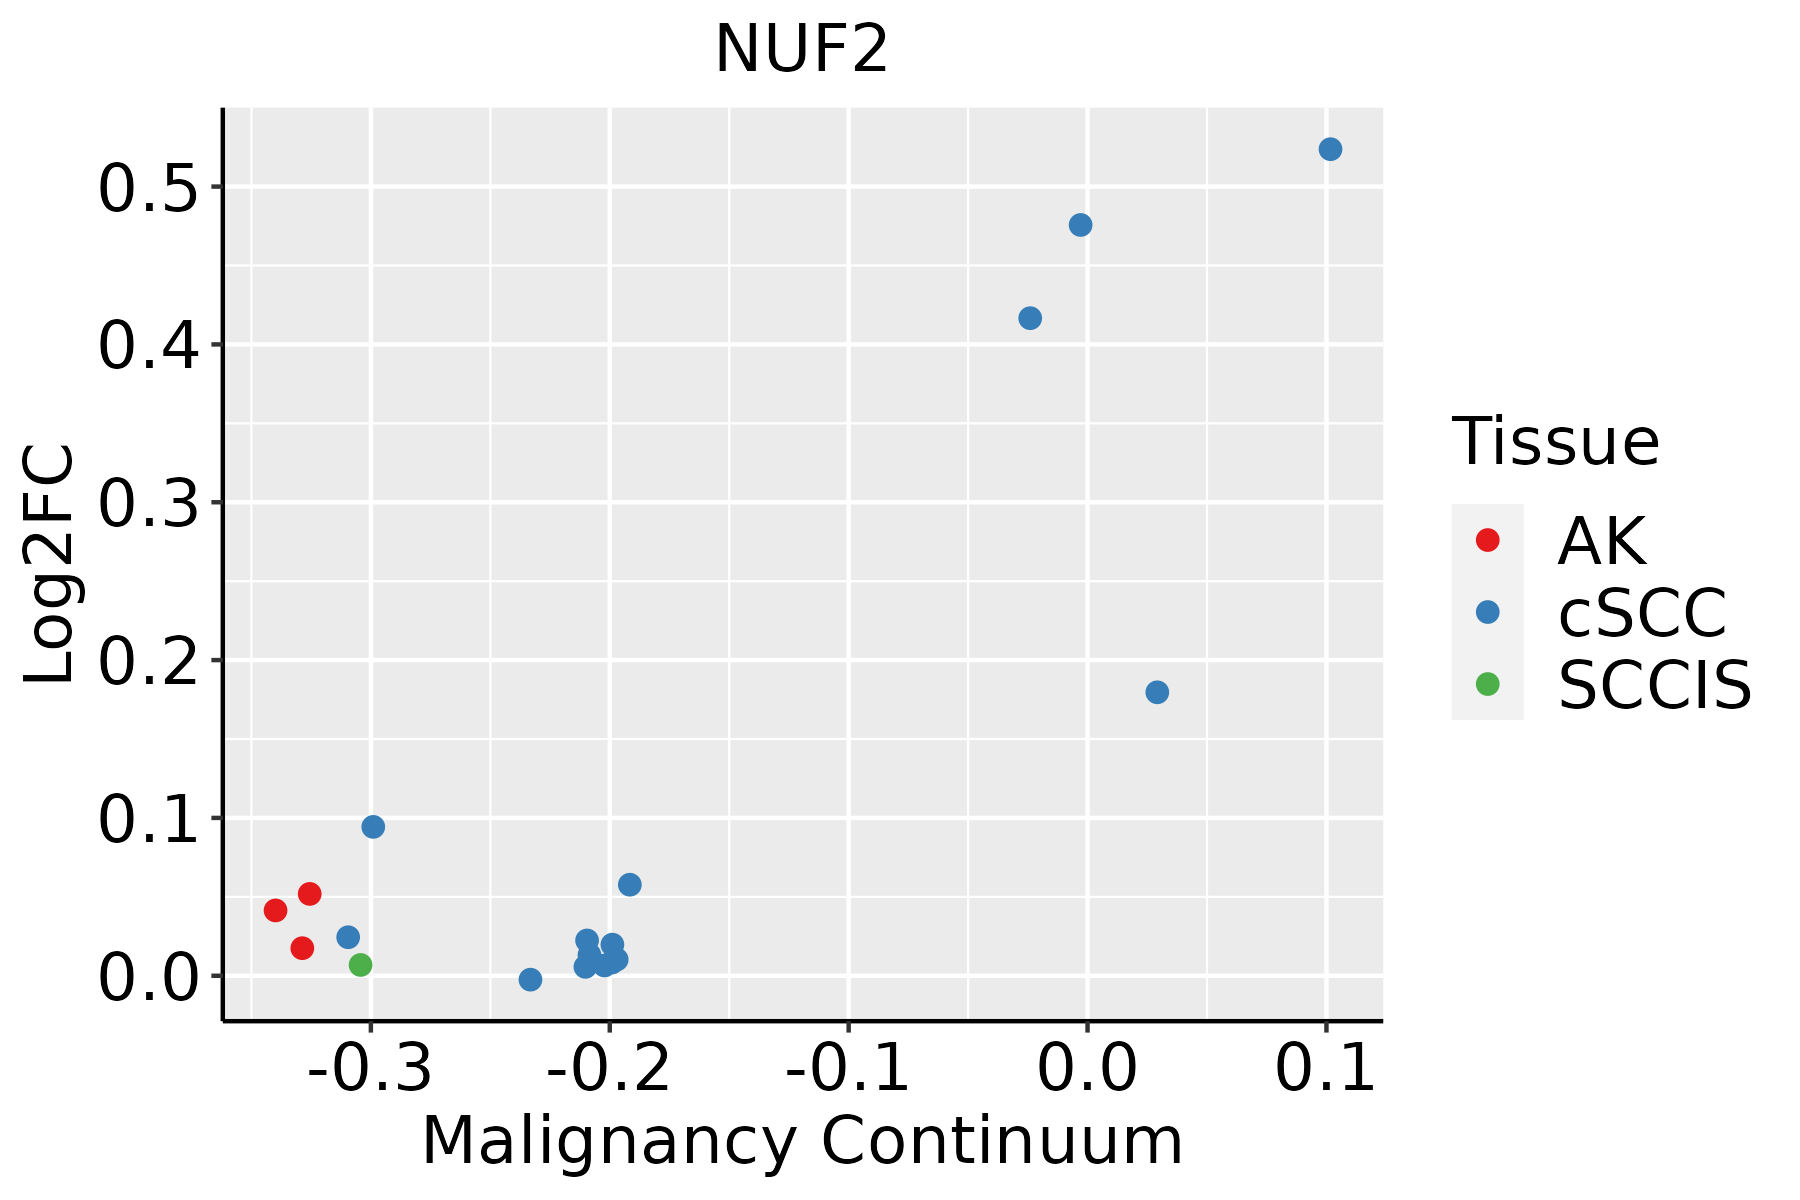 | AK: Actinic keratosis |
| cSCC: Cutaneous squamous cell carcinoma | ||
| SCCIS:squamous cell carcinoma in situ | ||
| Thyroid |  | ATC: Anaplastic thyroid cancer |
| HT: Hashimoto's thyroiditis | ||
| PTC: Papillary thyroid cancer |
| ∗log2FC in expression of this searched gene in stem-like cells from each diseased tissue sample relative to stem-like cells in normal samples in each tissue plotted against the malignancy continuum. Samples are colored based on if they are from different disease stage. |
Top |
Malignant transformation related pathway analysis |
| Find out the enriched GO biological processes and KEGG pathways involved in transition from healthy to precancer to cancer |
| Tissue | Disease Stage | Enriched GO biological Processes |
| Colorectum | AD |  |
| Colorectum | SER |  |
| Colorectum | MSS |  |
| Colorectum | MSI-H |  |
| Colorectum | FAP |  |
| ∗Top 15 enriched GO BP terms are showed in the bar plot of each disease state in each tissue. Each row represents a significant GO biological process which is colored according to the -log10(p.adjust). |
| Page: 1 2 3 4 5 6 7 8 9 |
| GO ID | Tissue | Disease Stage | Description | Gene Ratio | Bg Ratio | pvalue | p.adjust | Count |
| GO:014001414 | Esophagus | ESCC | mitotic nuclear division | 218/8552 | 287/18723 | 6.17e-26 | 1.78e-23 | 218 |
| GO:005165617 | Esophagus | ESCC | establishment of organelle localization | 273/8552 | 390/18723 | 9.13e-23 | 1.81e-20 | 273 |
| GO:000007011 | Esophagus | ESCC | mitotic sister chromatid segregation | 138/8552 | 168/18723 | 1.37e-22 | 2.63e-20 | 138 |
| GO:00008194 | Esophagus | ESCC | sister chromatid segregation | 157/8552 | 202/18723 | 8.41e-21 | 1.33e-18 | 157 |
| GO:000705911 | Esophagus | ESCC | chromosome segregation | 238/8552 | 346/18723 | 1.72e-18 | 1.82e-16 | 238 |
| GO:190285015 | Esophagus | ESCC | microtubule cytoskeleton organization involved in mitosis | 116/8552 | 147/18723 | 1.25e-16 | 9.91e-15 | 116 |
| GO:000705214 | Esophagus | ESCC | mitotic spindle organization | 97/8552 | 120/18723 | 2.17e-15 | 1.33e-13 | 97 |
| GO:000705114 | Esophagus | ESCC | spindle organization | 134/8552 | 184/18723 | 5.70e-14 | 2.87e-12 | 134 |
| GO:005131011 | Esophagus | ESCC | metaphase plate congression | 58/8552 | 65/18723 | 1.81e-13 | 8.63e-12 | 58 |
| GO:000708011 | Esophagus | ESCC | mitotic metaphase plate congression | 47/8552 | 50/18723 | 3.15e-13 | 1.47e-11 | 47 |
| GO:00482853 | Esophagus | ESCC | organelle fission | 301/8552 | 488/18723 | 4.64e-13 | 2.12e-11 | 301 |
| GO:00988133 | Esophagus | ESCC | nuclear chromosome segregation | 187/8552 | 281/18723 | 1.00e-12 | 4.36e-11 | 187 |
| GO:005130311 | Esophagus | ESCC | establishment of chromosome localization | 67/8552 | 80/18723 | 1.92e-12 | 8.09e-11 | 67 |
| GO:005000011 | Esophagus | ESCC | chromosome localization | 68/8552 | 82/18723 | 3.37e-12 | 1.32e-10 | 68 |
| GO:00002802 | Esophagus | ESCC | nuclear division | 270/8552 | 439/18723 | 1.17e-11 | 4.24e-10 | 270 |
| GO:00513831 | Esophagus | ESCC | kinetochore organization | 21/8552 | 23/18723 | 5.69e-06 | 5.90e-05 | 21 |
| GO:00086081 | Esophagus | ESCC | attachment of spindle microtubules to kinetochore | 29/8552 | 35/18723 | 6.61e-06 | 6.75e-05 | 29 |
| GO:00513151 | Esophagus | ESCC | attachment of mitotic spindle microtubules to kinetochore | 15/8552 | 15/18723 | 7.81e-06 | 7.69e-05 | 15 |
| GO:01400145 | Oral cavity | OSCC | mitotic nuclear division | 191/7305 | 287/18723 | 1.99e-21 | 3.70e-19 | 191 |
| GO:005165610 | Oral cavity | OSCC | establishment of organelle localization | 239/7305 | 390/18723 | 2.46e-19 | 3.31e-17 | 239 |
| Page: 1 2 3 4 |
| Pathway ID | Tissue | Disease Stage | Description | Gene Ratio | Bg Ratio | pvalue | p.adjust | qvalue | Count |
| Page: 1 |
Top |
Cell-cell communication analysis |
| Identification of potential cell-cell interactions between two cell types and their ligand-receptor pairs for different disease states |
| Ligand | Receptor | LRpair | Pathway | Tissue | Disease Stage |
| Page: 1 |
Top |
Single-cell gene regulatory network inference analysis |
| Find out the significant the regulons (TFs) and the target genes of each regulon across cell types for different disease states |
| TF | Cell Type | Tissue | Disease Stage | Target Gene | RSS | Regulon Activity |
| ∗The dot plots of a searched regulon are shown for all cell subpopulations in each disease state of each tissue based on the regulon specific score inferred using pySCENIC and by calculating the average expression. |
| Page: 1 |
Top |
Somatic mutation of malignant transformation related genes |
| Annotation of somatic variants for genes involved in malignant transformation |
| Hugo Symbol | Variant Class | Variant Classification | dbSNP RS | HGVSc | HGVSp | HGVSp Short | SWISSPROT | BIOTYPE | SIFT | PolyPhen | Tumor Sample Barcode | Tissue | Histology | Sex | Age | Stage | Therapy Types | Drugs | Outcome |
| NUF2 | SNV | Missense_Mutation | c.1186N>G | p.Gln396Glu | p.Q396E | Q9BZD4 | protein_coding | tolerated(0.19) | benign(0.157) | TCGA-AN-A0XU-01 | Breast | breast invasive carcinoma | Female | <65 | I/II | Unknown | Unknown | SD | |
| NUF2 | SNV | Missense_Mutation | c.1241N>A | p.Arg414Lys | p.R414K | Q9BZD4 | protein_coding | tolerated(1) | benign(0.01) | TCGA-BH-A0HP-01 | Breast | breast invasive carcinoma | Female | >=65 | III/IV | Chemotherapy | doxorubicin | SD | |
| NUF2 | SNV | Missense_Mutation | novel | c.553N>A | p.Asp185Asn | p.D185N | Q9BZD4 | protein_coding | tolerated(0.14) | benign(0.15) | TCGA-VS-A94Z-01 | Cervix | cervical & endocervical cancer | Female | <65 | I/II | Chemotherapy | cisplatin | CR |
| NUF2 | SNV | Missense_Mutation | c.609N>G | p.Ile203Met | p.I203M | Q9BZD4 | protein_coding | deleterious(0.02) | benign(0.001) | TCGA-A6-6140-01 | Colorectum | colon adenocarcinoma | Male | <65 | I/II | Chemotherapy | oxaliplatin | SD | |
| NUF2 | SNV | Missense_Mutation | rs775293541 | c.1112N>A | p.Arg371His | p.R371H | Q9BZD4 | protein_coding | tolerated(0.2) | benign(0.046) | TCGA-AA-3821-01 | Colorectum | colon adenocarcinoma | Female | >=65 | I/II | Unknown | Unknown | SD |
| NUF2 | SNV | Missense_Mutation | novel | c.1125G>T | p.Glu375Asp | p.E375D | Q9BZD4 | protein_coding | tolerated(0.17) | probably_damaging(0.987) | TCGA-AA-3864-01 | Colorectum | colon adenocarcinoma | Male | >=65 | I/II | Unknown | Unknown | SD |
| NUF2 | SNV | Missense_Mutation | rs747173543 | c.1019C>T | p.Ser340Leu | p.S340L | Q9BZD4 | protein_coding | deleterious(0.01) | possibly_damaging(0.565) | TCGA-AA-3977-01 | Colorectum | colon adenocarcinoma | Male | >=65 | I/II | Unknown | Unknown | SD |
| NUF2 | SNV | Missense_Mutation | rs536480913 | c.664C>T | p.Arg222Cys | p.R222C | Q9BZD4 | protein_coding | deleterious(0.01) | benign(0.226) | TCGA-AA-A00N-01 | Colorectum | colon adenocarcinoma | Male | >=65 | I/II | Unknown | Unknown | PD |
| NUF2 | SNV | Missense_Mutation | c.761A>G | p.Tyr254Cys | p.Y254C | Q9BZD4 | protein_coding | tolerated(0.18) | possibly_damaging(0.72) | TCGA-AA-A00N-01 | Colorectum | colon adenocarcinoma | Male | >=65 | I/II | Unknown | Unknown | PD | |
| NUF2 | SNV | Missense_Mutation | rs747173543 | c.1019N>T | p.Ser340Leu | p.S340L | Q9BZD4 | protein_coding | deleterious(0.01) | possibly_damaging(0.565) | TCGA-AA-A010-01 | Colorectum | colon adenocarcinoma | Female | <65 | I/II | Chemotherapy | folinic | CR |
| Page: 1 2 3 4 5 6 7 8 |
Top |
Related drugs of malignant transformation related genes |
| Identification of chemicals and drugs interact with genes involved in malignant transfromation |
| (DGIdb 4.0) |
| Entrez ID | Symbol | Category | Interaction Types | Drug Claim Name | Drug Name | PMIDs |
| Page: 1 |

Copyright 2023-Present -The University of Texas Health Science Center at Houston |