
|
|||||
|
 | |
| |
| |
| |
| |
| |
|
Gene: NUDT9 |
Gene summary for NUDT9 |
| Gene information | Species | Human | Gene symbol | NUDT9 | Gene ID | 53343 |
| Gene name | nudix hydrolase 9 | |
| Gene Alias | NUDT10 | |
| Cytomap | 4q22.1 | |
| Gene Type | protein-coding | GO ID | GO:0006139 | UniProtAcc | Q96KB3 |
Top |
Malignant transformation analysis |
| Identification of the aberrant gene expression in precancerous and cancerous lesions by comparing the gene expression of stem-like cells in diseased tissues with normal stem cells |
| Entrez ID | Symbol | Replicates | Species | Organ | Tissue | Adj P-value | Log2FC | Malignancy |
| 53343 | NUDT9 | LZE4T | Human | Esophagus | ESCC | 4.52e-08 | 1.89e-01 | 0.0811 |
| 53343 | NUDT9 | LZE7T | Human | Esophagus | ESCC | 1.53e-02 | 2.12e-01 | 0.0667 |
| 53343 | NUDT9 | LZE20T | Human | Esophagus | ESCC | 9.91e-04 | 1.36e-01 | 0.0662 |
| 53343 | NUDT9 | LZE24T | Human | Esophagus | ESCC | 2.97e-10 | 2.20e-01 | 0.0596 |
| 53343 | NUDT9 | LZE6T | Human | Esophagus | ESCC | 5.00e-03 | 1.48e-01 | 0.0845 |
| 53343 | NUDT9 | P1T-E | Human | Esophagus | ESCC | 3.94e-04 | 2.24e-01 | 0.0875 |
| 53343 | NUDT9 | P2T-E | Human | Esophagus | ESCC | 2.94e-20 | 3.97e-01 | 0.1177 |
| 53343 | NUDT9 | P4T-E | Human | Esophagus | ESCC | 6.61e-24 | 6.01e-01 | 0.1323 |
| 53343 | NUDT9 | P5T-E | Human | Esophagus | ESCC | 3.86e-05 | 8.72e-02 | 0.1327 |
| 53343 | NUDT9 | P8T-E | Human | Esophagus | ESCC | 1.33e-15 | 2.93e-01 | 0.0889 |
| 53343 | NUDT9 | P9T-E | Human | Esophagus | ESCC | 1.27e-09 | 1.62e-01 | 0.1131 |
| 53343 | NUDT9 | P10T-E | Human | Esophagus | ESCC | 5.02e-14 | 2.83e-01 | 0.116 |
| 53343 | NUDT9 | P11T-E | Human | Esophagus | ESCC | 1.23e-15 | 6.55e-01 | 0.1426 |
| 53343 | NUDT9 | P12T-E | Human | Esophagus | ESCC | 4.50e-23 | 5.34e-01 | 0.1122 |
| 53343 | NUDT9 | P15T-E | Human | Esophagus | ESCC | 7.47e-23 | 5.70e-01 | 0.1149 |
| 53343 | NUDT9 | P16T-E | Human | Esophagus | ESCC | 5.04e-31 | 5.59e-01 | 0.1153 |
| 53343 | NUDT9 | P19T-E | Human | Esophagus | ESCC | 2.18e-04 | 3.62e-01 | 0.1662 |
| 53343 | NUDT9 | P20T-E | Human | Esophagus | ESCC | 3.77e-06 | 2.53e-01 | 0.1124 |
| 53343 | NUDT9 | P21T-E | Human | Esophagus | ESCC | 5.98e-18 | 2.25e-01 | 0.1617 |
| 53343 | NUDT9 | P22T-E | Human | Esophagus | ESCC | 5.34e-17 | 2.15e-01 | 0.1236 |
| Page: 1 2 3 4 5 6 |
| Tissue | Expression Dynamics | Abbreviation |
| Esophagus |  | ESCC: Esophageal squamous cell carcinoma |
| HGIN: High-grade intraepithelial neoplasias | ||
| LGIN: Low-grade intraepithelial neoplasias | ||
| Liver | 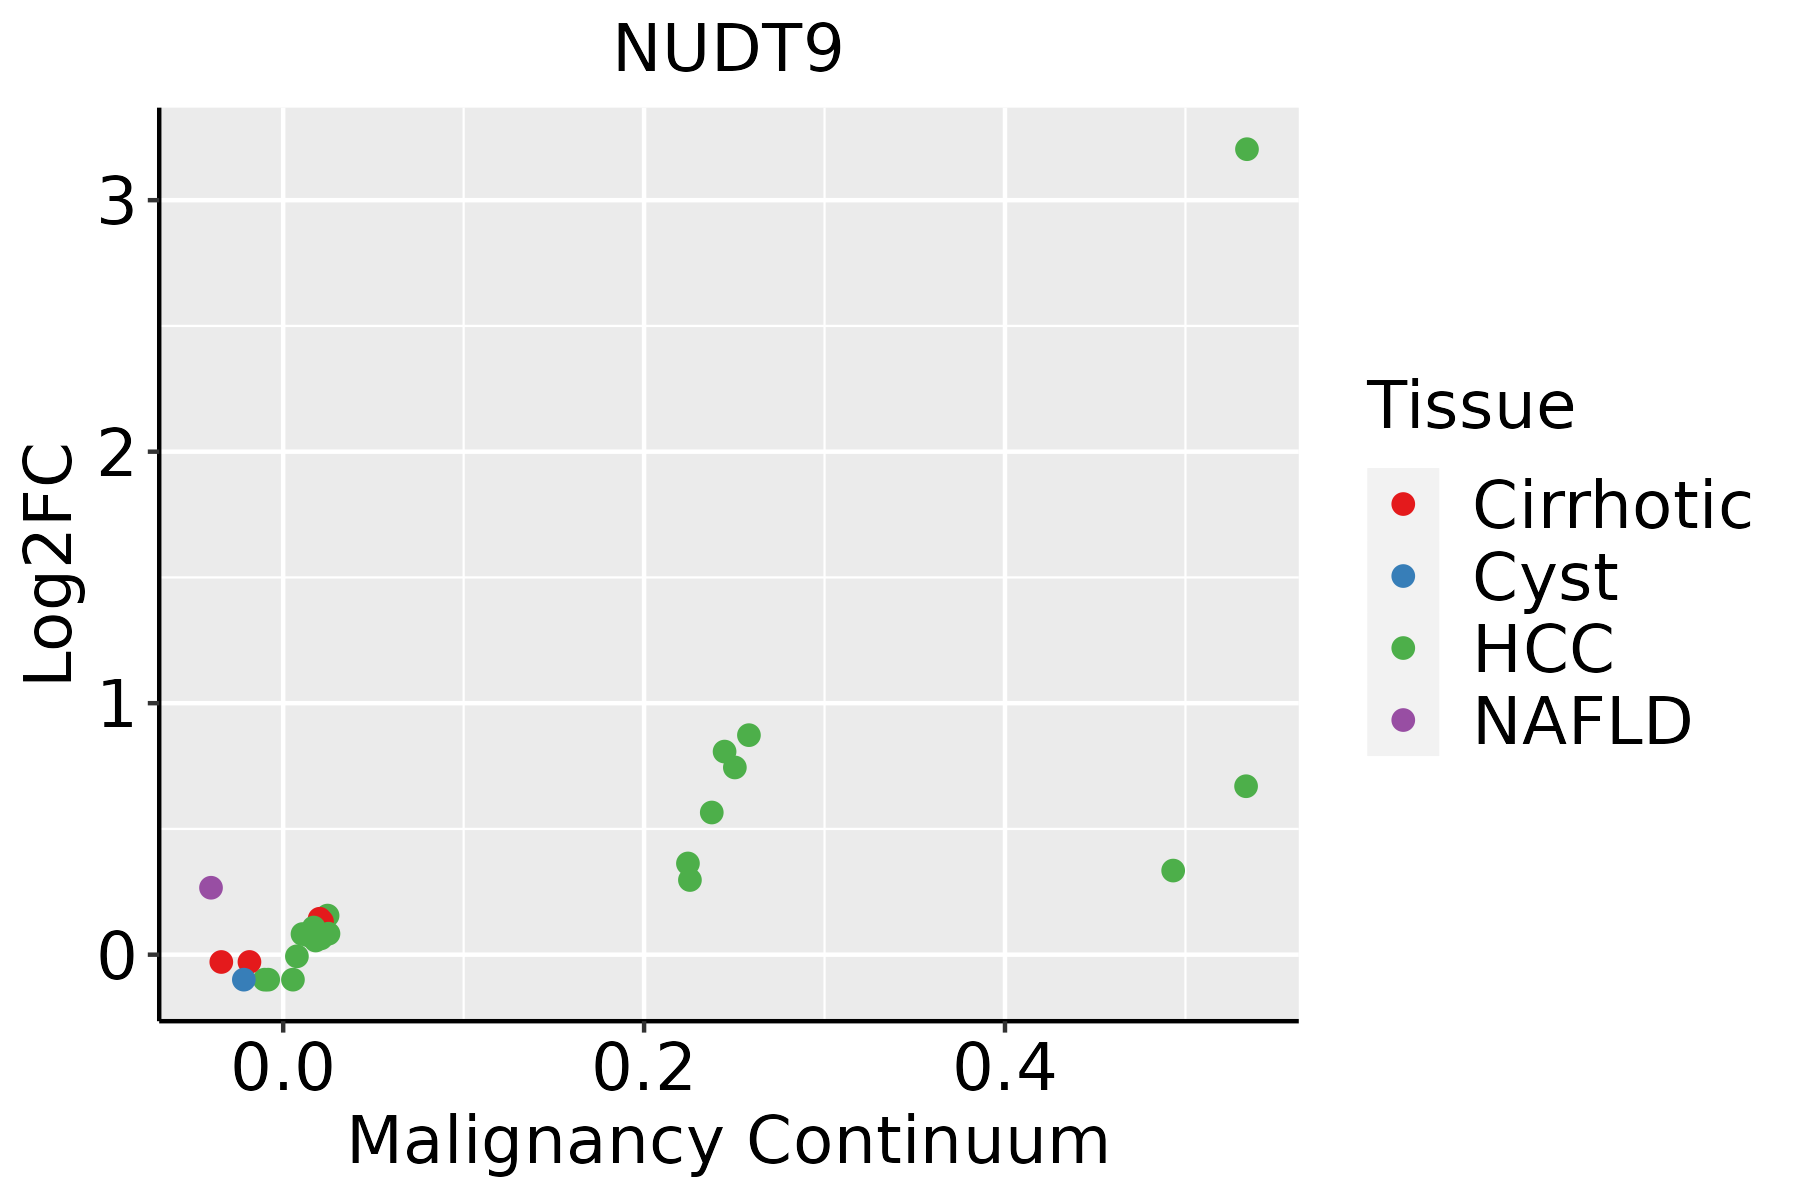 | HCC: Hepatocellular carcinoma |
| NAFLD: Non-alcoholic fatty liver disease | ||
| Oral Cavity | 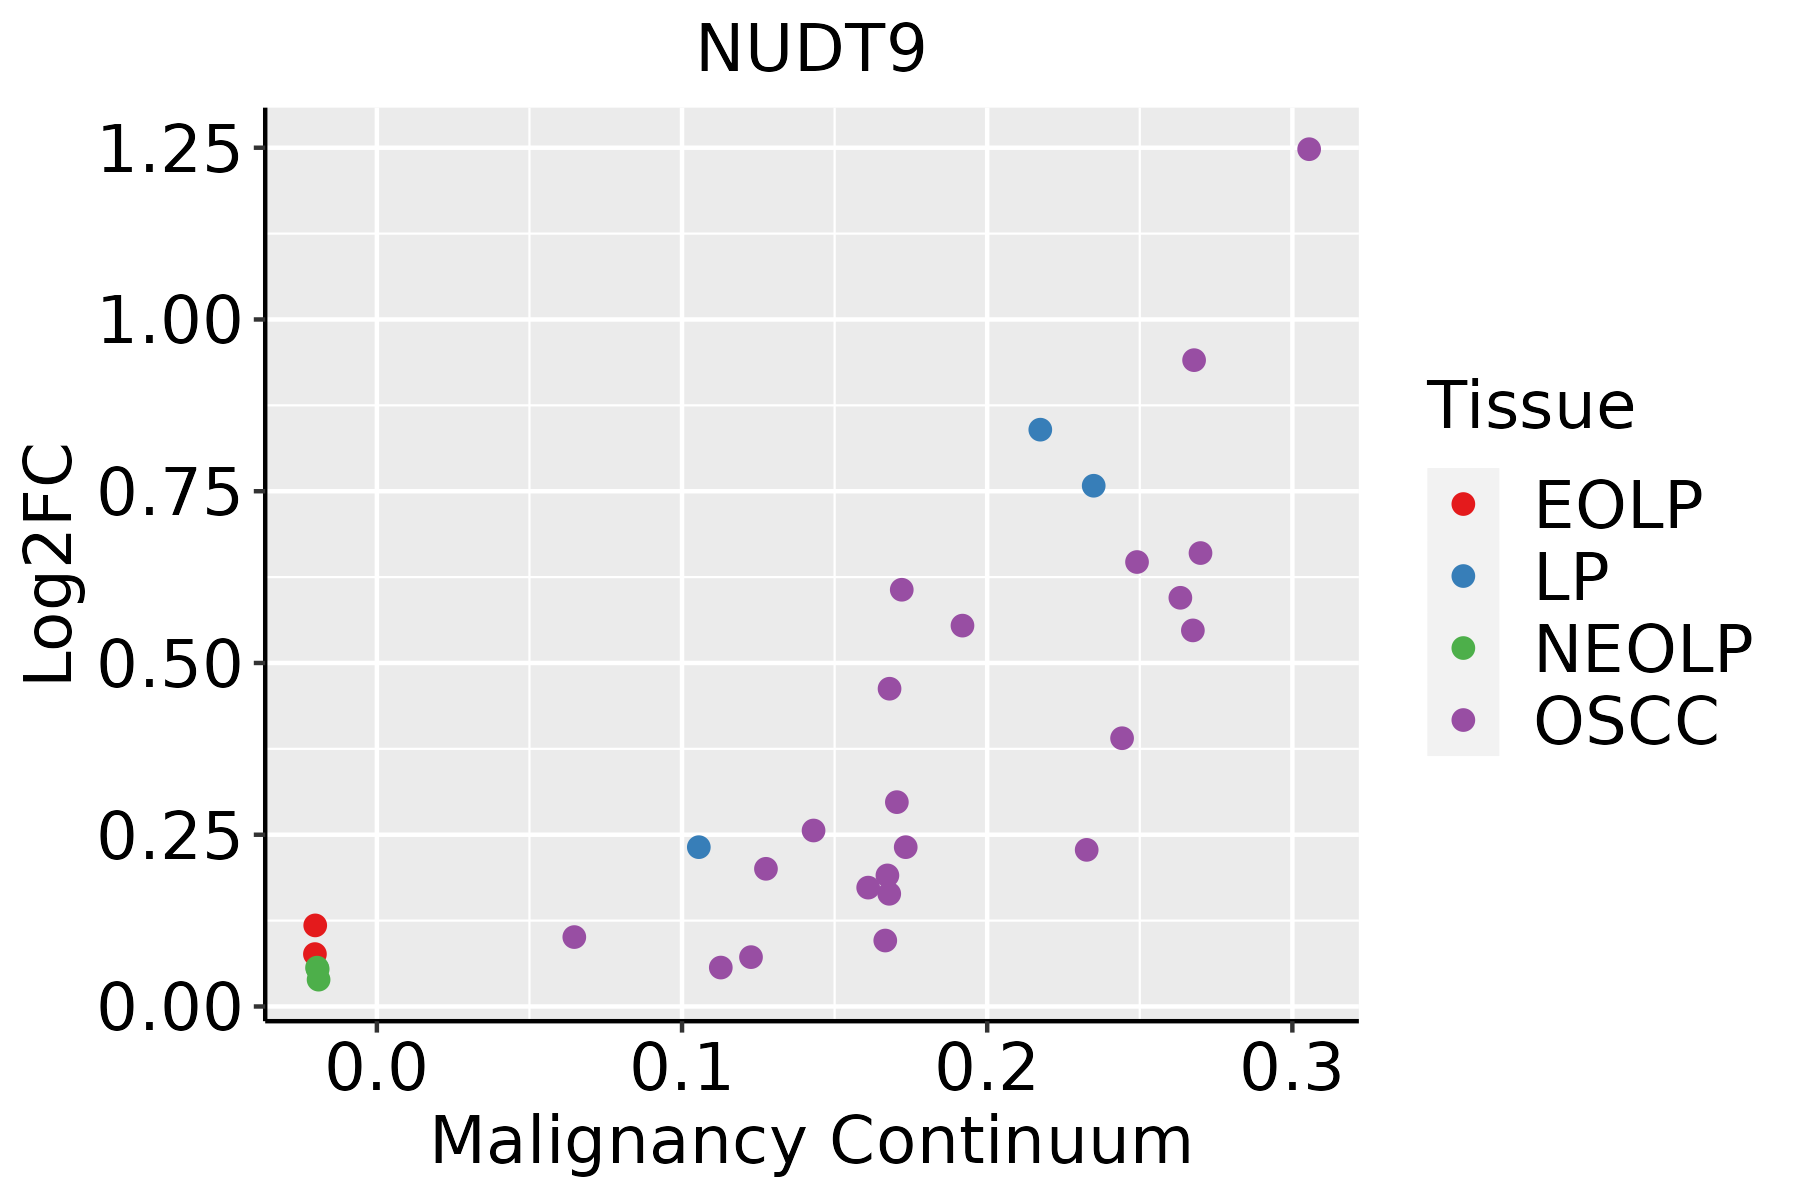 | EOLP: Erosive Oral lichen planus |
| LP: leukoplakia | ||
| NEOLP: Non-erosive oral lichen planus | ||
| OSCC: Oral squamous cell carcinoma | ||
| Skin | 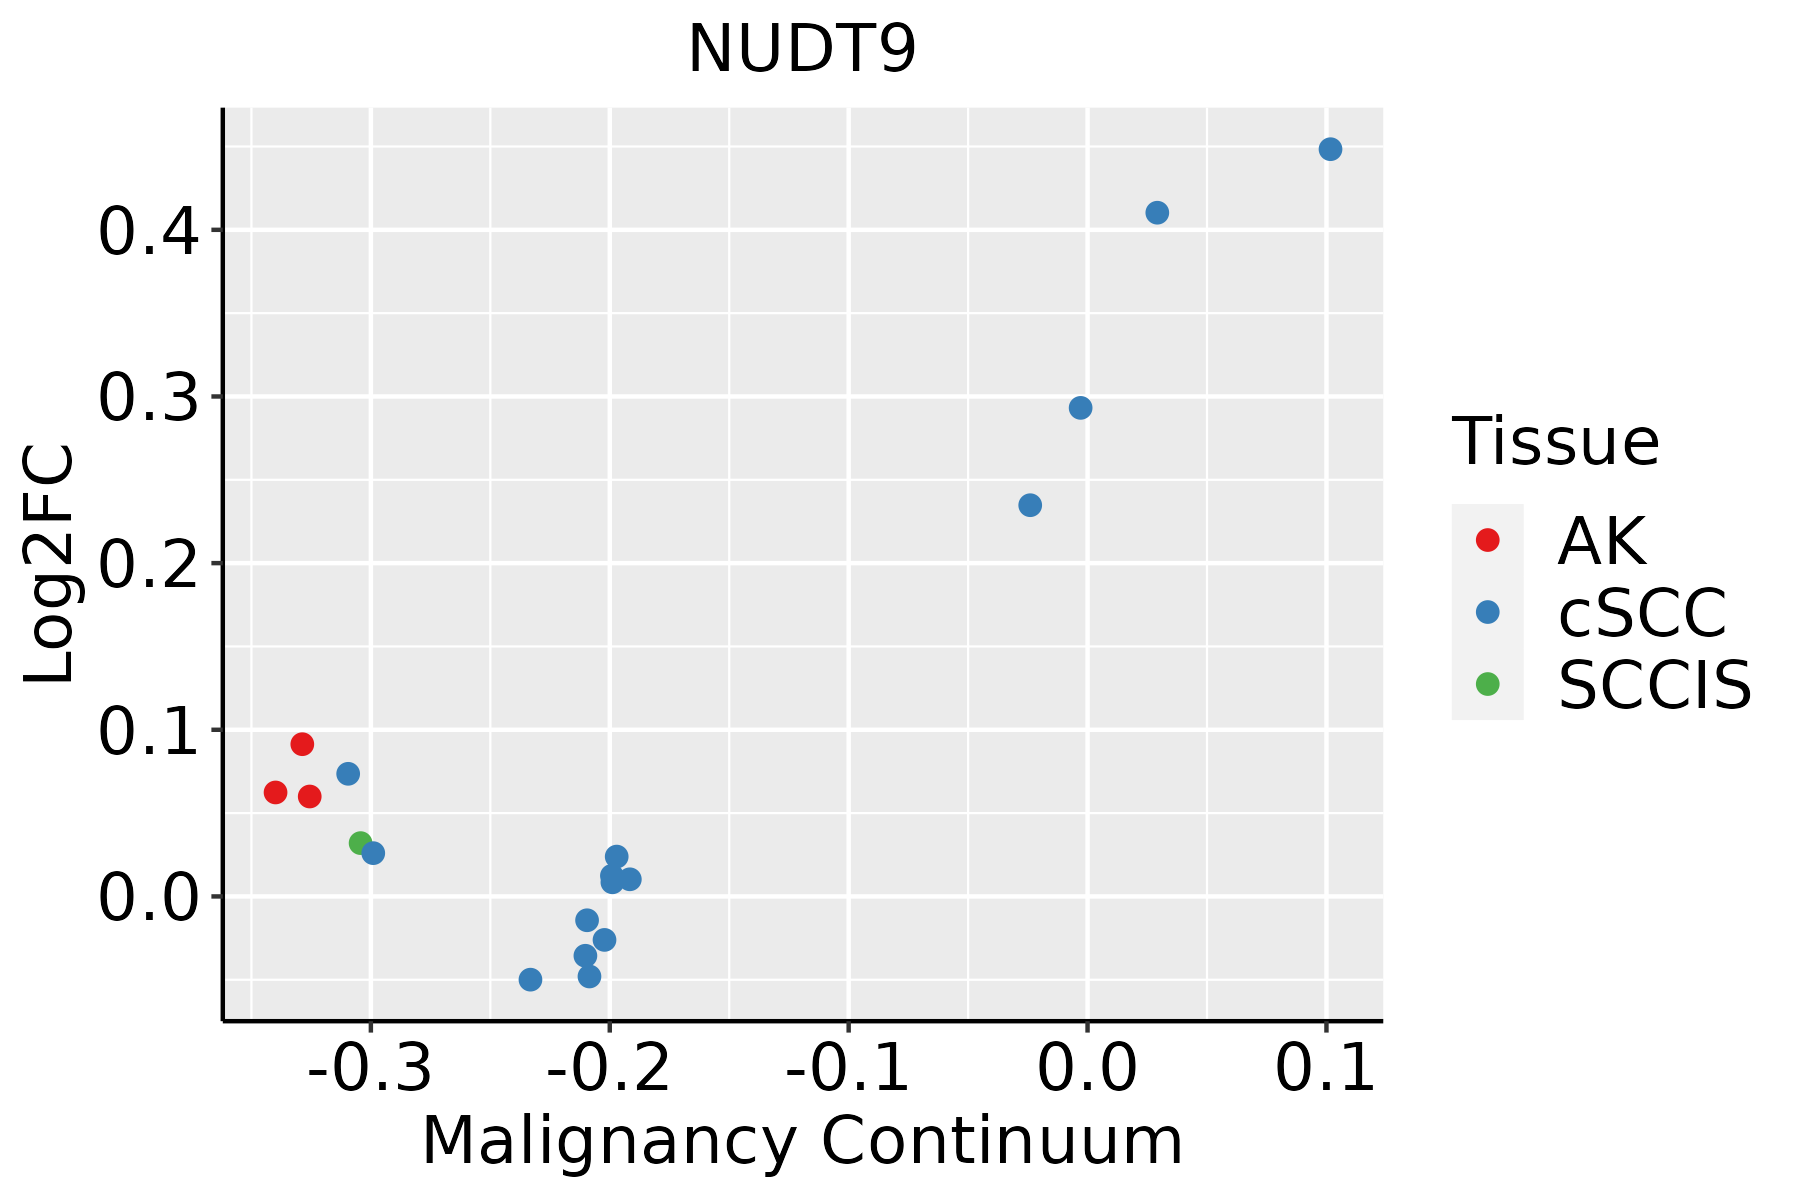 | AK: Actinic keratosis |
| cSCC: Cutaneous squamous cell carcinoma | ||
| SCCIS:squamous cell carcinoma in situ | ||
| Thyroid |  | ATC: Anaplastic thyroid cancer |
| HT: Hashimoto's thyroiditis | ||
| PTC: Papillary thyroid cancer |
| ∗log2FC in expression of this searched gene in stem-like cells from each diseased tissue sample relative to stem-like cells in normal samples in each tissue plotted against the malignancy continuum. Samples are colored based on if they are from different disease stage. |
Top |
Malignant transformation related pathway analysis |
| Find out the enriched GO biological processes and KEGG pathways involved in transition from healthy to precancer to cancer |
| Tissue | Disease Stage | Enriched GO biological Processes |
| Colorectum | AD |  |
| Colorectum | SER |  |
| Colorectum | MSS |  |
| Colorectum | MSI-H |  |
| Colorectum | FAP |  |
| ∗Top 15 enriched GO BP terms are showed in the bar plot of each disease state in each tissue. Each row represents a significant GO biological process which is colored according to the -log10(p.adjust). |
| Page: 1 2 3 4 5 6 7 8 9 |
| GO ID | Tissue | Disease Stage | Description | Gene Ratio | Bg Ratio | pvalue | p.adjust | Count |
| GO:0034655110 | Esophagus | ESCC | nucleobase-containing compound catabolic process | 272/8552 | 407/18723 | 2.92e-18 | 2.90e-16 | 272 |
| GO:004670018 | Esophagus | ESCC | heterocycle catabolic process | 286/8552 | 445/18723 | 1.12e-15 | 7.47e-14 | 286 |
| GO:004427019 | Esophagus | ESCC | cellular nitrogen compound catabolic process | 288/8552 | 451/18723 | 3.03e-15 | 1.79e-13 | 288 |
| GO:001943918 | Esophagus | ESCC | aromatic compound catabolic process | 295/8552 | 467/18723 | 1.09e-14 | 5.98e-13 | 295 |
| GO:190136118 | Esophagus | ESCC | organic cyclic compound catabolic process | 307/8552 | 495/18723 | 9.99e-14 | 4.80e-12 | 307 |
| GO:0006753110 | Esophagus | ESCC | nucleoside phosphate metabolic process | 288/8552 | 497/18723 | 1.80e-08 | 3.50e-07 | 288 |
| GO:0019693111 | Esophagus | ESCC | ribose phosphate metabolic process | 234/8552 | 396/18723 | 4.24e-08 | 7.76e-07 | 234 |
| GO:0009117111 | Esophagus | ESCC | nucleotide metabolic process | 282/8552 | 489/18723 | 4.70e-08 | 8.50e-07 | 282 |
| GO:0009259111 | Esophagus | ESCC | ribonucleotide metabolic process | 224/8552 | 385/18723 | 4.41e-07 | 6.00e-06 | 224 |
| GO:0072521111 | Esophagus | ESCC | purine-containing compound metabolic process | 238/8552 | 416/18723 | 1.20e-06 | 1.49e-05 | 238 |
| GO:0009150111 | Esophagus | ESCC | purine ribonucleotide metabolic process | 213/8552 | 368/18723 | 1.40e-06 | 1.69e-05 | 213 |
| GO:0006163111 | Esophagus | ESCC | purine nucleotide metabolic process | 226/8552 | 396/18723 | 2.81e-06 | 3.21e-05 | 226 |
| GO:000913219 | Esophagus | ESCC | nucleoside diphosphate metabolic process | 77/8552 | 124/18723 | 1.65e-04 | 1.09e-03 | 77 |
| GO:000918520 | Esophagus | ESCC | ribonucleoside diphosphate metabolic process | 66/8552 | 106/18723 | 4.21e-04 | 2.39e-03 | 66 |
| GO:000913520 | Esophagus | ESCC | purine nucleoside diphosphate metabolic process | 63/8552 | 103/18723 | 1.10e-03 | 5.52e-03 | 63 |
| GO:000917920 | Esophagus | ESCC | purine ribonucleoside diphosphate metabolic process | 63/8552 | 103/18723 | 1.10e-03 | 5.52e-03 | 63 |
| GO:19011362 | Esophagus | ESCC | carbohydrate derivative catabolic process | 99/8552 | 172/18723 | 1.11e-03 | 5.54e-03 | 99 |
| GO:004603119 | Esophagus | ESCC | ADP metabolic process | 55/8552 | 90/18723 | 2.27e-03 | 9.99e-03 | 55 |
| GO:190136111 | Liver | Cirrhotic | organic cyclic compound catabolic process | 213/4634 | 495/18723 | 1.58e-19 | 3.67e-17 | 213 |
| GO:001943911 | Liver | Cirrhotic | aromatic compound catabolic process | 202/4634 | 467/18723 | 6.93e-19 | 1.28e-16 | 202 |
| Page: 1 2 3 4 5 6 7 8 |
| Pathway ID | Tissue | Disease Stage | Description | Gene Ratio | Bg Ratio | pvalue | p.adjust | qvalue | Count |
| Page: 1 |
Top |
Cell-cell communication analysis |
| Identification of potential cell-cell interactions between two cell types and their ligand-receptor pairs for different disease states |
| Ligand | Receptor | LRpair | Pathway | Tissue | Disease Stage |
| Page: 1 |
Top |
Single-cell gene regulatory network inference analysis |
| Find out the significant the regulons (TFs) and the target genes of each regulon across cell types for different disease states |
| TF | Cell Type | Tissue | Disease Stage | Target Gene | RSS | Regulon Activity |
| ∗The dot plots of a searched regulon are shown for all cell subpopulations in each disease state of each tissue based on the regulon specific score inferred using pySCENIC and by calculating the average expression. |
| Page: 1 |
Top |
Somatic mutation of malignant transformation related genes |
| Annotation of somatic variants for genes involved in malignant transformation |
| Hugo Symbol | Variant Class | Variant Classification | dbSNP RS | HGVSc | HGVSp | HGVSp Short | SWISSPROT | BIOTYPE | SIFT | PolyPhen | Tumor Sample Barcode | Tissue | Histology | Sex | Age | Stage | Therapy Types | Drugs | Outcome |
| NUDT9 | SNV | Missense_Mutation | novel | c.588C>G | p.Ile196Met | p.I196M | Q9BW91 | protein_coding | tolerated(0.06) | probably_damaging(0.991) | TCGA-BH-A2L8-01 | Breast | breast invasive carcinoma | Female | <65 | I/II | Chemotherapy | cytoxan | CR |
| NUDT9 | SNV | Missense_Mutation | novel | c.155N>T | p.Ser52Phe | p.S52F | Q9BW91 | protein_coding | tolerated(0.46) | benign(0.014) | TCGA-C5-A1MN-01 | Cervix | cervical & endocervical cancer | Female | <65 | III/IV | Chemotherapy | cisplatin | SD |
| NUDT9 | SNV | Missense_Mutation | novel | c.725C>T | p.Thr242Ile | p.T242I | Q9BW91 | protein_coding | deleterious(0.01) | benign(0.196) | TCGA-VS-A9V5-01 | Cervix | cervical & endocervical cancer | Female | <65 | I/II | Chemotherapy | carboplatin | PD |
| NUDT9 | SNV | Missense_Mutation | novel | c.418N>C | p.Tyr140His | p.Y140H | Q9BW91 | protein_coding | deleterious(0) | probably_damaging(0.999) | TCGA-A6-2672-01 | Colorectum | colon adenocarcinoma | Female | >=65 | III/IV | Unknown | Unknown | SD |
| NUDT9 | SNV | Missense_Mutation | rs766600401 | c.868G>A | p.Glu290Lys | p.E290K | Q9BW91 | protein_coding | deleterious(0.02) | possibly_damaging(0.458) | TCGA-AA-3510-01 | Colorectum | colon adenocarcinoma | Male | >=65 | I/II | Unknown | Unknown | SD |
| NUDT9 | SNV | Missense_Mutation | rs752541554 | c.113C>T | p.Ser38Leu | p.S38L | Q9BW91 | protein_coding | tolerated(0.71) | benign(0) | TCGA-NH-A50T-01 | Colorectum | colon adenocarcinoma | Female | >=65 | I/II | Unknown | Unknown | SD |
| NUDT9 | SNV | Missense_Mutation | rs766600401 | c.868G>A | p.Glu290Lys | p.E290K | Q9BW91 | protein_coding | deleterious(0.02) | possibly_damaging(0.458) | TCGA-F5-6814-01 | Colorectum | rectum adenocarcinoma | Male | <65 | I/II | Unknown | Unknown | SD |
| NUDT9 | insertion | Nonsense_Mutation | novel | c.433_434insTAAAATAA | p.Gly145ValfsTer3 | p.G145Vfs*3 | Q9BW91 | protein_coding | TCGA-AM-5820-01 | Colorectum | colon adenocarcinoma | Female | <65 | I/II | Unknown | Unknown | SD | ||
| NUDT9 | insertion | In_Frame_Ins | novel | c.435_436insAAT | p.Gly145_Arg146insAsn | p.G145_R146insN | Q9BW91 | protein_coding | TCGA-AM-5820-01 | Colorectum | colon adenocarcinoma | Female | <65 | I/II | Unknown | Unknown | SD | ||
| NUDT9 | SNV | Missense_Mutation | novel | c.740G>A | p.Arg247Lys | p.R247K | Q9BW91 | protein_coding | tolerated(1) | benign(0) | TCGA-A5-A0G2-01 | Endometrium | uterine corpus endometrioid carcinoma | Female | <65 | III/IV | Unknown | Unknown | SD |
| Page: 1 2 |
Top |
Related drugs of malignant transformation related genes |
| Identification of chemicals and drugs interact with genes involved in malignant transfromation |
| (DGIdb 4.0) |
| Entrez ID | Symbol | Category | Interaction Types | Drug Claim Name | Drug Name | PMIDs |
| Page: 1 |

Copyright 2023-Present -The University of Texas Health Science Center at Houston |