
|
|||||
|
 | |
| |
| |
| |
| |
| |
|
Gene: NUDT7 |
Gene summary for NUDT7 |
| Gene information | Species | Human | Gene symbol | NUDT7 | Gene ID | 283927 |
| Gene name | nudix hydrolase 7 | |
| Gene Alias | NUDT7 | |
| Cytomap | 16q23.1 | |
| Gene Type | protein-coding | GO ID | GO:0006082 | UniProtAcc | P0C024 |
Top |
Malignant transformation analysis |
| Identification of the aberrant gene expression in precancerous and cancerous lesions by comparing the gene expression of stem-like cells in diseased tissues with normal stem cells |
| Entrez ID | Symbol | Replicates | Species | Organ | Tissue | Adj P-value | Log2FC | Malignancy |
| 283927 | NUDT7 | LZE4T | Human | Esophagus | ESCC | 1.80e-03 | 1.11e-01 | 0.0811 |
| 283927 | NUDT7 | LZE24T | Human | Esophagus | ESCC | 3.40e-05 | 9.41e-02 | 0.0596 |
| 283927 | NUDT7 | P2T-E | Human | Esophagus | ESCC | 1.19e-22 | 1.67e-01 | 0.1177 |
| 283927 | NUDT7 | P4T-E | Human | Esophagus | ESCC | 4.74e-06 | 1.35e-01 | 0.1323 |
| 283927 | NUDT7 | P5T-E | Human | Esophagus | ESCC | 2.81e-07 | 1.15e-01 | 0.1327 |
| 283927 | NUDT7 | P8T-E | Human | Esophagus | ESCC | 1.58e-10 | 7.84e-02 | 0.0889 |
| 283927 | NUDT7 | P9T-E | Human | Esophagus | ESCC | 1.51e-06 | 1.67e-01 | 0.1131 |
| 283927 | NUDT7 | P10T-E | Human | Esophagus | ESCC | 4.08e-08 | 1.53e-01 | 0.116 |
| 283927 | NUDT7 | P11T-E | Human | Esophagus | ESCC | 6.66e-05 | 1.36e-01 | 0.1426 |
| 283927 | NUDT7 | P12T-E | Human | Esophagus | ESCC | 8.14e-13 | 3.50e-01 | 0.1122 |
| 283927 | NUDT7 | P15T-E | Human | Esophagus | ESCC | 2.33e-05 | 1.73e-01 | 0.1149 |
| 283927 | NUDT7 | P16T-E | Human | Esophagus | ESCC | 1.73e-10 | 9.79e-02 | 0.1153 |
| 283927 | NUDT7 | P20T-E | Human | Esophagus | ESCC | 8.79e-12 | 1.73e-01 | 0.1124 |
| 283927 | NUDT7 | P21T-E | Human | Esophagus | ESCC | 1.29e-13 | 2.06e-01 | 0.1617 |
| 283927 | NUDT7 | P22T-E | Human | Esophagus | ESCC | 3.55e-19 | 2.72e-01 | 0.1236 |
| 283927 | NUDT7 | P23T-E | Human | Esophagus | ESCC | 1.46e-22 | 5.90e-01 | 0.108 |
| 283927 | NUDT7 | P24T-E | Human | Esophagus | ESCC | 1.00e-07 | 1.25e-01 | 0.1287 |
| 283927 | NUDT7 | P26T-E | Human | Esophagus | ESCC | 3.04e-18 | 3.35e-01 | 0.1276 |
| 283927 | NUDT7 | P27T-E | Human | Esophagus | ESCC | 3.02e-02 | 5.17e-02 | 0.1055 |
| 283927 | NUDT7 | P28T-E | Human | Esophagus | ESCC | 2.61e-14 | 1.45e-01 | 0.1149 |
| Page: 1 2 3 |
| Tissue | Expression Dynamics | Abbreviation |
| Esophagus | 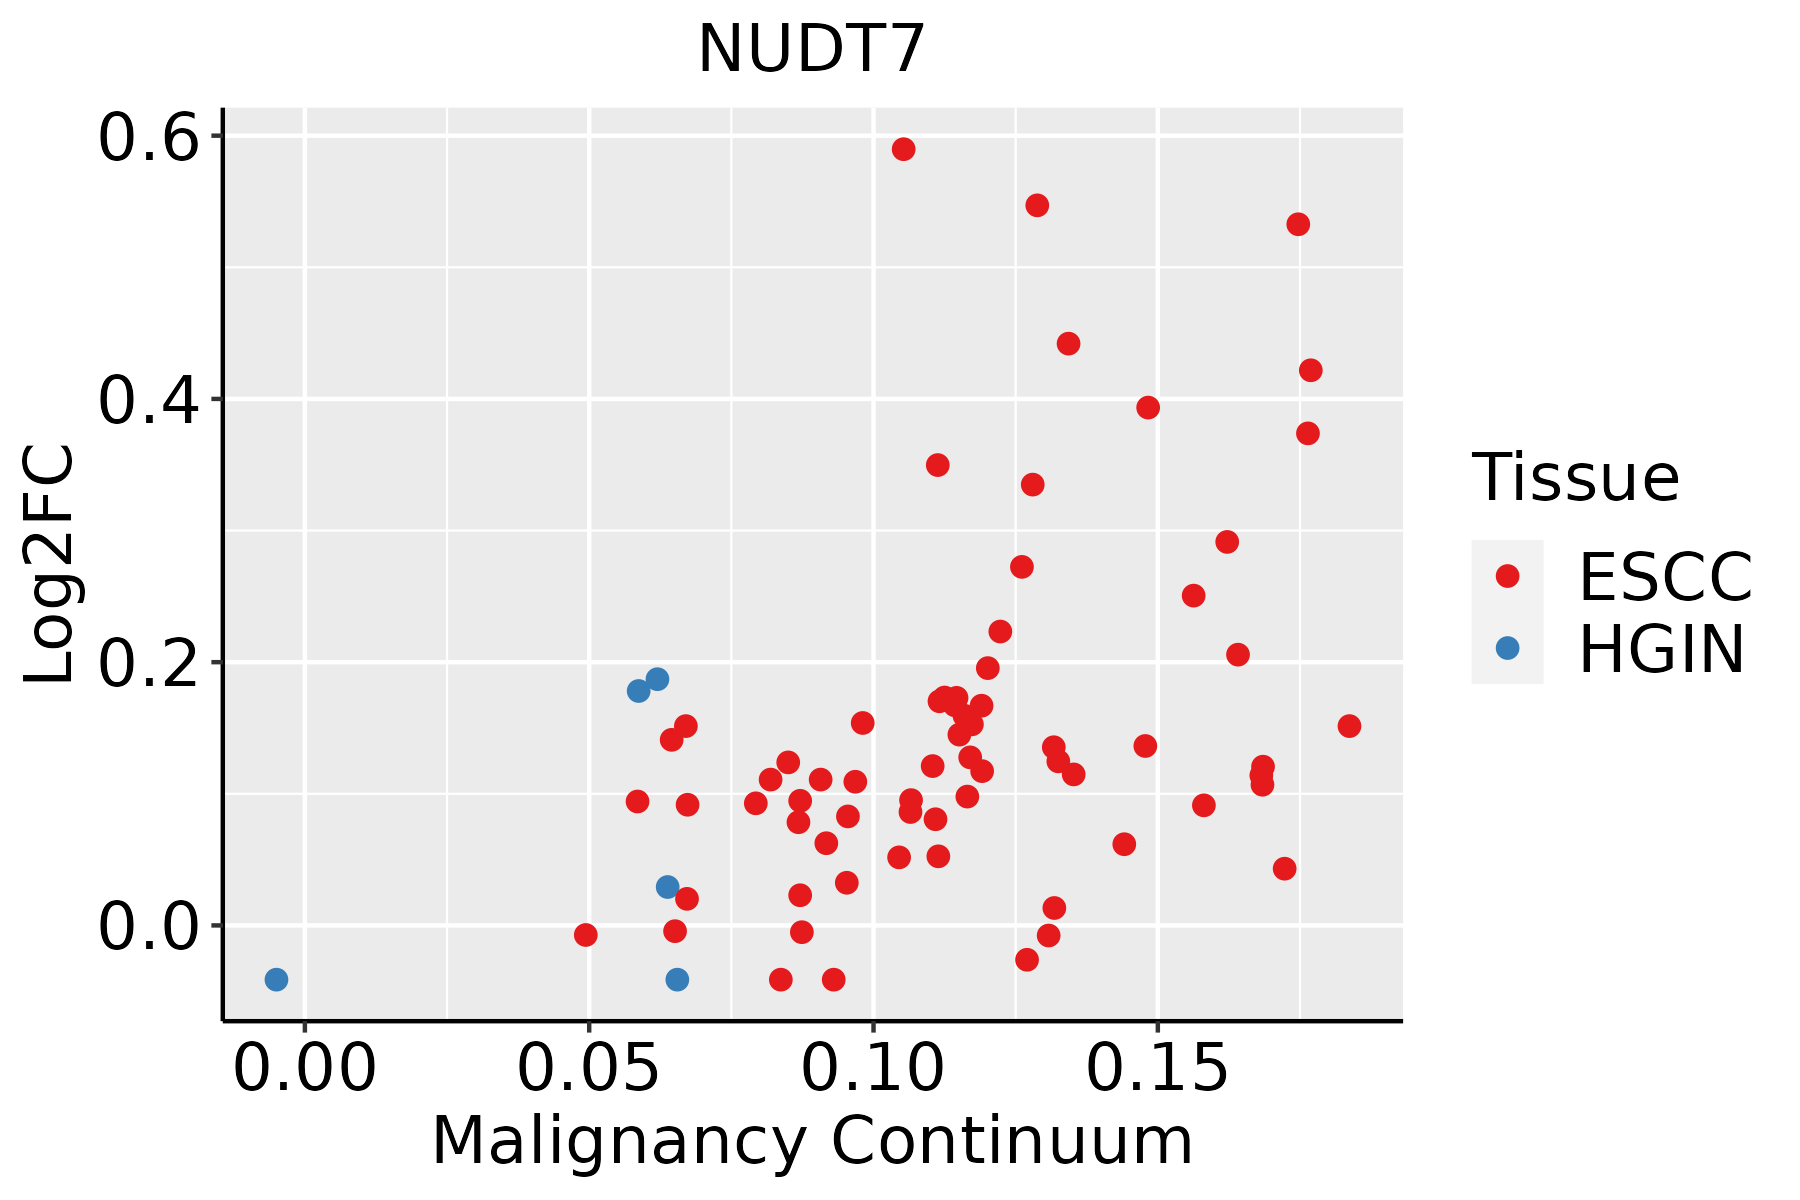 | ESCC: Esophageal squamous cell carcinoma |
| HGIN: High-grade intraepithelial neoplasias | ||
| LGIN: Low-grade intraepithelial neoplasias | ||
| Liver | 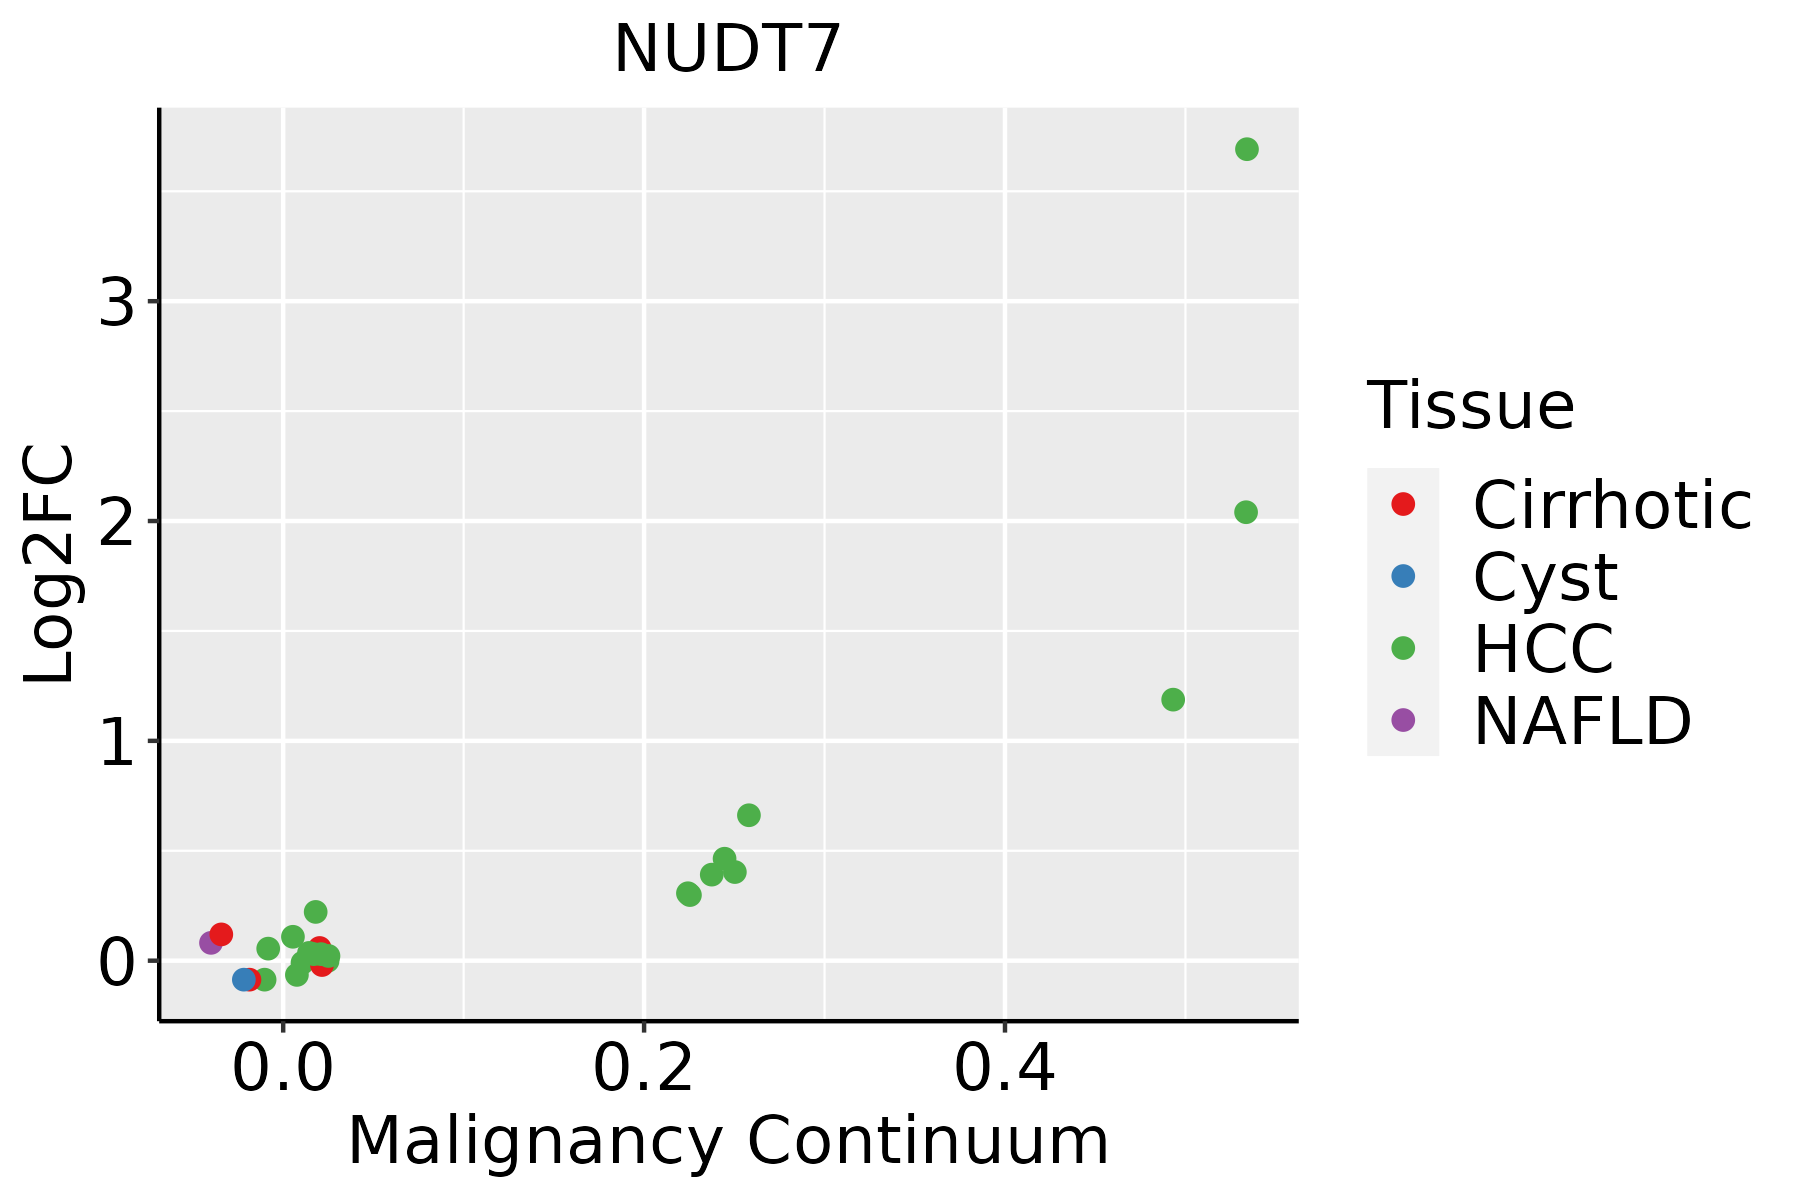 | HCC: Hepatocellular carcinoma |
| NAFLD: Non-alcoholic fatty liver disease |
| ∗log2FC in expression of this searched gene in stem-like cells from each diseased tissue sample relative to stem-like cells in normal samples in each tissue plotted against the malignancy continuum. Samples are colored based on if they are from different disease stage. |
Top |
Malignant transformation related pathway analysis |
| Find out the enriched GO biological processes and KEGG pathways involved in transition from healthy to precancer to cancer |
| Tissue | Disease Stage | Enriched GO biological Processes |
| Colorectum | AD |  |
| Colorectum | SER |  |
| Colorectum | MSS |  |
| Colorectum | MSI-H |  |
| Colorectum | FAP |  |
| ∗Top 15 enriched GO BP terms are showed in the bar plot of each disease state in each tissue. Each row represents a significant GO biological process which is colored according to the -log10(p.adjust). |
| Page: 1 2 3 4 5 6 7 8 9 |
| GO ID | Tissue | Disease Stage | Description | Gene Ratio | Bg Ratio | pvalue | p.adjust | Count |
| GO:0034655110 | Esophagus | ESCC | nucleobase-containing compound catabolic process | 272/8552 | 407/18723 | 2.92e-18 | 2.90e-16 | 272 |
| GO:004670018 | Esophagus | ESCC | heterocycle catabolic process | 286/8552 | 445/18723 | 1.12e-15 | 7.47e-14 | 286 |
| GO:004427019 | Esophagus | ESCC | cellular nitrogen compound catabolic process | 288/8552 | 451/18723 | 3.03e-15 | 1.79e-13 | 288 |
| GO:001943918 | Esophagus | ESCC | aromatic compound catabolic process | 295/8552 | 467/18723 | 1.09e-14 | 5.98e-13 | 295 |
| GO:190136118 | Esophagus | ESCC | organic cyclic compound catabolic process | 307/8552 | 495/18723 | 9.99e-14 | 4.80e-12 | 307 |
| GO:0006753110 | Esophagus | ESCC | nucleoside phosphate metabolic process | 288/8552 | 497/18723 | 1.80e-08 | 3.50e-07 | 288 |
| GO:0019693111 | Esophagus | ESCC | ribose phosphate metabolic process | 234/8552 | 396/18723 | 4.24e-08 | 7.76e-07 | 234 |
| GO:0009117111 | Esophagus | ESCC | nucleotide metabolic process | 282/8552 | 489/18723 | 4.70e-08 | 8.50e-07 | 282 |
| GO:00067906 | Esophagus | ESCC | sulfur compound metabolic process | 201/8552 | 339/18723 | 2.64e-07 | 3.94e-06 | 201 |
| GO:0009259111 | Esophagus | ESCC | ribonucleotide metabolic process | 224/8552 | 385/18723 | 4.41e-07 | 6.00e-06 | 224 |
| GO:0072521111 | Esophagus | ESCC | purine-containing compound metabolic process | 238/8552 | 416/18723 | 1.20e-06 | 1.49e-05 | 238 |
| GO:0009150111 | Esophagus | ESCC | purine ribonucleotide metabolic process | 213/8552 | 368/18723 | 1.40e-06 | 1.69e-05 | 213 |
| GO:0006163111 | Esophagus | ESCC | purine nucleotide metabolic process | 226/8552 | 396/18723 | 2.81e-06 | 3.21e-05 | 226 |
| GO:00090628 | Esophagus | ESCC | fatty acid catabolic process | 66/8552 | 100/18723 | 3.21e-05 | 2.66e-04 | 66 |
| GO:00454449 | Esophagus | ESCC | fat cell differentiation | 135/8552 | 229/18723 | 3.38e-05 | 2.78e-04 | 135 |
| GO:00066318 | Esophagus | ESCC | fatty acid metabolic process | 217/8552 | 390/18723 | 4.21e-05 | 3.39e-04 | 217 |
| GO:000913219 | Esophagus | ESCC | nucleoside diphosphate metabolic process | 77/8552 | 124/18723 | 1.65e-04 | 1.09e-03 | 77 |
| GO:00723297 | Esophagus | ESCC | monocarboxylic acid catabolic process | 74/8552 | 122/18723 | 6.03e-04 | 3.27e-03 | 74 |
| GO:00338655 | Esophagus | ESCC | nucleoside bisphosphate metabolic process | 77/8552 | 128/18723 | 6.71e-04 | 3.55e-03 | 77 |
| GO:00338755 | Esophagus | ESCC | ribonucleoside bisphosphate metabolic process | 77/8552 | 128/18723 | 6.71e-04 | 3.55e-03 | 77 |
| Page: 1 2 3 4 |
| Pathway ID | Tissue | Disease Stage | Description | Gene Ratio | Bg Ratio | pvalue | p.adjust | qvalue | Count |
| hsa041467 | Esophagus | ESCC | Peroxisome | 55/4205 | 82/8465 | 1.04e-03 | 3.27e-03 | 1.68e-03 | 55 |
| hsa0414612 | Esophagus | ESCC | Peroxisome | 55/4205 | 82/8465 | 1.04e-03 | 3.27e-03 | 1.68e-03 | 55 |
| hsa041464 | Liver | HCC | Peroxisome | 58/4020 | 82/8465 | 1.57e-05 | 1.05e-04 | 5.85e-05 | 58 |
| hsa041465 | Liver | HCC | Peroxisome | 58/4020 | 82/8465 | 1.57e-05 | 1.05e-04 | 5.85e-05 | 58 |
| Page: 1 |
Top |
Cell-cell communication analysis |
| Identification of potential cell-cell interactions between two cell types and their ligand-receptor pairs for different disease states |
| Ligand | Receptor | LRpair | Pathway | Tissue | Disease Stage |
| Page: 1 |
Top |
Single-cell gene regulatory network inference analysis |
| Find out the significant the regulons (TFs) and the target genes of each regulon across cell types for different disease states |
| TF | Cell Type | Tissue | Disease Stage | Target Gene | RSS | Regulon Activity |
| ∗The dot plots of a searched regulon are shown for all cell subpopulations in each disease state of each tissue based on the regulon specific score inferred using pySCENIC and by calculating the average expression. |
| Page: 1 |
Top |
Somatic mutation of malignant transformation related genes |
| Annotation of somatic variants for genes involved in malignant transformation |
| Hugo Symbol | Variant Class | Variant Classification | dbSNP RS | HGVSc | HGVSp | HGVSp Short | SWISSPROT | BIOTYPE | SIFT | PolyPhen | Tumor Sample Barcode | Tissue | Histology | Sex | Age | Stage | Therapy Types | Drugs | Outcome |
| NUDT7 | SNV | Missense_Mutation | rs755091970 | c.646C>A | p.Leu216Ile | p.L216I | P0C024 | protein_coding | deleterious(0.04) | probably_damaging(0.93) | TCGA-AN-A046-01 | Breast | breast invasive carcinoma | Female | >=65 | I/II | Unknown | Unknown | SD |
| NUDT7 | SNV | Missense_Mutation | c.185N>G | p.Glu62Gly | p.E62G | P0C024 | protein_coding | tolerated(0.19) | benign(0.079) | TCGA-BH-A0DL-01 | Breast | breast invasive carcinoma | Female | <65 | I/II | Chemotherapy | cytoxan | CR | |
| NUDT7 | SNV | Missense_Mutation | rs765625065 | c.232N>T | p.Arg78Cys | p.R78C | P0C024 | protein_coding | tolerated(0.34) | benign(0.017) | TCGA-AA-3715-01 | Colorectum | colon adenocarcinoma | Male | >=65 | I/II | Unknown | Unknown | PD |
| NUDT7 | SNV | Missense_Mutation | rs755091970 | c.646N>A | p.Leu216Ile | p.L216I | P0C024 | protein_coding | deleterious(0.04) | probably_damaging(0.93) | TCGA-AA-A010-01 | Colorectum | colon adenocarcinoma | Female | <65 | I/II | Chemotherapy | folinic | CR |
| NUDT7 | SNV | Missense_Mutation | c.235N>A | p.Asp79Asn | p.D79N | P0C024 | protein_coding | deleterious(0) | possibly_damaging(0.805) | TCGA-AD-6965-01 | Colorectum | colon adenocarcinoma | Male | <65 | III/IV | Chemotherapy | oxaliplatin | PD | |
| NUDT7 | SNV | Missense_Mutation | c.122C>A | p.Ser41Tyr | p.S41Y | P0C024 | protein_coding | deleterious(0) | probably_damaging(0.997) | TCGA-AZ-6601-01 | Colorectum | colon adenocarcinoma | Male | >=65 | I/II | Unknown | Unknown | PD | |
| NUDT7 | SNV | Missense_Mutation | novel | c.36A>C | p.Arg12Ser | p.R12S | P0C024 | protein_coding | deleterious(0.03) | possibly_damaging(0.63) | TCGA-CA-6717-01 | Colorectum | colon adenocarcinoma | Male | <65 | I/II | Chemotherapy | oxaliplatin | CR |
| NUDT7 | SNV | Missense_Mutation | novel | c.340C>T | p.Leu114Phe | p.L114F | P0C024 | protein_coding | tolerated(0.09) | benign(0.022) | TCGA-CA-6717-01 | Colorectum | colon adenocarcinoma | Male | <65 | I/II | Chemotherapy | oxaliplatin | CR |
| NUDT7 | SNV | Missense_Mutation | rs76004401 | c.575N>T | p.Thr192Met | p.T192M | P0C024 | protein_coding | deleterious(0) | probably_damaging(0.995) | TCGA-D5-6927-01 | Colorectum | colon adenocarcinoma | Male | <65 | I/II | Unknown | Unknown | SD |
| NUDT7 | SNV | Missense_Mutation | c.53N>G | p.Asp18Gly | p.D18G | P0C024 | protein_coding | tolerated(0.12) | benign(0.164) | TCGA-EI-6882-01 | Colorectum | rectum adenocarcinoma | Male | <65 | I/II | Unknown | Unknown | SD |
| Page: 1 2 3 |
Top |
Related drugs of malignant transformation related genes |
| Identification of chemicals and drugs interact with genes involved in malignant transfromation |
| (DGIdb 4.0) |
| Entrez ID | Symbol | Category | Interaction Types | Drug Claim Name | Drug Name | PMIDs |
| 283927 | NUDT7 | ENZYME | inhibitor | 384403663 |
| Page: 1 |

Copyright 2023-Present -The University of Texas Health Science Center at Houston |