
|
|||||
|
 | |
| |
| |
| |
| |
| |
|
Gene: NUDT3 |
Gene summary for NUDT3 |
| Gene information | Species | Human | Gene symbol | NUDT3 | Gene ID | 11165 |
| Gene name | nudix hydrolase 3 | |
| Gene Alias | DIPP | |
| Cytomap | 6p21.31 | |
| Gene Type | protein-coding | GO ID | GO:0006066 | UniProtAcc | O95989 |
Top |
Malignant transformation analysis |
| Identification of the aberrant gene expression in precancerous and cancerous lesions by comparing the gene expression of stem-like cells in diseased tissues with normal stem cells |
| Entrez ID | Symbol | Replicates | Species | Organ | Tissue | Adj P-value | Log2FC | Malignancy |
| 11165 | NUDT3 | HTA11_3410_2000001011 | Human | Colorectum | AD | 2.20e-03 | 1.55e-01 | 0.0155 |
| 11165 | NUDT3 | HTA11_1938_2000001011 | Human | Colorectum | AD | 6.47e-04 | 3.29e-01 | -0.0811 |
| 11165 | NUDT3 | HTA11_78_2000001011 | Human | Colorectum | AD | 1.08e-03 | 2.63e-01 | -0.1088 |
| 11165 | NUDT3 | HTA11_347_2000001011 | Human | Colorectum | AD | 9.38e-11 | 3.41e-01 | -0.1954 |
| 11165 | NUDT3 | HTA11_83_2000001011 | Human | Colorectum | SER | 3.92e-02 | 2.59e-01 | -0.1526 |
| 11165 | NUDT3 | HTA11_1391_2000001011 | Human | Colorectum | AD | 2.07e-08 | 3.79e-01 | -0.059 |
| 11165 | NUDT3 | HTA11_866_3004761011 | Human | Colorectum | AD | 2.52e-02 | 1.60e-01 | 0.096 |
| 11165 | NUDT3 | HTA11_4255_2000001011 | Human | Colorectum | SER | 3.18e-06 | 5.45e-01 | 0.0446 |
| 11165 | NUDT3 | HTA11_99999970781_79442 | Human | Colorectum | MSS | 2.05e-09 | 3.36e-01 | 0.294 |
| 11165 | NUDT3 | HTA11_99999965062_69753 | Human | Colorectum | MSI-H | 8.62e-04 | 7.03e-01 | 0.3487 |
| 11165 | NUDT3 | HTA11_99999965104_69814 | Human | Colorectum | MSS | 2.14e-10 | 4.30e-01 | 0.281 |
| 11165 | NUDT3 | HTA11_99999971662_82457 | Human | Colorectum | MSS | 8.90e-17 | 6.14e-01 | 0.3859 |
| 11165 | NUDT3 | HTA11_99999973899_84307 | Human | Colorectum | MSS | 8.23e-03 | 3.48e-01 | 0.2585 |
| 11165 | NUDT3 | LZE2T | Human | Esophagus | ESCC | 2.49e-05 | 4.95e-01 | 0.082 |
| 11165 | NUDT3 | LZE4T | Human | Esophagus | ESCC | 5.51e-06 | 1.23e-01 | 0.0811 |
| 11165 | NUDT3 | LZE7T | Human | Esophagus | ESCC | 3.22e-06 | 2.58e-01 | 0.0667 |
| 11165 | NUDT3 | LZE24T | Human | Esophagus | ESCC | 3.92e-10 | 3.72e-01 | 0.0596 |
| 11165 | NUDT3 | LZE21T | Human | Esophagus | ESCC | 2.01e-02 | 1.20e-01 | 0.0655 |
| 11165 | NUDT3 | P1T-E | Human | Esophagus | ESCC | 8.48e-05 | 3.53e-01 | 0.0875 |
| 11165 | NUDT3 | P2T-E | Human | Esophagus | ESCC | 3.11e-46 | 8.96e-01 | 0.1177 |
| Page: 1 2 3 4 5 6 7 8 |
| Tissue | Expression Dynamics | Abbreviation |
| Colorectum (GSE201348) |  | FAP: Familial adenomatous polyposis |
| CRC: Colorectal cancer | ||
| Colorectum (HTA11) |  | AD: Adenomas |
| SER: Sessile serrated lesions | ||
| MSI-H: Microsatellite-high colorectal cancer | ||
| MSS: Microsatellite stable colorectal cancer | ||
| Esophagus | 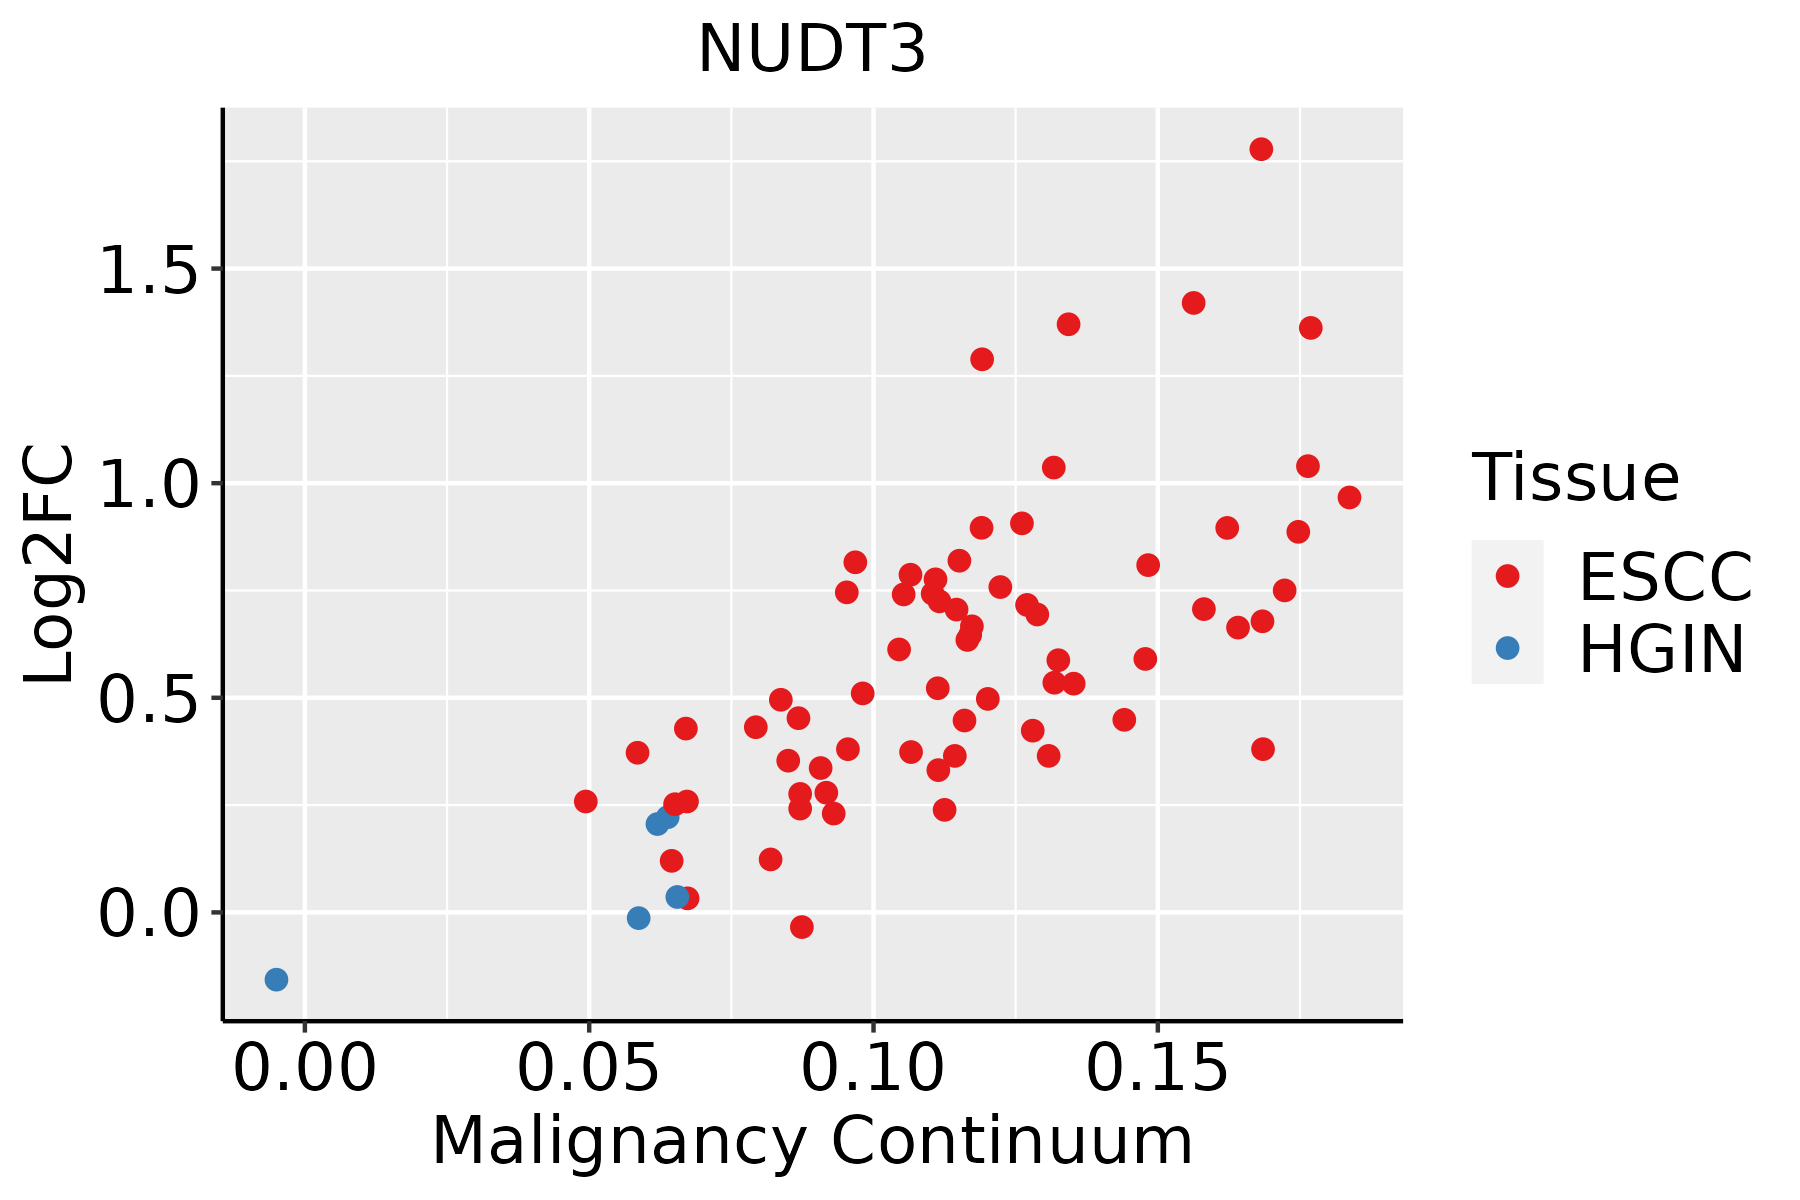 | ESCC: Esophageal squamous cell carcinoma |
| HGIN: High-grade intraepithelial neoplasias | ||
| LGIN: Low-grade intraepithelial neoplasias | ||
| Liver |  | HCC: Hepatocellular carcinoma |
| NAFLD: Non-alcoholic fatty liver disease | ||
| Oral Cavity |  | EOLP: Erosive Oral lichen planus |
| LP: leukoplakia | ||
| NEOLP: Non-erosive oral lichen planus | ||
| OSCC: Oral squamous cell carcinoma | ||
| Prostate |  | BPH: Benign Prostatic Hyperplasia |
| Skin | 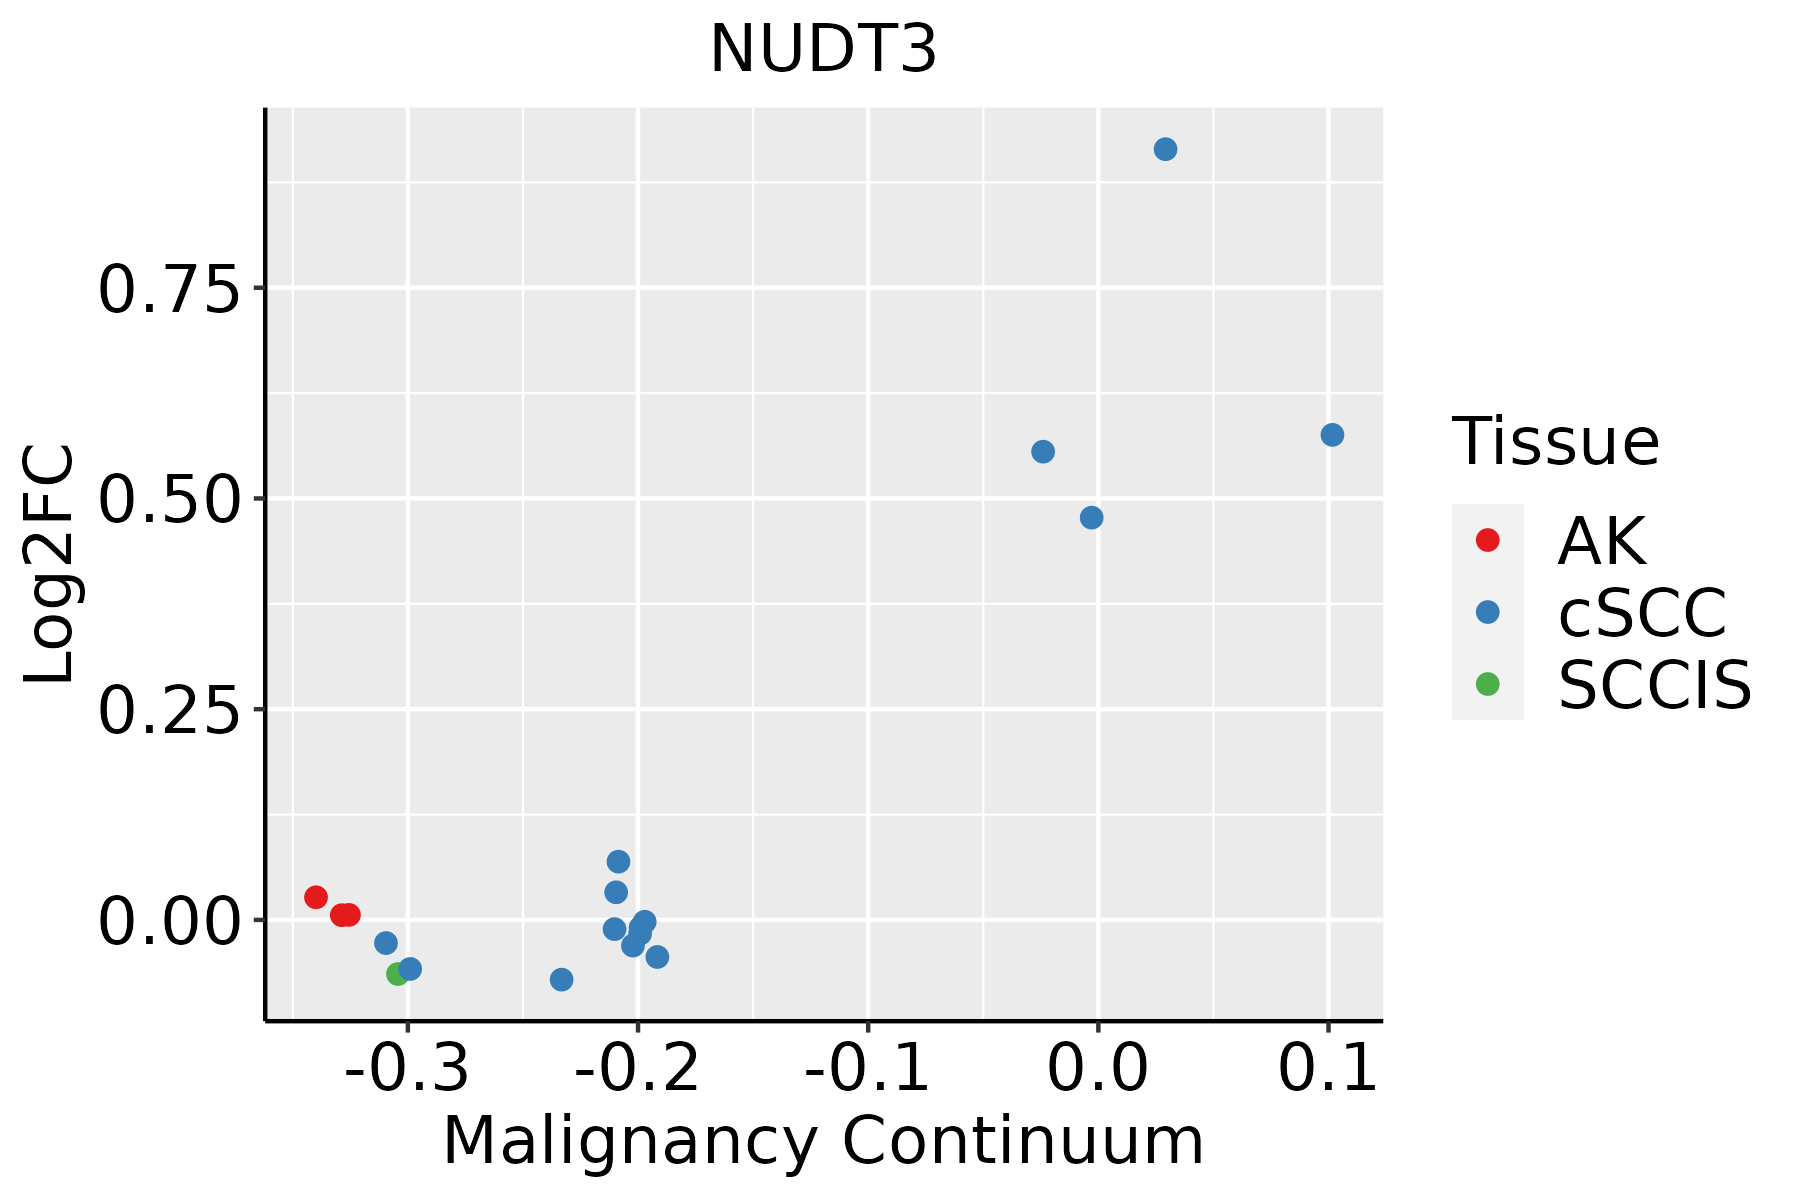 | AK: Actinic keratosis |
| cSCC: Cutaneous squamous cell carcinoma | ||
| SCCIS:squamous cell carcinoma in situ | ||
| Thyroid |  | ATC: Anaplastic thyroid cancer |
| HT: Hashimoto's thyroiditis | ||
| PTC: Papillary thyroid cancer |
| ∗log2FC in expression of this searched gene in stem-like cells from each diseased tissue sample relative to stem-like cells in normal samples in each tissue plotted against the malignancy continuum. Samples are colored based on if they are from different disease stage. |
Top |
Malignant transformation related pathway analysis |
| Find out the enriched GO biological processes and KEGG pathways involved in transition from healthy to precancer to cancer |
| Tissue | Disease Stage | Enriched GO biological Processes |
| Colorectum | AD |  |
| Colorectum | SER |  |
| Colorectum | MSS |  |
| Colorectum | MSI-H |  |
| Colorectum | FAP |  |
| ∗Top 15 enriched GO BP terms are showed in the bar plot of each disease state in each tissue. Each row represents a significant GO biological process which is colored according to the -log10(p.adjust). |
| Page: 1 2 3 4 5 6 7 8 9 |
| GO ID | Tissue | Disease Stage | Description | Gene Ratio | Bg Ratio | pvalue | p.adjust | Count |
| GO:0009150 | Colorectum | AD | purine ribonucleotide metabolic process | 142/3918 | 368/18723 | 4.29e-15 | 1.17e-12 | 142 |
| GO:0006163 | Colorectum | AD | purine nucleotide metabolic process | 149/3918 | 396/18723 | 1.08e-14 | 2.80e-12 | 149 |
| GO:0072521 | Colorectum | AD | purine-containing compound metabolic process | 153/3918 | 416/18723 | 4.34e-14 | 1.01e-11 | 153 |
| GO:0009259 | Colorectum | AD | ribonucleotide metabolic process | 144/3918 | 385/18723 | 5.25e-14 | 1.13e-11 | 144 |
| GO:0019693 | Colorectum | AD | ribose phosphate metabolic process | 145/3918 | 396/18723 | 3.01e-13 | 5.71e-11 | 145 |
| GO:0009117 | Colorectum | AD | nucleotide metabolic process | 168/3918 | 489/18723 | 2.20e-12 | 3.36e-10 | 168 |
| GO:0006753 | Colorectum | AD | nucleoside phosphate metabolic process | 169/3918 | 497/18723 | 4.99e-12 | 6.98e-10 | 169 |
| GO:0044270 | Colorectum | AD | cellular nitrogen compound catabolic process | 147/3918 | 451/18723 | 3.35e-09 | 2.23e-07 | 147 |
| GO:0046700 | Colorectum | AD | heterocycle catabolic process | 145/3918 | 445/18723 | 4.37e-09 | 2.84e-07 | 145 |
| GO:0034655 | Colorectum | AD | nucleobase-containing compound catabolic process | 133/3918 | 407/18723 | 1.56e-08 | 9.12e-07 | 133 |
| GO:0019439 | Colorectum | AD | aromatic compound catabolic process | 146/3918 | 467/18723 | 7.48e-08 | 3.84e-06 | 146 |
| GO:1901361 | Colorectum | AD | organic cyclic compound catabolic process | 153/3918 | 495/18723 | 8.23e-08 | 4.18e-06 | 153 |
| GO:0044282 | Colorectum | AD | small molecule catabolic process | 118/3918 | 376/18723 | 1.05e-06 | 3.55e-05 | 118 |
| GO:0006066 | Colorectum | AD | alcohol metabolic process | 106/3918 | 353/18723 | 3.02e-05 | 5.57e-04 | 106 |
| GO:0006195 | Colorectum | AD | purine nucleotide catabolic process | 18/3918 | 46/18723 | 3.67e-03 | 2.60e-02 | 18 |
| GO:0046164 | Colorectum | AD | alcohol catabolic process | 20/3918 | 55/18723 | 6.03e-03 | 3.78e-02 | 20 |
| GO:0072523 | Colorectum | AD | purine-containing compound catabolic process | 19/3918 | 52/18723 | 6.92e-03 | 4.26e-02 | 19 |
| GO:00061631 | Colorectum | SER | purine nucleotide metabolic process | 109/2897 | 396/18723 | 4.26e-10 | 5.44e-08 | 109 |
| GO:00091501 | Colorectum | SER | purine ribonucleotide metabolic process | 103/2897 | 368/18723 | 4.69e-10 | 5.68e-08 | 103 |
| GO:00725211 | Colorectum | SER | purine-containing compound metabolic process | 113/2897 | 416/18723 | 4.80e-10 | 5.68e-08 | 113 |
| Page: 1 2 3 4 5 6 7 8 9 10 |
| Pathway ID | Tissue | Disease Stage | Description | Gene Ratio | Bg Ratio | pvalue | p.adjust | qvalue | Count |
| Page: 1 |
Top |
Cell-cell communication analysis |
| Identification of potential cell-cell interactions between two cell types and their ligand-receptor pairs for different disease states |
| Ligand | Receptor | LRpair | Pathway | Tissue | Disease Stage |
| Page: 1 |
Top |
Single-cell gene regulatory network inference analysis |
| Find out the significant the regulons (TFs) and the target genes of each regulon across cell types for different disease states |
| TF | Cell Type | Tissue | Disease Stage | Target Gene | RSS | Regulon Activity |
| ∗The dot plots of a searched regulon are shown for all cell subpopulations in each disease state of each tissue based on the regulon specific score inferred using pySCENIC and by calculating the average expression. |
| Page: 1 |
Top |
Somatic mutation of malignant transformation related genes |
| Annotation of somatic variants for genes involved in malignant transformation |
| Hugo Symbol | Variant Class | Variant Classification | dbSNP RS | HGVSc | HGVSp | HGVSp Short | SWISSPROT | BIOTYPE | SIFT | PolyPhen | Tumor Sample Barcode | Tissue | Histology | Sex | Age | Stage | Therapy Types | Drugs | Outcome |
| NUDT3 | SNV | Missense_Mutation | c.429N>C | p.Leu143Phe | p.L143F | O95989 | protein_coding | deleterious(0.01) | probably_damaging(0.991) | TCGA-E9-A22G-01 | Breast | breast invasive carcinoma | Female | <65 | I/II | Chemotherapy | doxorubicin | SD | |
| NUDT3 | SNV | Missense_Mutation | novel | c.458N>A | p.Thr153Asn | p.T153N | O95989 | protein_coding | tolerated(0.64) | benign(0.003) | TCGA-C5-A8ZZ-01 | Cervix | cervical & endocervical cancer | Female | <65 | I/II | Unspecific | Cisplatin | SD |
| NUDT3 | SNV | Missense_Mutation | novel | c.134N>A | p.Arg45Lys | p.R45K | O95989 | protein_coding | tolerated(0.85) | benign(0) | TCGA-JW-A5VL-01 | Cervix | cervical & endocervical cancer | Female | <65 | I/II | Unknown | Unknown | SD |
| NUDT3 | SNV | Missense_Mutation | c.187N>A | p.Ala63Thr | p.A63T | O95989 | protein_coding | deleterious(0.02) | probably_damaging(0.993) | TCGA-DM-A28H-01 | Colorectum | colon adenocarcinoma | Male | <65 | III/IV | Unknown | Unknown | PD | |
| NUDT3 | SNV | Missense_Mutation | c.500N>T | p.Ser167Leu | p.S167L | O95989 | protein_coding | deleterious_low_confidence(0.03) | benign(0.163) | TCGA-AP-A056-01 | Endometrium | uterine corpus endometrioid carcinoma | Female | <65 | I/II | Unknown | Unknown | SD | |
| NUDT3 | SNV | Missense_Mutation | novel | c.514N>G | p.Arg172Gly | p.R172G | O95989 | protein_coding | deleterious_low_confidence(0) | probably_damaging(0.916) | TCGA-EO-A3AV-01 | Endometrium | uterine corpus endometrioid carcinoma | Female | <65 | III/IV | Chemotherapy | carboplatin | CR |
| NUDT3 | SNV | Missense_Mutation | novel | c.127C>G | p.Pro43Ala | p.P43A | O95989 | protein_coding | deleterious(0) | probably_damaging(0.984) | TCGA-60-2714-01 | Lung | lung squamous cell carcinoma | Female | >=65 | I/II | Chemotherapy | taxol | SD |
| NUDT3 | SNV | Missense_Mutation | c.194N>A | p.Arg65His | p.R65H | O95989 | protein_coding | deleterious(0) | probably_damaging(0.996) | TCGA-HJ-7597-01 | Stomach | stomach adenocarcinoma | Female | >=65 | I/II | Chemotherapy | fluorouracil | CR |
| Page: 1 |
Top |
Related drugs of malignant transformation related genes |
| Identification of chemicals and drugs interact with genes involved in malignant transfromation |
| (DGIdb 4.0) |
| Entrez ID | Symbol | Category | Interaction Types | Drug Claim Name | Drug Name | PMIDs |
| Page: 1 |

Copyright 2023-Present -The University of Texas Health Science Center at Houston |