
|
|||||
|
 | |
| |
| |
| |
| |
| |
|
Gene: NUDT18 |
Gene summary for NUDT18 |
| Gene information | Species | Human | Gene symbol | NUDT18 | Gene ID | 79873 |
| Gene name | nudix hydrolase 18 | |
| Gene Alias | MTH3 | |
| Cytomap | 8p21.3 | |
| Gene Type | protein-coding | GO ID | GO:0006139 | UniProtAcc | Q6ZVK8 |
Top |
Malignant transformation analysis |
| Identification of the aberrant gene expression in precancerous and cancerous lesions by comparing the gene expression of stem-like cells in diseased tissues with normal stem cells |
| Entrez ID | Symbol | Replicates | Species | Organ | Tissue | Adj P-value | Log2FC | Malignancy |
| 79873 | NUDT18 | C04 | Human | Oral cavity | OSCC | 8.00e-04 | 1.87e-01 | 0.2633 |
| 79873 | NUDT18 | C21 | Human | Oral cavity | OSCC | 5.49e-15 | 3.95e-01 | 0.2678 |
| 79873 | NUDT18 | C30 | Human | Oral cavity | OSCC | 1.69e-26 | 8.79e-01 | 0.3055 |
| 79873 | NUDT18 | C38 | Human | Oral cavity | OSCC | 2.39e-04 | 2.95e-01 | 0.172 |
| 79873 | NUDT18 | C46 | Human | Oral cavity | OSCC | 3.19e-04 | 1.14e-01 | 0.1673 |
| 79873 | NUDT18 | C51 | Human | Oral cavity | OSCC | 2.02e-07 | 3.36e-01 | 0.2674 |
| 79873 | NUDT18 | C57 | Human | Oral cavity | OSCC | 5.31e-07 | 2.29e-01 | 0.1679 |
| 79873 | NUDT18 | C06 | Human | Oral cavity | OSCC | 1.12e-02 | 7.33e-01 | 0.2699 |
| 79873 | NUDT18 | C08 | Human | Oral cavity | OSCC | 1.61e-03 | 1.50e-01 | 0.1919 |
| 79873 | NUDT18 | LN22 | Human | Oral cavity | OSCC | 1.87e-04 | 4.85e-01 | 0.1733 |
| 79873 | NUDT18 | SYSMH1 | Human | Oral cavity | OSCC | 1.85e-09 | 1.77e-01 | 0.1127 |
| 79873 | NUDT18 | SYSMH3 | Human | Oral cavity | OSCC | 1.15e-02 | 8.77e-02 | 0.2442 |
| Page: 1 |
| Tissue | Expression Dynamics | Abbreviation |
| Oral Cavity | 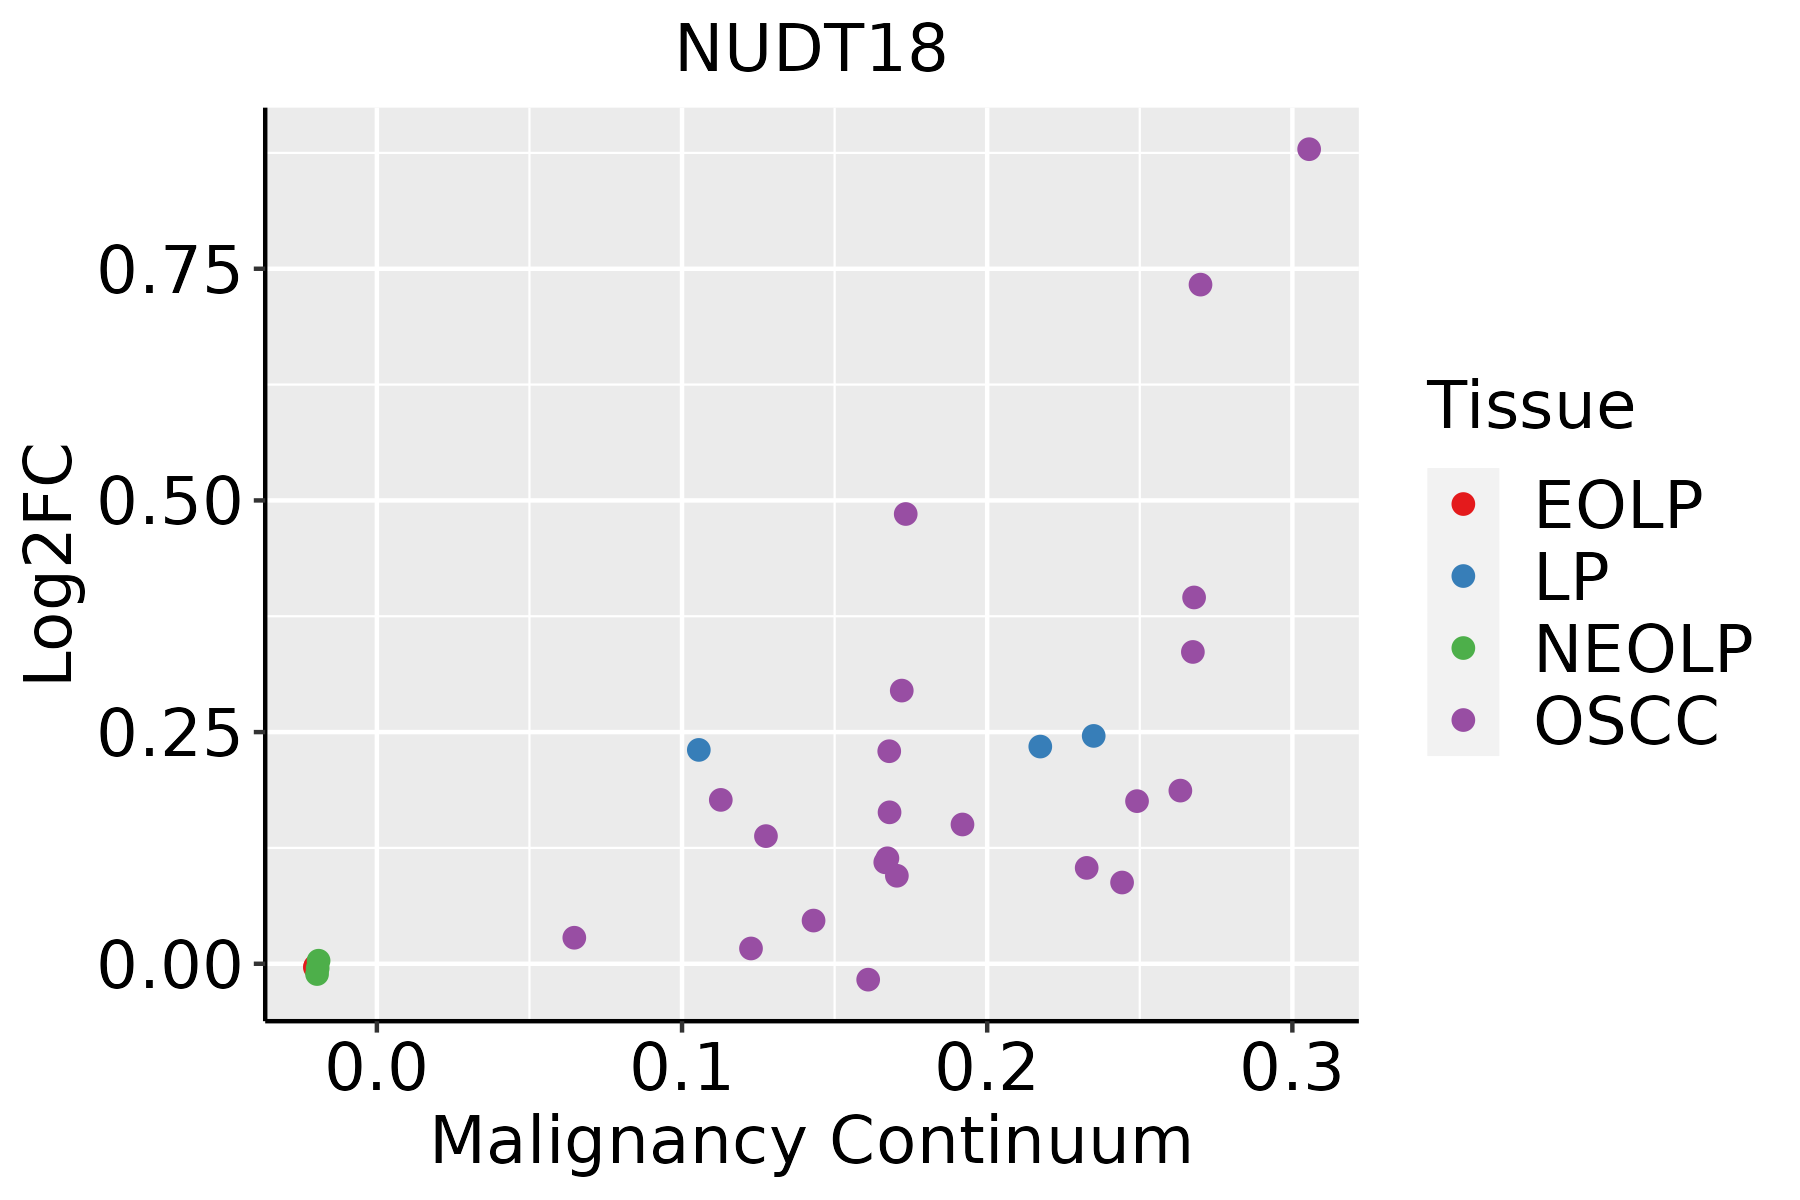 | EOLP: Erosive Oral lichen planus |
| LP: leukoplakia | ||
| NEOLP: Non-erosive oral lichen planus | ||
| OSCC: Oral squamous cell carcinoma |
| ∗log2FC in expression of this searched gene in stem-like cells from each diseased tissue sample relative to stem-like cells in normal samples in each tissue plotted against the malignancy continuum. Samples are colored based on if they are from different disease stage. |
Top |
Malignant transformation related pathway analysis |
| Find out the enriched GO biological processes and KEGG pathways involved in transition from healthy to precancer to cancer |
| Tissue | Disease Stage | Enriched GO biological Processes |
| Colorectum | AD |  |
| Colorectum | SER |  |
| Colorectum | MSS |  |
| Colorectum | MSI-H |  |
| Colorectum | FAP |  |
| ∗Top 15 enriched GO BP terms are showed in the bar plot of each disease state in each tissue. Each row represents a significant GO biological process which is colored according to the -log10(p.adjust). |
| Page: 1 2 3 4 5 6 7 8 9 |
| GO ID | Tissue | Disease Stage | Description | Gene Ratio | Bg Ratio | pvalue | p.adjust | Count |
| GO:003465517 | Oral cavity | OSCC | nucleobase-containing compound catabolic process | 244/7305 | 407/18723 | 5.38e-18 | 5.49e-16 | 244 |
| GO:004670015 | Oral cavity | OSCC | heterocycle catabolic process | 254/7305 | 445/18723 | 5.07e-15 | 3.31e-13 | 254 |
| GO:004427016 | Oral cavity | OSCC | cellular nitrogen compound catabolic process | 256/7305 | 451/18723 | 9.67e-15 | 5.88e-13 | 256 |
| GO:001943915 | Oral cavity | OSCC | aromatic compound catabolic process | 263/7305 | 467/18723 | 1.49e-14 | 8.84e-13 | 263 |
| GO:190136115 | Oral cavity | OSCC | organic cyclic compound catabolic process | 272/7305 | 495/18723 | 2.73e-13 | 1.36e-11 | 272 |
| GO:000675318 | Oral cavity | OSCC | nucleoside phosphate metabolic process | 247/7305 | 497/18723 | 6.28e-07 | 8.96e-06 | 247 |
| GO:000911719 | Oral cavity | OSCC | nucleotide metabolic process | 243/7305 | 489/18723 | 7.80e-07 | 1.09e-05 | 243 |
| GO:001969319 | Oral cavity | OSCC | ribose phosphate metabolic process | 199/7305 | 396/18723 | 2.97e-06 | 3.64e-05 | 199 |
| GO:00196923 | Oral cavity | OSCC | deoxyribose phosphate metabolic process | 30/7305 | 42/18723 | 2.06e-05 | 1.96e-04 | 30 |
| GO:00092623 | Oral cavity | OSCC | deoxyribonucleotide metabolic process | 31/7305 | 44/18723 | 2.33e-05 | 2.21e-04 | 31 |
| GO:000925919 | Oral cavity | OSCC | ribonucleotide metabolic process | 189/7305 | 385/18723 | 3.18e-05 | 2.87e-04 | 189 |
| GO:000913217 | Oral cavity | OSCC | nucleoside diphosphate metabolic process | 70/7305 | 124/18723 | 6.03e-05 | 4.95e-04 | 70 |
| GO:00093943 | Oral cavity | OSCC | 2'-deoxyribonucleotide metabolic process | 28/7305 | 40/18723 | 7.00e-05 | 5.60e-04 | 28 |
| GO:007252120 | Oral cavity | OSCC | purine-containing compound metabolic process | 199/7305 | 416/18723 | 1.34e-04 | 9.53e-04 | 199 |
| GO:000915020 | Oral cavity | OSCC | purine ribonucleotide metabolic process | 178/7305 | 368/18723 | 1.45e-04 | 1.02e-03 | 178 |
| GO:000918518 | Oral cavity | OSCC | ribonucleoside diphosphate metabolic process | 60/7305 | 106/18723 | 1.78e-04 | 1.21e-03 | 60 |
| GO:000913519 | Oral cavity | OSCC | purine nucleoside diphosphate metabolic process | 58/7305 | 103/18723 | 2.73e-04 | 1.73e-03 | 58 |
| GO:000917919 | Oral cavity | OSCC | purine ribonucleoside diphosphate metabolic process | 58/7305 | 103/18723 | 2.73e-04 | 1.73e-03 | 58 |
| GO:000616320 | Oral cavity | OSCC | purine nucleotide metabolic process | 188/7305 | 396/18723 | 3.31e-04 | 2.04e-03 | 188 |
| GO:19011361 | Oral cavity | OSCC | carbohydrate derivative catabolic process | 89/7305 | 172/18723 | 4.52e-04 | 2.73e-03 | 89 |
| Page: 1 2 |
| Pathway ID | Tissue | Disease Stage | Description | Gene Ratio | Bg Ratio | pvalue | p.adjust | qvalue | Count |
| Page: 1 |
Top |
Cell-cell communication analysis |
| Identification of potential cell-cell interactions between two cell types and their ligand-receptor pairs for different disease states |
| Ligand | Receptor | LRpair | Pathway | Tissue | Disease Stage |
| Page: 1 |
Top |
Single-cell gene regulatory network inference analysis |
| Find out the significant the regulons (TFs) and the target genes of each regulon across cell types for different disease states |
| TF | Cell Type | Tissue | Disease Stage | Target Gene | RSS | Regulon Activity |
| ∗The dot plots of a searched regulon are shown for all cell subpopulations in each disease state of each tissue based on the regulon specific score inferred using pySCENIC and by calculating the average expression. |
| Page: 1 |
Top |
Somatic mutation of malignant transformation related genes |
| Annotation of somatic variants for genes involved in malignant transformation |
| Hugo Symbol | Variant Class | Variant Classification | dbSNP RS | HGVSc | HGVSp | HGVSp Short | SWISSPROT | BIOTYPE | SIFT | PolyPhen | Tumor Sample Barcode | Tissue | Histology | Sex | Age | Stage | Therapy Types | Drugs | Outcome |
| NUDT18 | deletion | Frame_Shift_Del | rs746932624 | c.601_604delACAG | p.Thr201CysfsTer4 | p.T201Cfs*4 | Q6ZVK8 | protein_coding | TCGA-E2-A15P-01 | Breast | breast invasive carcinoma | Female | <65 | I/II | Hormone Therapy | arimidex | SD | ||
| NUDT18 | SNV | Missense_Mutation | novel | c.800N>A | p.Gly267Asp | p.G267D | Q6ZVK8 | protein_coding | deleterious(0) | probably_damaging(1) | TCGA-AD-5900-01 | Colorectum | colon adenocarcinoma | Male | >=65 | I/II | Unknown | Unknown | SD |
| NUDT18 | SNV | Missense_Mutation | novel | c.170N>C | p.Val57Ala | p.V57A | Q6ZVK8 | protein_coding | deleterious(0) | probably_damaging(0.997) | TCGA-AZ-6601-01 | Colorectum | colon adenocarcinoma | Male | >=65 | I/II | Unknown | Unknown | PD |
| NUDT18 | SNV | Missense_Mutation | rs375524530 | c.659N>A | p.Gly220Asp | p.G220D | Q6ZVK8 | protein_coding | tolerated(0.06) | benign(0.099) | TCGA-CK-4951-01 | Colorectum | colon adenocarcinoma | Female | >=65 | I/II | Unknown | Unknown | PD |
| NUDT18 | SNV | Missense_Mutation | novel | c.609N>T | p.Trp203Cys | p.W203C | Q6ZVK8 | protein_coding | deleterious(0) | probably_damaging(0.998) | TCGA-CK-5916-01 | Colorectum | colon adenocarcinoma | Female | >=65 | I/II | Unknown | Unknown | PD |
| NUDT18 | SNV | Missense_Mutation | novel | c.928N>T | p.Leu310Phe | p.L310F | Q6ZVK8 | protein_coding | tolerated(0.08) | benign(0.162) | TCGA-DM-A0XD-01 | Colorectum | colon adenocarcinoma | Male | >=65 | I/II | Unknown | Unknown | PD |
| NUDT18 | deletion | Frame_Shift_Del | novel | c.207delG | p.Ser70ArgfsTer23 | p.S70Rfs*23 | Q6ZVK8 | protein_coding | TCGA-NH-A5IV-01 | Colorectum | colon adenocarcinoma | Female | >=65 | I/II | Unknown | Unknown | SD | ||
| NUDT18 | SNV | Missense_Mutation | rs368870753 | c.508N>T | p.Arg170Cys | p.R170C | Q6ZVK8 | protein_coding | tolerated(0.18) | benign(0.094) | TCGA-AJ-A3EL-01 | Endometrium | uterine corpus endometrioid carcinoma | Female | <65 | I/II | Unknown | Unknown | SD |
| NUDT18 | SNV | Missense_Mutation | novel | c.686N>A | p.Gly229Asp | p.G229D | Q6ZVK8 | protein_coding | tolerated(0.05) | possibly_damaging(0.454) | TCGA-D1-A103-01 | Endometrium | uterine corpus endometrioid carcinoma | Female | >=65 | I/II | Unknown | Unknown | SD |
| NUDT18 | SNV | Missense_Mutation | rs375524530 | c.659N>A | p.Gly220Asp | p.G220D | Q6ZVK8 | protein_coding | tolerated(0.06) | benign(0.099) | TCGA-E6-A1LX-01 | Endometrium | uterine corpus endometrioid carcinoma | Female | <65 | I/II | Unknown | Unknown | SD |
| Page: 1 2 |
Top |
Related drugs of malignant transformation related genes |
| Identification of chemicals and drugs interact with genes involved in malignant transfromation |
| (DGIdb 4.0) |
| Entrez ID | Symbol | Category | Interaction Types | Drug Claim Name | Drug Name | PMIDs |
| Page: 1 |

Copyright 2023-Present -The University of Texas Health Science Center at Houston |