
|
|||||
|
 | |
| |
| |
| |
| |
| |
|
Gene: NUDT16L1 |
Gene summary for NUDT16L1 |
| Gene information | Species | Human | Gene symbol | NUDT16L1 | Gene ID | 84309 |
| Gene name | nudix hydrolase 16 like 1 | |
| Gene Alias | SDOS | |
| Cytomap | 16p13.3 | |
| Gene Type | protein-coding | GO ID | GO:0006139 | UniProtAcc | W4VSQ8 |
Top |
Malignant transformation analysis |
| Identification of the aberrant gene expression in precancerous and cancerous lesions by comparing the gene expression of stem-like cells in diseased tissues with normal stem cells |
| Entrez ID | Symbol | Replicates | Species | Organ | Tissue | Adj P-value | Log2FC | Malignancy |
| 84309 | NUDT16L1 | GSM4909293 | Human | Breast | IDC | 4.82e-13 | 4.10e-01 | 0.1581 |
| 84309 | NUDT16L1 | GSM4909298 | Human | Breast | IDC | 1.74e-05 | 2.88e-01 | 0.1551 |
| 84309 | NUDT16L1 | GSM4909305 | Human | Breast | IDC | 1.89e-04 | 3.06e-01 | 0.0436 |
| 84309 | NUDT16L1 | GSM4909306 | Human | Breast | IDC | 3.35e-20 | 6.42e-01 | 0.1564 |
| 84309 | NUDT16L1 | GSM4909308 | Human | Breast | IDC | 6.80e-15 | 4.20e-01 | 0.158 |
| 84309 | NUDT16L1 | GSM4909311 | Human | Breast | IDC | 5.34e-05 | -2.42e-02 | 0.1534 |
| 84309 | NUDT16L1 | GSM4909317 | Human | Breast | IDC | 2.53e-08 | 3.46e-01 | 0.1355 |
| 84309 | NUDT16L1 | GSM4909319 | Human | Breast | IDC | 1.82e-12 | 8.90e-02 | 0.1563 |
| 84309 | NUDT16L1 | GSM4909321 | Human | Breast | IDC | 2.55e-03 | 1.79e-01 | 0.1559 |
| 84309 | NUDT16L1 | M1 | Human | Breast | IDC | 2.24e-04 | 2.80e-01 | 0.1577 |
| 84309 | NUDT16L1 | DCIS2 | Human | Breast | DCIS | 4.30e-26 | 7.05e-02 | 0.0085 |
| 84309 | NUDT16L1 | LZE4T | Human | Esophagus | ESCC | 2.98e-07 | 2.91e-01 | 0.0811 |
| 84309 | NUDT16L1 | LZE7T | Human | Esophagus | ESCC | 1.97e-08 | 5.70e-01 | 0.0667 |
| 84309 | NUDT16L1 | LZE8T | Human | Esophagus | ESCC | 8.88e-05 | 2.13e-01 | 0.067 |
| 84309 | NUDT16L1 | LZE20T | Human | Esophagus | ESCC | 4.85e-07 | 2.49e-01 | 0.0662 |
| 84309 | NUDT16L1 | LZE22D1 | Human | Esophagus | HGIN | 9.57e-03 | 1.19e-01 | 0.0595 |
| 84309 | NUDT16L1 | LZE24T | Human | Esophagus | ESCC | 1.22e-18 | 5.30e-01 | 0.0596 |
| 84309 | NUDT16L1 | LZE21T | Human | Esophagus | ESCC | 1.14e-04 | 3.87e-01 | 0.0655 |
| 84309 | NUDT16L1 | LZE6T | Human | Esophagus | ESCC | 1.51e-03 | 1.09e-01 | 0.0845 |
| 84309 | NUDT16L1 | P1T-E | Human | Esophagus | ESCC | 1.44e-06 | 4.63e-01 | 0.0875 |
| Page: 1 2 3 4 5 6 7 |
| Tissue | Expression Dynamics | Abbreviation |
| Breast |  | IDC: Invasive ductal carcinoma |
| DCIS: Ductal carcinoma in situ | ||
| Precancer(BRCA1-mut): Precancerous lesion from BRCA1 mutation carriers | ||
| Esophagus | 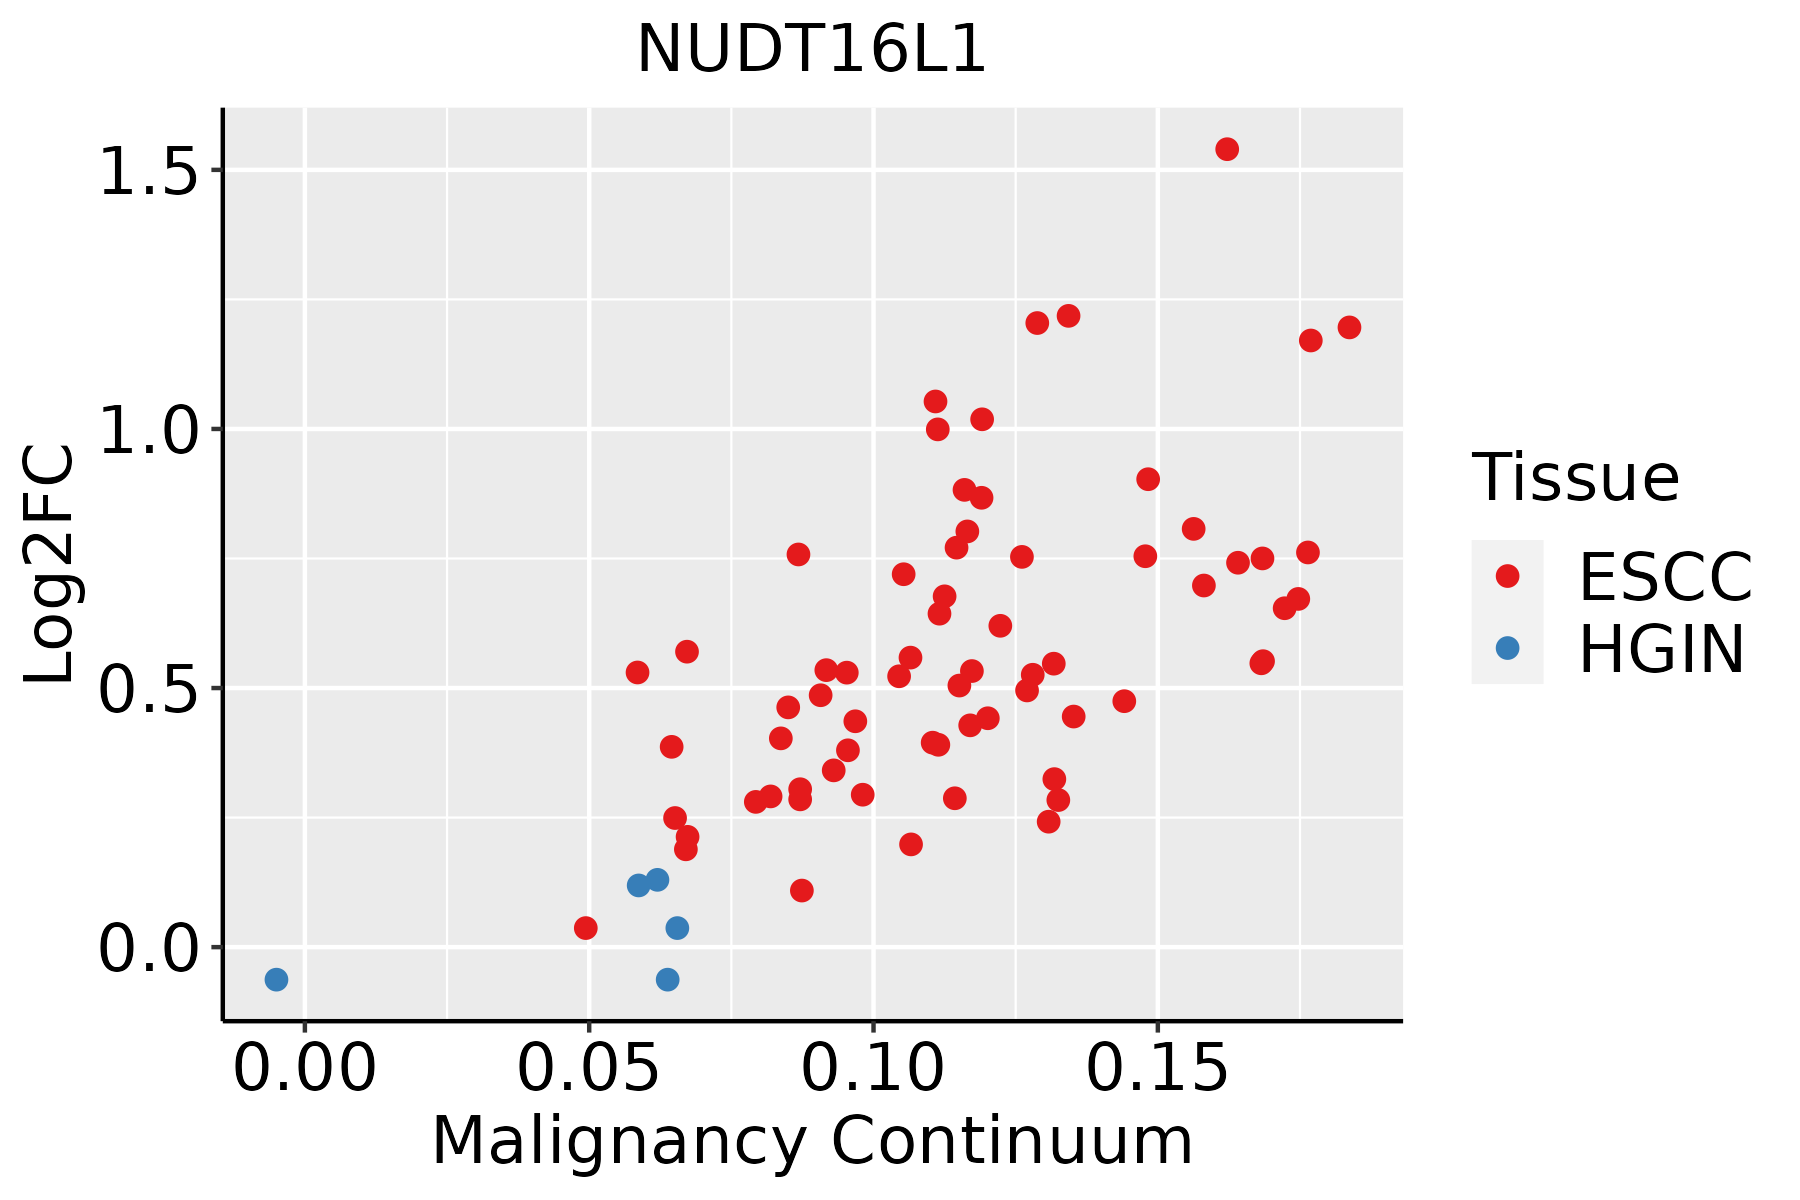 | ESCC: Esophageal squamous cell carcinoma |
| HGIN: High-grade intraepithelial neoplasias | ||
| LGIN: Low-grade intraepithelial neoplasias | ||
| Liver |  | HCC: Hepatocellular carcinoma |
| NAFLD: Non-alcoholic fatty liver disease | ||
| Oral Cavity |  | EOLP: Erosive Oral lichen planus |
| LP: leukoplakia | ||
| NEOLP: Non-erosive oral lichen planus | ||
| OSCC: Oral squamous cell carcinoma | ||
| Prostate | 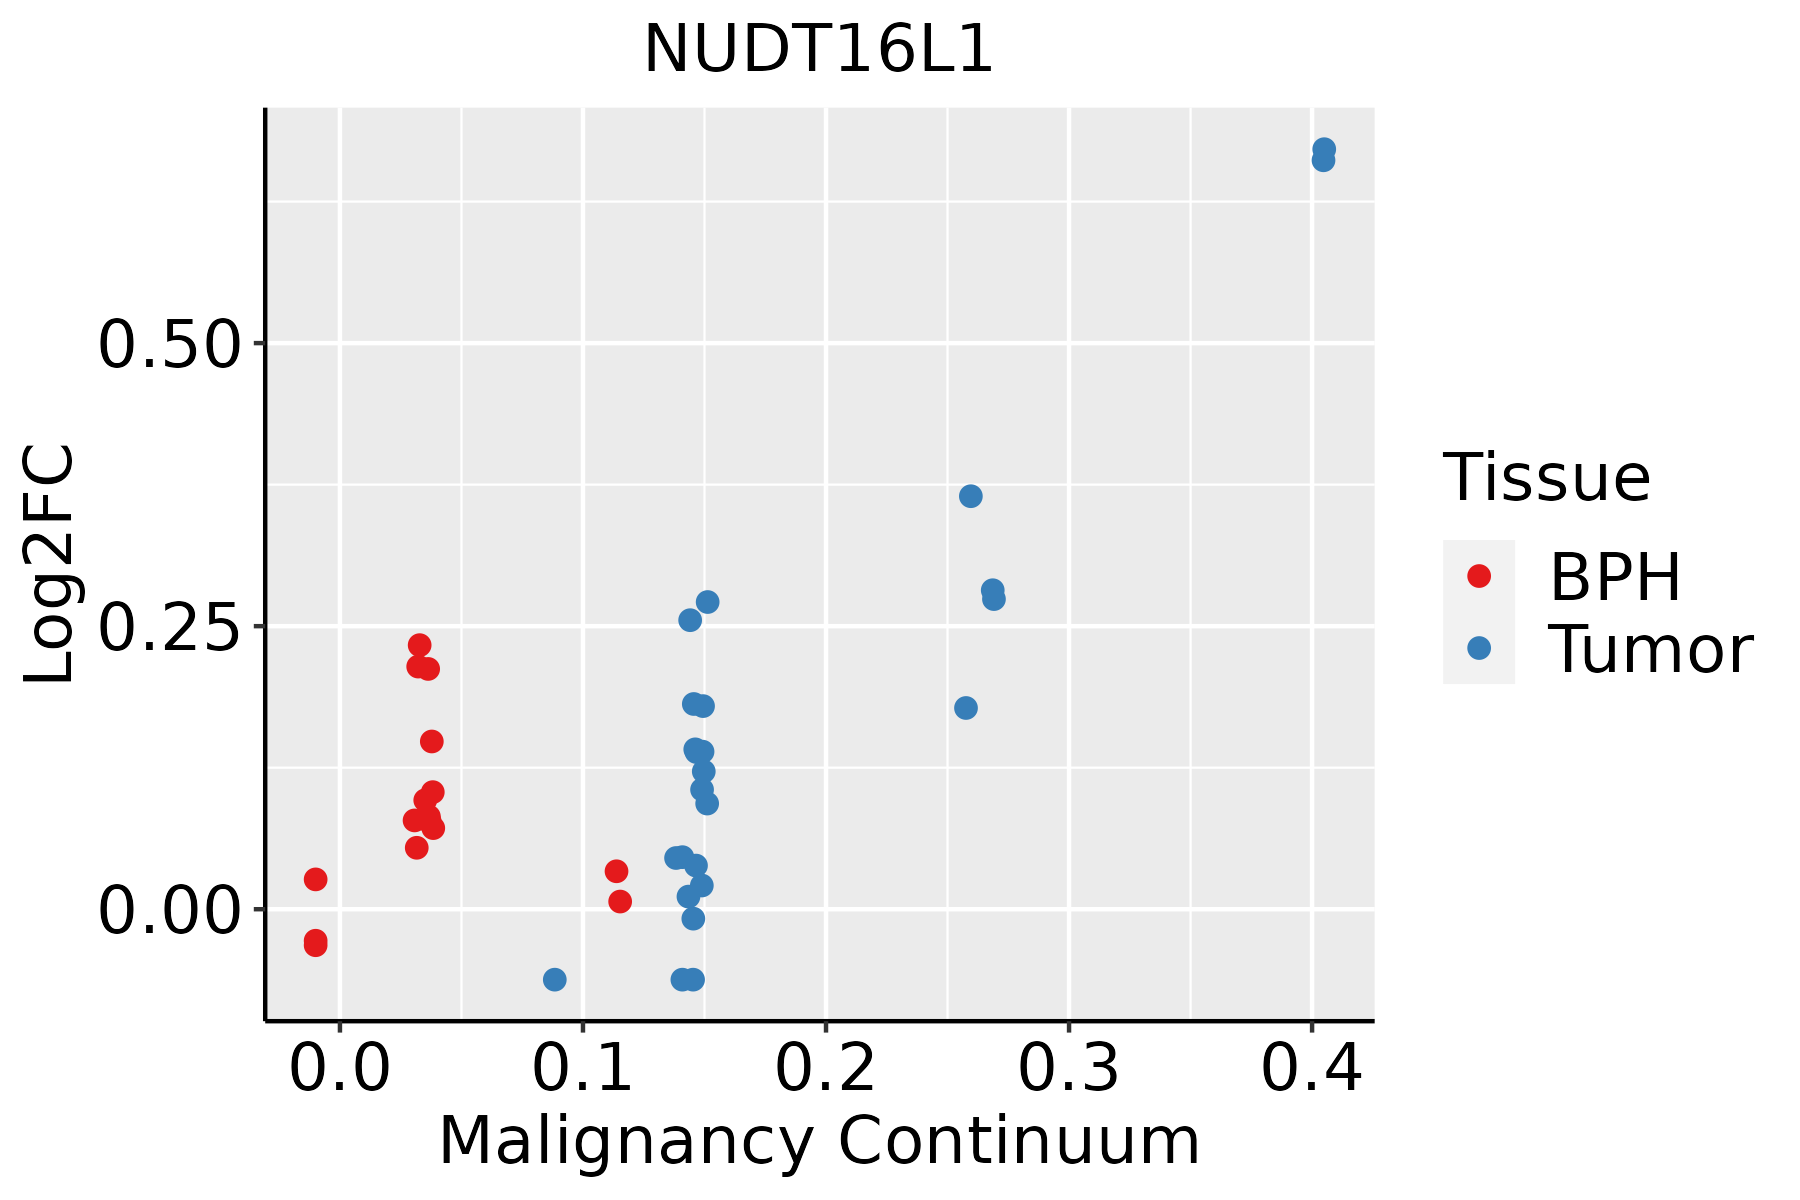 | BPH: Benign Prostatic Hyperplasia |
| Skin |  | AK: Actinic keratosis |
| cSCC: Cutaneous squamous cell carcinoma | ||
| SCCIS:squamous cell carcinoma in situ | ||
| Thyroid | 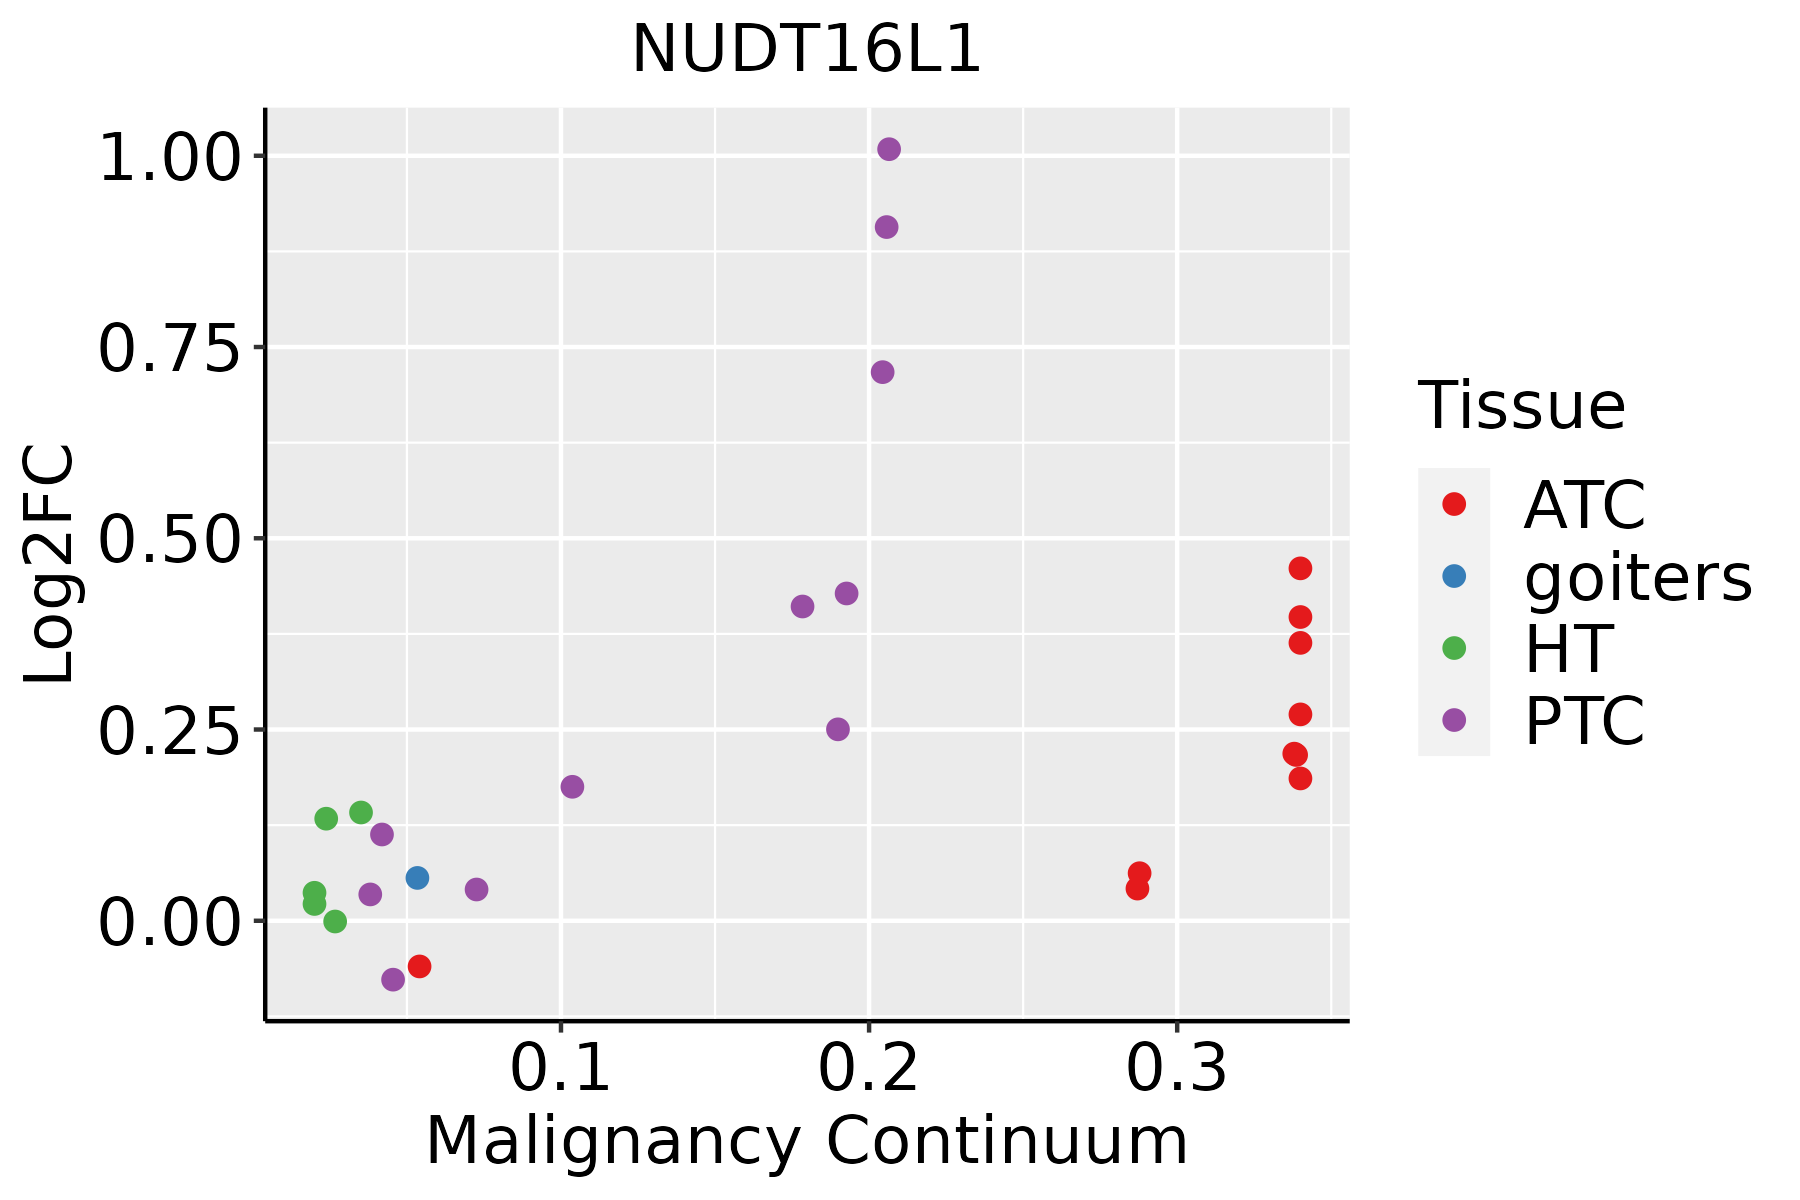 | ATC: Anaplastic thyroid cancer |
| HT: Hashimoto's thyroiditis | ||
| PTC: Papillary thyroid cancer |
| ∗log2FC in expression of this searched gene in stem-like cells from each diseased tissue sample relative to stem-like cells in normal samples in each tissue plotted against the malignancy continuum. Samples are colored based on if they are from different disease stage. |
Top |
Malignant transformation related pathway analysis |
| Find out the enriched GO biological processes and KEGG pathways involved in transition from healthy to precancer to cancer |
| Tissue | Disease Stage | Enriched GO biological Processes |
| Colorectum | AD |  |
| Colorectum | SER |  |
| Colorectum | MSS |  |
| Colorectum | MSI-H |  |
| Colorectum | FAP |  |
| ∗Top 15 enriched GO BP terms are showed in the bar plot of each disease state in each tissue. Each row represents a significant GO biological process which is colored according to the -log10(p.adjust). |
| Page: 1 2 3 4 5 6 7 8 9 |
| GO ID | Tissue | Disease Stage | Description | Gene Ratio | Bg Ratio | pvalue | p.adjust | Count |
| GO:200102013 | Breast | IDC | regulation of response to DNA damage stimulus | 30/1434 | 219/18723 | 1.36e-03 | 1.40e-02 | 30 |
| GO:200102023 | Breast | DCIS | regulation of response to DNA damage stimulus | 30/1390 | 219/18723 | 8.32e-04 | 9.47e-03 | 30 |
| GO:005105214 | Esophagus | HGIN | regulation of DNA metabolic process | 79/2587 | 359/18723 | 1.38e-05 | 3.85e-04 | 79 |
| GO:200102019 | Esophagus | HGIN | regulation of response to DNA damage stimulus | 52/2587 | 219/18723 | 5.00e-05 | 1.19e-03 | 52 |
| GO:20010214 | Esophagus | HGIN | negative regulation of response to DNA damage stimulus | 20/2587 | 81/18723 | 6.16e-03 | 4.92e-02 | 20 |
| GO:005105215 | Esophagus | ESCC | regulation of DNA metabolic process | 232/8552 | 359/18723 | 2.40e-13 | 1.13e-11 | 232 |
| GO:2001020110 | Esophagus | ESCC | regulation of response to DNA damage stimulus | 145/8552 | 219/18723 | 5.97e-10 | 1.50e-08 | 145 |
| GO:00063024 | Esophagus | ESCC | double-strand break repair | 152/8552 | 251/18723 | 1.33e-06 | 1.62e-05 | 152 |
| GO:00062826 | Esophagus | ESCC | regulation of DNA repair | 82/8552 | 130/18723 | 4.65e-05 | 3.66e-04 | 82 |
| GO:200102112 | Esophagus | ESCC | negative regulation of response to DNA damage stimulus | 54/8552 | 81/18723 | 1.09e-04 | 7.64e-04 | 54 |
| GO:0006303 | Esophagus | ESCC | double-strand break repair via nonhomologous end joining | 43/8552 | 66/18723 | 1.10e-03 | 5.53e-03 | 43 |
| GO:20007793 | Esophagus | ESCC | regulation of double-strand break repair | 52/8552 | 85/18723 | 2.86e-03 | 1.21e-02 | 52 |
| GO:200102011 | Liver | Cirrhotic | regulation of response to DNA damage stimulus | 75/4634 | 219/18723 | 9.75e-04 | 6.89e-03 | 75 |
| GO:005105211 | Liver | Cirrhotic | regulation of DNA metabolic process | 114/4634 | 359/18723 | 1.48e-03 | 9.85e-03 | 114 |
| GO:005105221 | Liver | HCC | regulation of DNA metabolic process | 198/7958 | 359/18723 | 7.62e-07 | 1.17e-05 | 198 |
| GO:200102021 | Liver | HCC | regulation of response to DNA damage stimulus | 128/7958 | 219/18723 | 1.31e-06 | 1.90e-05 | 128 |
| GO:00062824 | Liver | HCC | regulation of DNA repair | 74/7958 | 130/18723 | 6.27e-04 | 3.89e-03 | 74 |
| GO:00063021 | Liver | HCC | double-strand break repair | 131/7958 | 251/18723 | 1.17e-03 | 6.54e-03 | 131 |
| GO:2000779 | Liver | HCC | regulation of double-strand break repair | 47/7958 | 85/18723 | 1.17e-02 | 4.28e-02 | 47 |
| GO:005105210 | Oral cavity | OSCC | regulation of DNA metabolic process | 207/7305 | 359/18723 | 4.45e-13 | 2.17e-11 | 207 |
| Page: 1 2 3 |
| Pathway ID | Tissue | Disease Stage | Description | Gene Ratio | Bg Ratio | pvalue | p.adjust | qvalue | Count |
| hsa0520523 | Breast | IDC | Proteoglycans in cancer | 42/867 | 205/8465 | 7.69e-06 | 9.99e-05 | 7.48e-05 | 42 |
| hsa0520533 | Breast | IDC | Proteoglycans in cancer | 42/867 | 205/8465 | 7.69e-06 | 9.99e-05 | 7.48e-05 | 42 |
| hsa0520542 | Breast | DCIS | Proteoglycans in cancer | 39/846 | 205/8465 | 5.36e-05 | 5.58e-04 | 4.11e-04 | 39 |
| hsa0520552 | Breast | DCIS | Proteoglycans in cancer | 39/846 | 205/8465 | 5.36e-05 | 5.58e-04 | 4.11e-04 | 39 |
| hsa0520528 | Esophagus | HGIN | Proteoglycans in cancer | 47/1383 | 205/8465 | 8.23e-03 | 4.71e-02 | 3.74e-02 | 47 |
| hsa05205112 | Esophagus | HGIN | Proteoglycans in cancer | 47/1383 | 205/8465 | 8.23e-03 | 4.71e-02 | 3.74e-02 | 47 |
| hsa0520529 | Esophagus | ESCC | Proteoglycans in cancer | 138/4205 | 205/8465 | 1.79e-07 | 1.40e-06 | 7.15e-07 | 138 |
| hsa0520537 | Esophagus | ESCC | Proteoglycans in cancer | 138/4205 | 205/8465 | 1.79e-07 | 1.40e-06 | 7.15e-07 | 138 |
| hsa0520510 | Liver | Cirrhotic | Proteoglycans in cancer | 85/2530 | 205/8465 | 2.37e-04 | 1.58e-03 | 9.75e-04 | 85 |
| hsa0520511 | Liver | Cirrhotic | Proteoglycans in cancer | 85/2530 | 205/8465 | 2.37e-04 | 1.58e-03 | 9.75e-04 | 85 |
| hsa0520521 | Liver | HCC | Proteoglycans in cancer | 121/4020 | 205/8465 | 5.22e-04 | 2.18e-03 | 1.21e-03 | 121 |
| hsa0520531 | Liver | HCC | Proteoglycans in cancer | 121/4020 | 205/8465 | 5.22e-04 | 2.18e-03 | 1.21e-03 | 121 |
| hsa0520526 | Oral cavity | OSCC | Proteoglycans in cancer | 128/3704 | 205/8465 | 4.00e-08 | 3.12e-07 | 1.59e-07 | 128 |
| hsa05205111 | Oral cavity | OSCC | Proteoglycans in cancer | 128/3704 | 205/8465 | 4.00e-08 | 3.12e-07 | 1.59e-07 | 128 |
| hsa0520527 | Oral cavity | LP | Proteoglycans in cancer | 77/2418 | 205/8465 | 3.01e-03 | 1.29e-02 | 8.35e-03 | 77 |
| hsa0520536 | Oral cavity | LP | Proteoglycans in cancer | 77/2418 | 205/8465 | 3.01e-03 | 1.29e-02 | 8.35e-03 | 77 |
| hsa0520520 | Prostate | BPH | Proteoglycans in cancer | 72/1718 | 205/8465 | 4.16e-07 | 4.10e-06 | 2.54e-06 | 72 |
| hsa05205110 | Prostate | BPH | Proteoglycans in cancer | 72/1718 | 205/8465 | 4.16e-07 | 4.10e-06 | 2.54e-06 | 72 |
| hsa0520525 | Prostate | Tumor | Proteoglycans in cancer | 73/1791 | 205/8465 | 1.01e-06 | 9.82e-06 | 6.09e-06 | 73 |
| hsa0520535 | Prostate | Tumor | Proteoglycans in cancer | 73/1791 | 205/8465 | 1.01e-06 | 9.82e-06 | 6.09e-06 | 73 |
| Page: 1 |
Top |
Cell-cell communication analysis |
| Identification of potential cell-cell interactions between two cell types and their ligand-receptor pairs for different disease states |
| Ligand | Receptor | LRpair | Pathway | Tissue | Disease Stage |
| Page: 1 |
Top |
Single-cell gene regulatory network inference analysis |
| Find out the significant the regulons (TFs) and the target genes of each regulon across cell types for different disease states |
| TF | Cell Type | Tissue | Disease Stage | Target Gene | RSS | Regulon Activity |
| ∗The dot plots of a searched regulon are shown for all cell subpopulations in each disease state of each tissue based on the regulon specific score inferred using pySCENIC and by calculating the average expression. |
| Page: 1 |
Top |
Somatic mutation of malignant transformation related genes |
| Annotation of somatic variants for genes involved in malignant transformation |
| Hugo Symbol | Variant Class | Variant Classification | dbSNP RS | HGVSc | HGVSp | HGVSp Short | SWISSPROT | BIOTYPE | SIFT | PolyPhen | Tumor Sample Barcode | Tissue | Histology | Sex | Age | Stage | Therapy Types | Drugs | Outcome |
| NUDT16L1 | SNV | Missense_Mutation | c.568N>A | p.Glu190Lys | p.E190K | Q9BRJ7 | protein_coding | tolerated(0.4) | possibly_damaging(0.817) | TCGA-XX-A89A-01 | Breast | breast invasive carcinoma | Female | >=65 | I/II | Unknown | Unknown | SD | |
| NUDT16L1 | SNV | Missense_Mutation | novel | c.431N>A | p.Arg144Gln | p.R144Q | Q9BRJ7 | protein_coding | deleterious(0) | benign(0.281) | TCGA-A6-2686-01 | Colorectum | colon adenocarcinoma | Female | >=65 | I/II | Unknown | Unknown | SD |
| NUDT16L1 | SNV | Missense_Mutation | rs754068320 | c.496N>A | p.Val166Met | p.V166M | Q9BRJ7 | protein_coding | deleterious(0) | benign(0.066) | TCGA-B5-A11E-01 | Endometrium | uterine corpus endometrioid carcinoma | Female | <65 | I/II | Unknown | Unknown | SD |
| NUDT16L1 | SNV | Missense_Mutation | novel | c.612N>T | p.Glu204Asp | p.E204D | Q9BRJ7 | protein_coding | tolerated_low_confidence(0.29) | benign(0.074) | TCGA-EO-A3B0-01 | Endometrium | uterine corpus endometrioid carcinoma | Female | <65 | III/IV | Unknown | Unknown | SD |
| NUDT16L1 | SNV | Missense_Mutation | novel | c.172G>T | p.Gly58Trp | p.G58W | Q9BRJ7 | protein_coding | deleterious(0) | probably_damaging(0.999) | TCGA-05-4396-01 | Lung | lung adenocarcinoma | Male | >=65 | III/IV | Unknown | Unknown | SD |
| NUDT16L1 | SNV | Missense_Mutation | novel | c.480N>G | p.Phe160Leu | p.F160L | Q9BRJ7 | protein_coding | deleterious(0) | benign(0.007) | TCGA-HD-7229-01 | Oral cavity | head & neck squamous cell carcinoma | Male | <65 | I/II | Chemotherapy | carboplatin | PD |
| NUDT16L1 | SNV | Missense_Mutation | novel | c.83N>A | p.Cys28Tyr | p.C28Y | Q9BRJ7 | protein_coding | deleterious(0) | benign(0.003) | TCGA-XK-AAIW-01 | Prostate | prostate adenocarcinoma | Male | >=65 | 9 | Unknown | Unknown | PD |
| NUDT16L1 | SNV | Missense_Mutation | novel | c.460G>T | p.Val154Phe | p.V154F | Q9BRJ7 | protein_coding | tolerated(0.06) | benign(0.078) | TCGA-VQ-A91S-01 | Stomach | stomach adenocarcinoma | Male | <65 | III/IV | Chemotherapy | fluorouracil | CR |
| NUDT16L1 | SNV | Missense_Mutation | novel | c.437C>A | p.Pro146Gln | p.P146Q | Q9BRJ7 | protein_coding | deleterious(0) | probably_damaging(0.999) | TCGA-EM-A2CJ-01 | Thyroid | thyroid carcinoma | Female | <65 | I/II | Unknown | Unknown | SD |
| Page: 1 |
Top |
Related drugs of malignant transformation related genes |
| Identification of chemicals and drugs interact with genes involved in malignant transfromation |
| (DGIdb 4.0) |
| Entrez ID | Symbol | Category | Interaction Types | Drug Claim Name | Drug Name | PMIDs |
| Page: 1 |

Copyright 2023-Present -The University of Texas Health Science Center at Houston |