
|
|||||
|
 | |
| |
| |
| |
| |
| |
|
Gene: NUDT14 |
Gene summary for NUDT14 |
| Gene information | Species | Human | Gene symbol | NUDT14 | Gene ID | 256281 |
| Gene name | nudix hydrolase 14 | |
| Gene Alias | UGPP | |
| Cytomap | 14q32.33 | |
| Gene Type | protein-coding | GO ID | GO:0006139 | UniProtAcc | B3KXY7 |
Top |
Malignant transformation analysis |
| Identification of the aberrant gene expression in precancerous and cancerous lesions by comparing the gene expression of stem-like cells in diseased tissues with normal stem cells |
| Entrez ID | Symbol | Replicates | Species | Organ | Tissue | Adj P-value | Log2FC | Malignancy |
| 256281 | NUDT14 | LZE2T | Human | Esophagus | ESCC | 1.35e-02 | 5.26e-01 | 0.082 |
| 256281 | NUDT14 | LZE4T | Human | Esophagus | ESCC | 1.87e-19 | 6.85e-01 | 0.0811 |
| 256281 | NUDT14 | LZE5T | Human | Esophagus | ESCC | 4.07e-06 | 9.08e-01 | 0.0514 |
| 256281 | NUDT14 | LZE20T | Human | Esophagus | ESCC | 9.63e-11 | 3.91e-01 | 0.0662 |
| 256281 | NUDT14 | LZE22D1 | Human | Esophagus | HGIN | 5.27e-03 | 3.16e-01 | 0.0595 |
| 256281 | NUDT14 | LZE22T | Human | Esophagus | ESCC | 5.95e-10 | 6.31e-01 | 0.068 |
| 256281 | NUDT14 | LZE24T | Human | Esophagus | ESCC | 2.05e-21 | 5.97e-01 | 0.0596 |
| 256281 | NUDT14 | P1T-E | Human | Esophagus | ESCC | 5.52e-07 | 4.29e-01 | 0.0875 |
| 256281 | NUDT14 | P2T-E | Human | Esophagus | ESCC | 1.39e-20 | 2.57e-01 | 0.1177 |
| 256281 | NUDT14 | P4T-E | Human | Esophagus | ESCC | 1.25e-21 | 4.84e-01 | 0.1323 |
| 256281 | NUDT14 | P5T-E | Human | Esophagus | ESCC | 9.80e-24 | 5.43e-01 | 0.1327 |
| 256281 | NUDT14 | P8T-E | Human | Esophagus | ESCC | 1.85e-32 | 6.03e-01 | 0.0889 |
| 256281 | NUDT14 | P9T-E | Human | Esophagus | ESCC | 2.50e-29 | 8.13e-01 | 0.1131 |
| 256281 | NUDT14 | P10T-E | Human | Esophagus | ESCC | 8.07e-122 | 2.65e+00 | 0.116 |
| 256281 | NUDT14 | P11T-E | Human | Esophagus | ESCC | 2.44e-07 | 4.82e-01 | 0.1426 |
| 256281 | NUDT14 | P12T-E | Human | Esophagus | ESCC | 6.10e-48 | 9.37e-01 | 0.1122 |
| 256281 | NUDT14 | P15T-E | Human | Esophagus | ESCC | 1.05e-59 | 1.34e+00 | 0.1149 |
| 256281 | NUDT14 | P16T-E | Human | Esophagus | ESCC | 3.39e-25 | 3.26e-01 | 0.1153 |
| 256281 | NUDT14 | P17T-E | Human | Esophagus | ESCC | 8.46e-12 | 6.33e-01 | 0.1278 |
| 256281 | NUDT14 | P20T-E | Human | Esophagus | ESCC | 9.63e-27 | 6.51e-01 | 0.1124 |
| Page: 1 2 3 4 5 6 |
| Tissue | Expression Dynamics | Abbreviation |
| Esophagus |  | ESCC: Esophageal squamous cell carcinoma |
| HGIN: High-grade intraepithelial neoplasias | ||
| LGIN: Low-grade intraepithelial neoplasias | ||
| Liver | 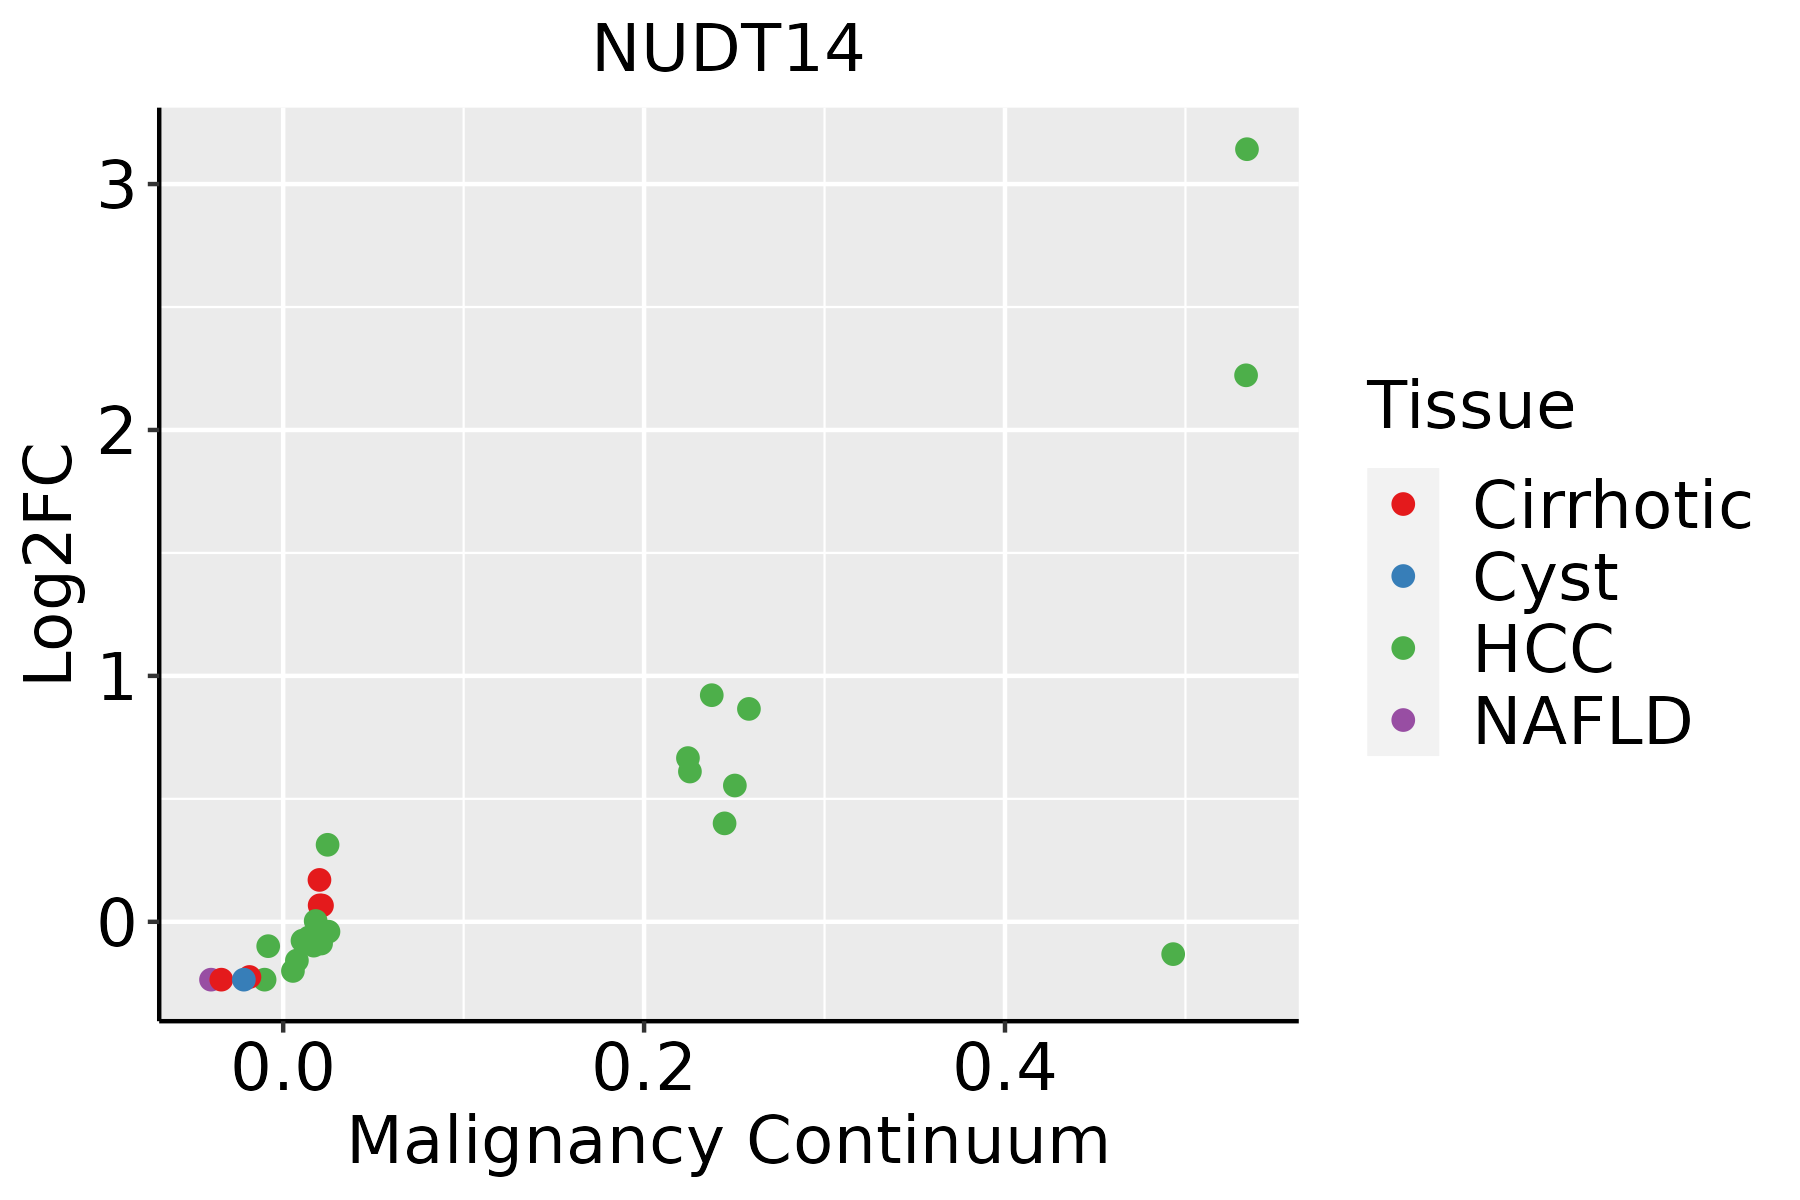 | HCC: Hepatocellular carcinoma |
| NAFLD: Non-alcoholic fatty liver disease | ||
| Oral Cavity | 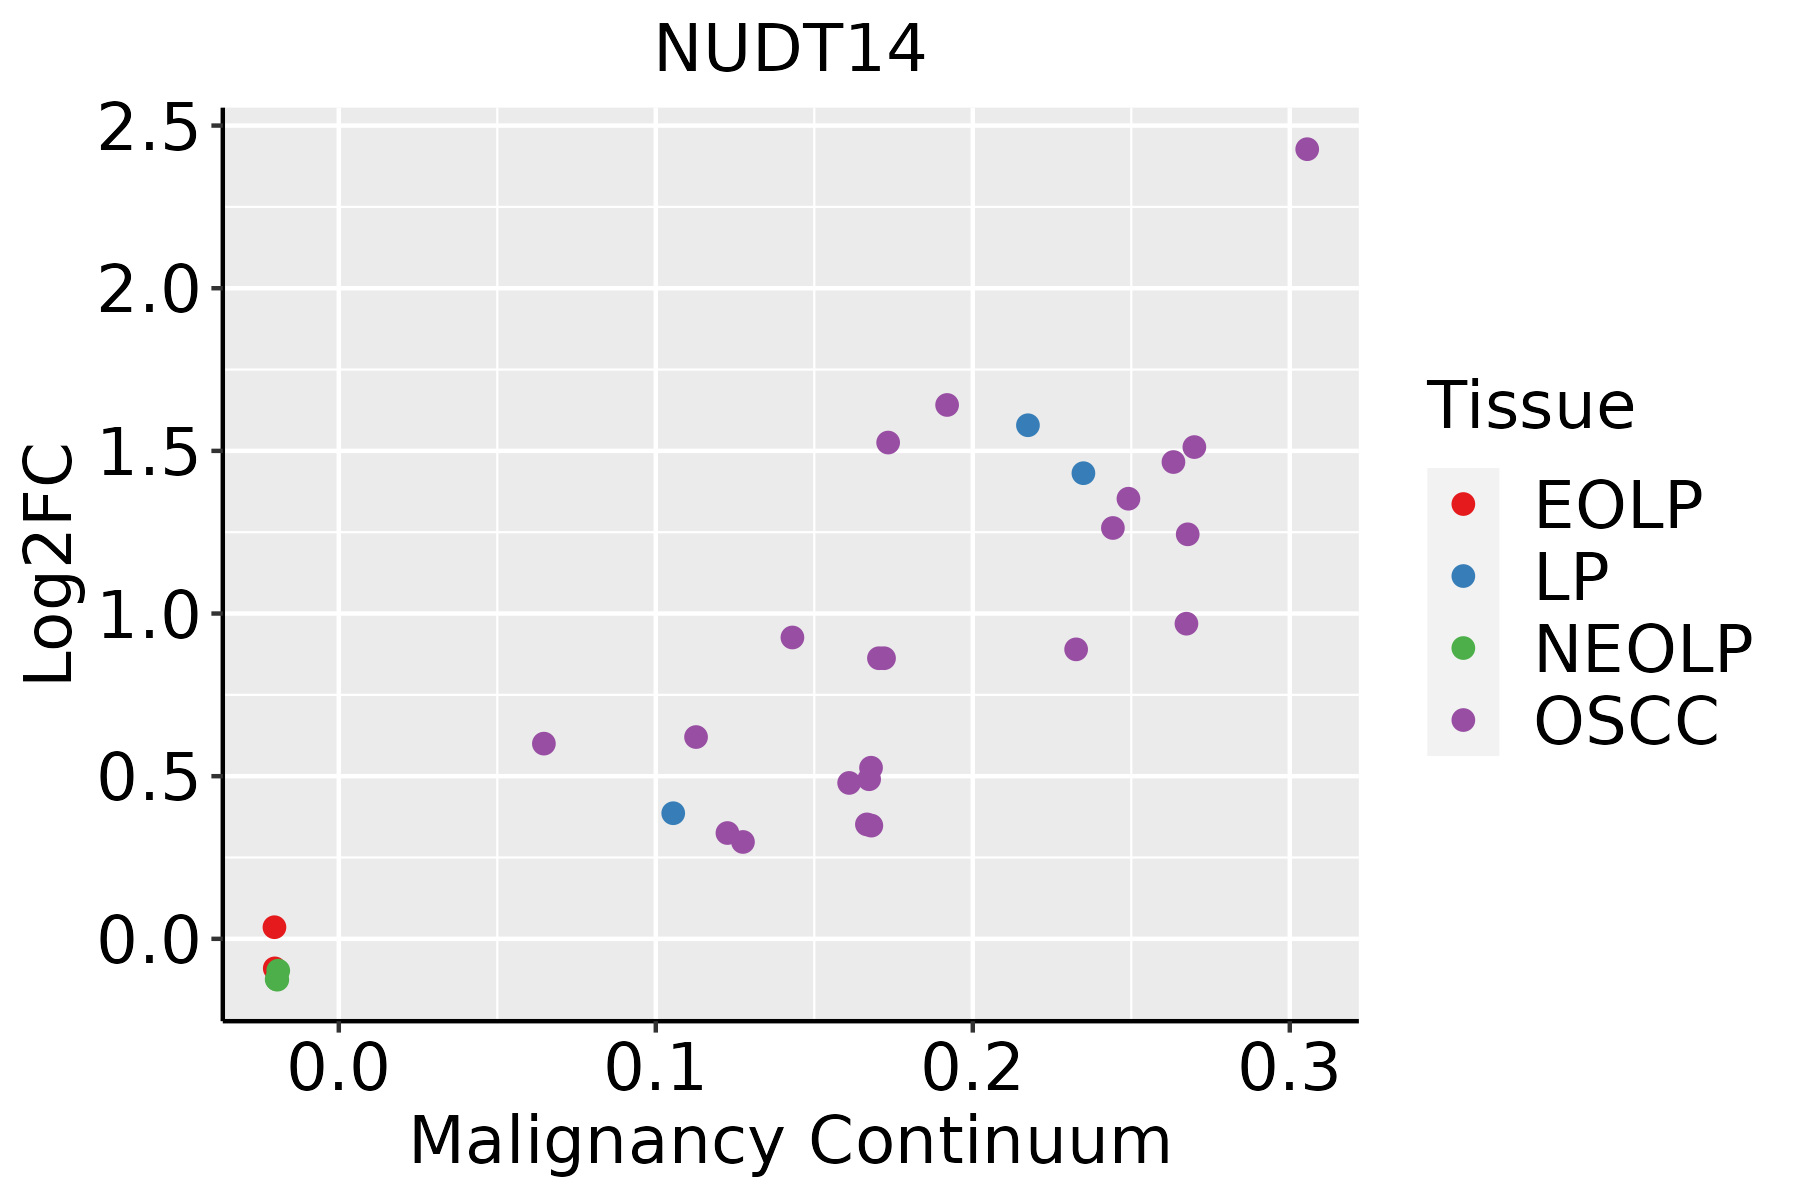 | EOLP: Erosive Oral lichen planus |
| LP: leukoplakia | ||
| NEOLP: Non-erosive oral lichen planus | ||
| OSCC: Oral squamous cell carcinoma | ||
| Skin | 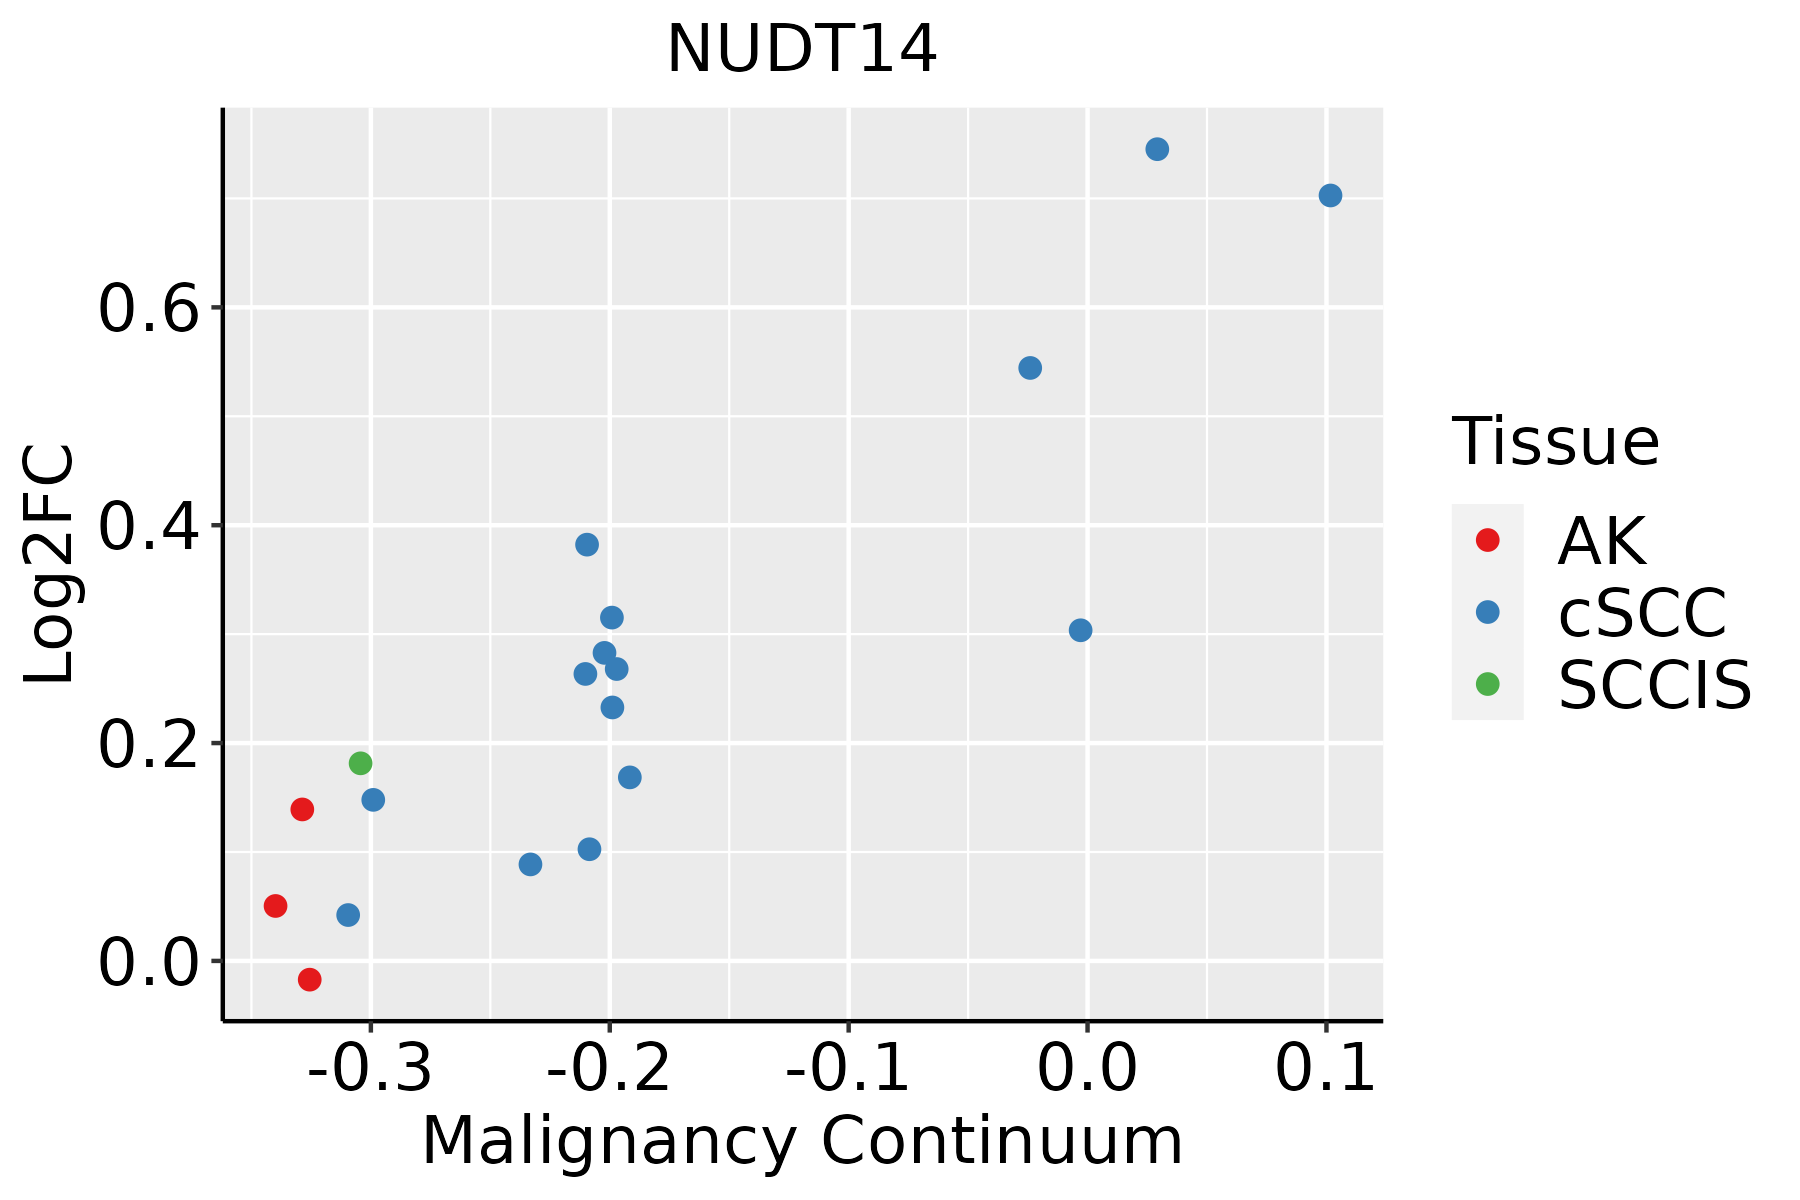 | AK: Actinic keratosis |
| cSCC: Cutaneous squamous cell carcinoma | ||
| SCCIS:squamous cell carcinoma in situ | ||
| Thyroid | 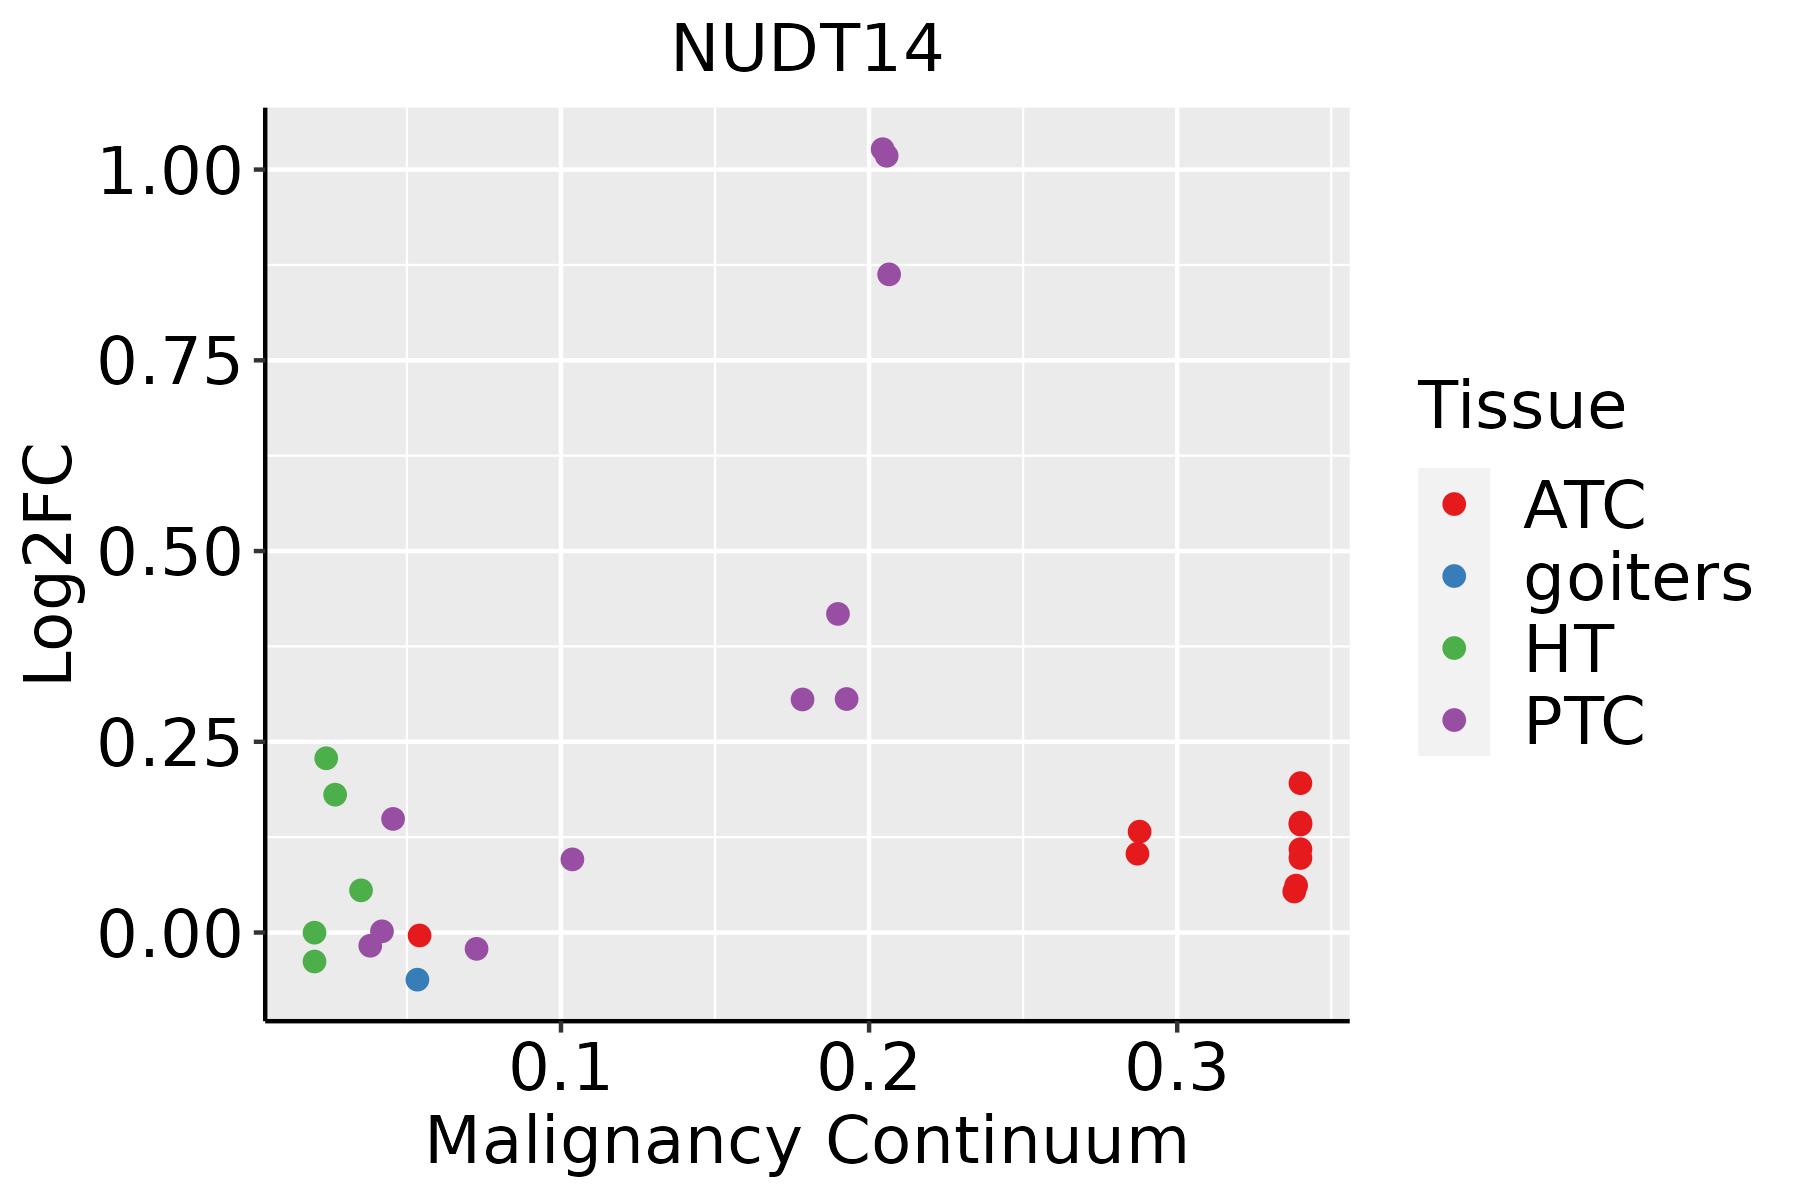 | ATC: Anaplastic thyroid cancer |
| HT: Hashimoto's thyroiditis | ||
| PTC: Papillary thyroid cancer |
| ∗log2FC in expression of this searched gene in stem-like cells from each diseased tissue sample relative to stem-like cells in normal samples in each tissue plotted against the malignancy continuum. Samples are colored based on if they are from different disease stage. |
Top |
Malignant transformation related pathway analysis |
| Find out the enriched GO biological processes and KEGG pathways involved in transition from healthy to precancer to cancer |
| Tissue | Disease Stage | Enriched GO biological Processes |
| Colorectum | AD |  |
| Colorectum | SER |  |
| Colorectum | MSS |  |
| Colorectum | MSI-H |  |
| Colorectum | FAP |  |
| ∗Top 15 enriched GO BP terms are showed in the bar plot of each disease state in each tissue. Each row represents a significant GO biological process which is colored according to the -log10(p.adjust). |
| Page: 1 2 3 4 5 6 7 8 9 |
| GO ID | Tissue | Disease Stage | Description | Gene Ratio | Bg Ratio | pvalue | p.adjust | Count |
| GO:000675320 | Esophagus | HGIN | nucleoside phosphate metabolic process | 93/2587 | 497/18723 | 1.25e-03 | 1.49e-02 | 93 |
| GO:001969320 | Esophagus | HGIN | ribose phosphate metabolic process | 75/2587 | 396/18723 | 2.53e-03 | 2.51e-02 | 75 |
| GO:00064876 | Esophagus | HGIN | protein N-linked glycosylation | 17/2587 | 65/18723 | 6.04e-03 | 4.87e-02 | 17 |
| GO:0006753110 | Esophagus | ESCC | nucleoside phosphate metabolic process | 288/8552 | 497/18723 | 1.80e-08 | 3.50e-07 | 288 |
| GO:0019693111 | Esophagus | ESCC | ribose phosphate metabolic process | 234/8552 | 396/18723 | 4.24e-08 | 7.76e-07 | 234 |
| GO:000648714 | Esophagus | ESCC | protein N-linked glycosylation | 51/8552 | 65/18723 | 6.41e-08 | 1.13e-06 | 51 |
| GO:00091002 | Esophagus | ESCC | glycoprotein metabolic process | 226/8552 | 387/18723 | 2.64e-07 | 3.94e-06 | 226 |
| GO:00181969 | Esophagus | ESCC | peptidyl-asparagine modification | 22/8552 | 24/18723 | 2.82e-06 | 3.21e-05 | 22 |
| GO:00700854 | Esophagus | ESCC | glycosylation | 144/8552 | 240/18723 | 5.12e-06 | 5.38e-05 | 144 |
| GO:00182799 | Esophagus | ESCC | protein N-linked glycosylation via asparagine | 21/8552 | 23/18723 | 5.69e-06 | 5.90e-05 | 21 |
| GO:00064865 | Esophagus | ESCC | protein glycosylation | 135/8552 | 226/18723 | 1.36e-05 | 1.24e-04 | 135 |
| GO:00434135 | Esophagus | ESCC | macromolecule glycosylation | 135/8552 | 226/18723 | 1.36e-05 | 1.24e-04 | 135 |
| GO:00091012 | Esophagus | ESCC | glycoprotein biosynthetic process | 181/8552 | 317/18723 | 2.54e-05 | 2.15e-04 | 181 |
| GO:000675312 | Liver | Cirrhotic | nucleoside phosphate metabolic process | 190/4634 | 497/18723 | 1.10e-11 | 6.96e-10 | 190 |
| GO:001969312 | Liver | Cirrhotic | ribose phosphate metabolic process | 156/4634 | 396/18723 | 5.83e-11 | 3.23e-09 | 156 |
| GO:00182795 | Liver | Cirrhotic | protein N-linked glycosylation via asparagine | 16/4634 | 23/18723 | 7.54e-06 | 1.15e-04 | 16 |
| GO:00181965 | Liver | Cirrhotic | peptidyl-asparagine modification | 16/4634 | 24/18723 | 1.74e-05 | 2.37e-04 | 16 |
| GO:00064873 | Liver | Cirrhotic | protein N-linked glycosylation | 30/4634 | 65/18723 | 1.40e-04 | 1.36e-03 | 30 |
| GO:000675322 | Liver | HCC | nucleoside phosphate metabolic process | 304/7958 | 497/18723 | 1.78e-17 | 1.85e-15 | 304 |
| GO:001969322 | Liver | HCC | ribose phosphate metabolic process | 248/7958 | 396/18723 | 3.15e-16 | 2.70e-14 | 248 |
| Page: 1 2 3 4 |
| Pathway ID | Tissue | Disease Stage | Description | Gene Ratio | Bg Ratio | pvalue | p.adjust | qvalue | Count |
| Page: 1 |
Top |
Cell-cell communication analysis |
| Identification of potential cell-cell interactions between two cell types and their ligand-receptor pairs for different disease states |
| Ligand | Receptor | LRpair | Pathway | Tissue | Disease Stage |
| Page: 1 |
Top |
Single-cell gene regulatory network inference analysis |
| Find out the significant the regulons (TFs) and the target genes of each regulon across cell types for different disease states |
| TF | Cell Type | Tissue | Disease Stage | Target Gene | RSS | Regulon Activity |
| ∗The dot plots of a searched regulon are shown for all cell subpopulations in each disease state of each tissue based on the regulon specific score inferred using pySCENIC and by calculating the average expression. |
| Page: 1 |
Top |
Somatic mutation of malignant transformation related genes |
| Annotation of somatic variants for genes involved in malignant transformation |
| Hugo Symbol | Variant Class | Variant Classification | dbSNP RS | HGVSc | HGVSp | HGVSp Short | SWISSPROT | BIOTYPE | SIFT | PolyPhen | Tumor Sample Barcode | Tissue | Histology | Sex | Age | Stage | Therapy Types | Drugs | Outcome |
| NUDT14 | SNV | Missense_Mutation | rs776403747 | c.214N>T | p.Arg72Cys | p.R72C | O95848 | protein_coding | deleterious(0) | benign(0.012) | TCGA-AO-A128-01 | Breast | breast invasive carcinoma | Female | <65 | I/II | Chemotherapy | doxorubicin | SD |
| NUDT14 | SNV | Missense_Mutation | rs141847132 | c.283N>A | p.Gly95Ser | p.G95S | O95848 | protein_coding | deleterious(0.02) | benign(0.392) | TCGA-DS-A0VN-01 | Cervix | cervical & endocervical cancer | Female | <65 | I/II | Chemotherapy | cisplatin | SD |
| NUDT14 | SNV | Missense_Mutation | rs754096722 | c.418N>A | p.Ala140Thr | p.A140T | O95848 | protein_coding | tolerated(1) | benign(0.003) | TCGA-EA-A410-01 | Cervix | cervical & endocervical cancer | Female | <65 | I/II | Unknown | Unknown | SD |
| NUDT14 | SNV | Missense_Mutation | rs368844988 | c.610N>A | p.Val204Ile | p.V204I | O95848 | protein_coding | tolerated(0.05) | probably_damaging(0.995) | TCGA-AA-A00N-01 | Colorectum | colon adenocarcinoma | Male | >=65 | I/II | Unknown | Unknown | PD |
| NUDT14 | SNV | Missense_Mutation | c.578N>T | p.Ala193Val | p.A193V | O95848 | protein_coding | tolerated(0.3) | benign(0.019) | TCGA-AD-A5EJ-01 | Colorectum | colon adenocarcinoma | Female | >=65 | I/II | Unknown | Unknown | SD | |
| NUDT14 | SNV | Missense_Mutation | c.199N>A | p.Ala67Thr | p.A67T | O95848 | protein_coding | tolerated(0.38) | possibly_damaging(0.657) | TCGA-D5-6928-01 | Colorectum | colon adenocarcinoma | Male | >=65 | I/II | Unknown | Unknown | SD | |
| NUDT14 | SNV | Missense_Mutation | rs776403747 | c.214N>T | p.Arg72Cys | p.R72C | O95848 | protein_coding | deleterious(0) | benign(0.012) | TCGA-AP-A05O-01 | Endometrium | uterine corpus endometrioid carcinoma | Female | >=65 | I/II | Chemotherapy | carboplatin | PD |
| NUDT14 | SNV | Missense_Mutation | rs767168556 | c.607N>A | p.Gly203Ser | p.G203S | O95848 | protein_coding | tolerated(0.12) | possibly_damaging(0.45) | TCGA-AP-A0LM-01 | Endometrium | uterine corpus endometrioid carcinoma | Female | <65 | III/IV | Chemotherapy | cisplatin | SD |
| NUDT14 | SNV | Missense_Mutation | rs776403747 | c.214N>T | p.Arg72Cys | p.R72C | O95848 | protein_coding | deleterious(0) | benign(0.012) | TCGA-AX-A06H-01 | Endometrium | uterine corpus endometrioid carcinoma | Female | <65 | III/IV | Chemotherapy | paclitaxel | SD |
| NUDT14 | SNV | Missense_Mutation | rs141847132 | c.283N>A | p.Gly95Ser | p.G95S | O95848 | protein_coding | deleterious(0.02) | benign(0.392) | TCGA-FI-A2D0-01 | Endometrium | uterine corpus endometrioid carcinoma | Female | <65 | I/II | Unknown | Unknown | SD |
| Page: 1 2 |
Top |
Related drugs of malignant transformation related genes |
| Identification of chemicals and drugs interact with genes involved in malignant transfromation |
| (DGIdb 4.0) |
| Entrez ID | Symbol | Category | Interaction Types | Drug Claim Name | Drug Name | PMIDs |
| Page: 1 |

Copyright 2023-Present -The University of Texas Health Science Center at Houston |