
|
|||||
|
 | |
| |
| |
| |
| |
| |
|
Gene: NUDT11 |
Gene summary for NUDT11 |
| Gene information | Species | Human | Gene symbol | NUDT11 | Gene ID | 55190 |
| Gene name | nudix hydrolase 11 | |
| Gene Alias | APS1 | |
| Cytomap | Xp11.22 | |
| Gene Type | protein-coding | GO ID | GO:0006066 | UniProtAcc | Q96G61 |
Top |
Malignant transformation analysis |
| Identification of the aberrant gene expression in precancerous and cancerous lesions by comparing the gene expression of stem-like cells in diseased tissues with normal stem cells |
| Entrez ID | Symbol | Replicates | Species | Organ | Tissue | Adj P-value | Log2FC | Malignancy |
| 55190 | NUDT11 | LZE4T | Human | Esophagus | ESCC | 1.14e-02 | 1.09e-01 | 0.0811 |
| 55190 | NUDT11 | LZE7T | Human | Esophagus | ESCC | 8.21e-03 | 1.05e-01 | 0.0667 |
| 55190 | NUDT11 | P2T-E | Human | Esophagus | ESCC | 2.68e-26 | 5.24e-01 | 0.1177 |
| 55190 | NUDT11 | P4T-E | Human | Esophagus | ESCC | 3.73e-11 | 1.88e-01 | 0.1323 |
| 55190 | NUDT11 | P5T-E | Human | Esophagus | ESCC | 5.77e-18 | 4.11e-01 | 0.1327 |
| 55190 | NUDT11 | P9T-E | Human | Esophagus | ESCC | 3.24e-04 | 1.49e-01 | 0.1131 |
| 55190 | NUDT11 | P10T-E | Human | Esophagus | ESCC | 1.50e-14 | 2.00e-01 | 0.116 |
| 55190 | NUDT11 | P12T-E | Human | Esophagus | ESCC | 1.92e-04 | 9.19e-02 | 0.1122 |
| 55190 | NUDT11 | P16T-E | Human | Esophagus | ESCC | 2.05e-17 | 3.68e-01 | 0.1153 |
| 55190 | NUDT11 | P17T-E | Human | Esophagus | ESCC | 4.08e-04 | 1.69e-01 | 0.1278 |
| 55190 | NUDT11 | P20T-E | Human | Esophagus | ESCC | 8.31e-15 | 2.99e-01 | 0.1124 |
| 55190 | NUDT11 | P22T-E | Human | Esophagus | ESCC | 2.47e-19 | 2.68e-01 | 0.1236 |
| 55190 | NUDT11 | P23T-E | Human | Esophagus | ESCC | 1.90e-08 | 2.57e-01 | 0.108 |
| 55190 | NUDT11 | P24T-E | Human | Esophagus | ESCC | 2.24e-08 | 5.92e-02 | 0.1287 |
| 55190 | NUDT11 | P26T-E | Human | Esophagus | ESCC | 6.19e-44 | 8.00e-01 | 0.1276 |
| 55190 | NUDT11 | P27T-E | Human | Esophagus | ESCC | 2.87e-02 | 8.31e-02 | 0.1055 |
| 55190 | NUDT11 | P28T-E | Human | Esophagus | ESCC | 3.14e-14 | 1.78e-01 | 0.1149 |
| 55190 | NUDT11 | P30T-E | Human | Esophagus | ESCC | 2.18e-21 | 7.02e-01 | 0.137 |
| 55190 | NUDT11 | P32T-E | Human | Esophagus | ESCC | 4.02e-13 | 2.88e-01 | 0.1666 |
| 55190 | NUDT11 | P36T-E | Human | Esophagus | ESCC | 8.31e-22 | 5.65e-01 | 0.1187 |
| Page: 1 2 3 |
| Tissue | Expression Dynamics | Abbreviation |
| Esophagus |  | ESCC: Esophageal squamous cell carcinoma |
| HGIN: High-grade intraepithelial neoplasias | ||
| LGIN: Low-grade intraepithelial neoplasias | ||
| Oral Cavity | 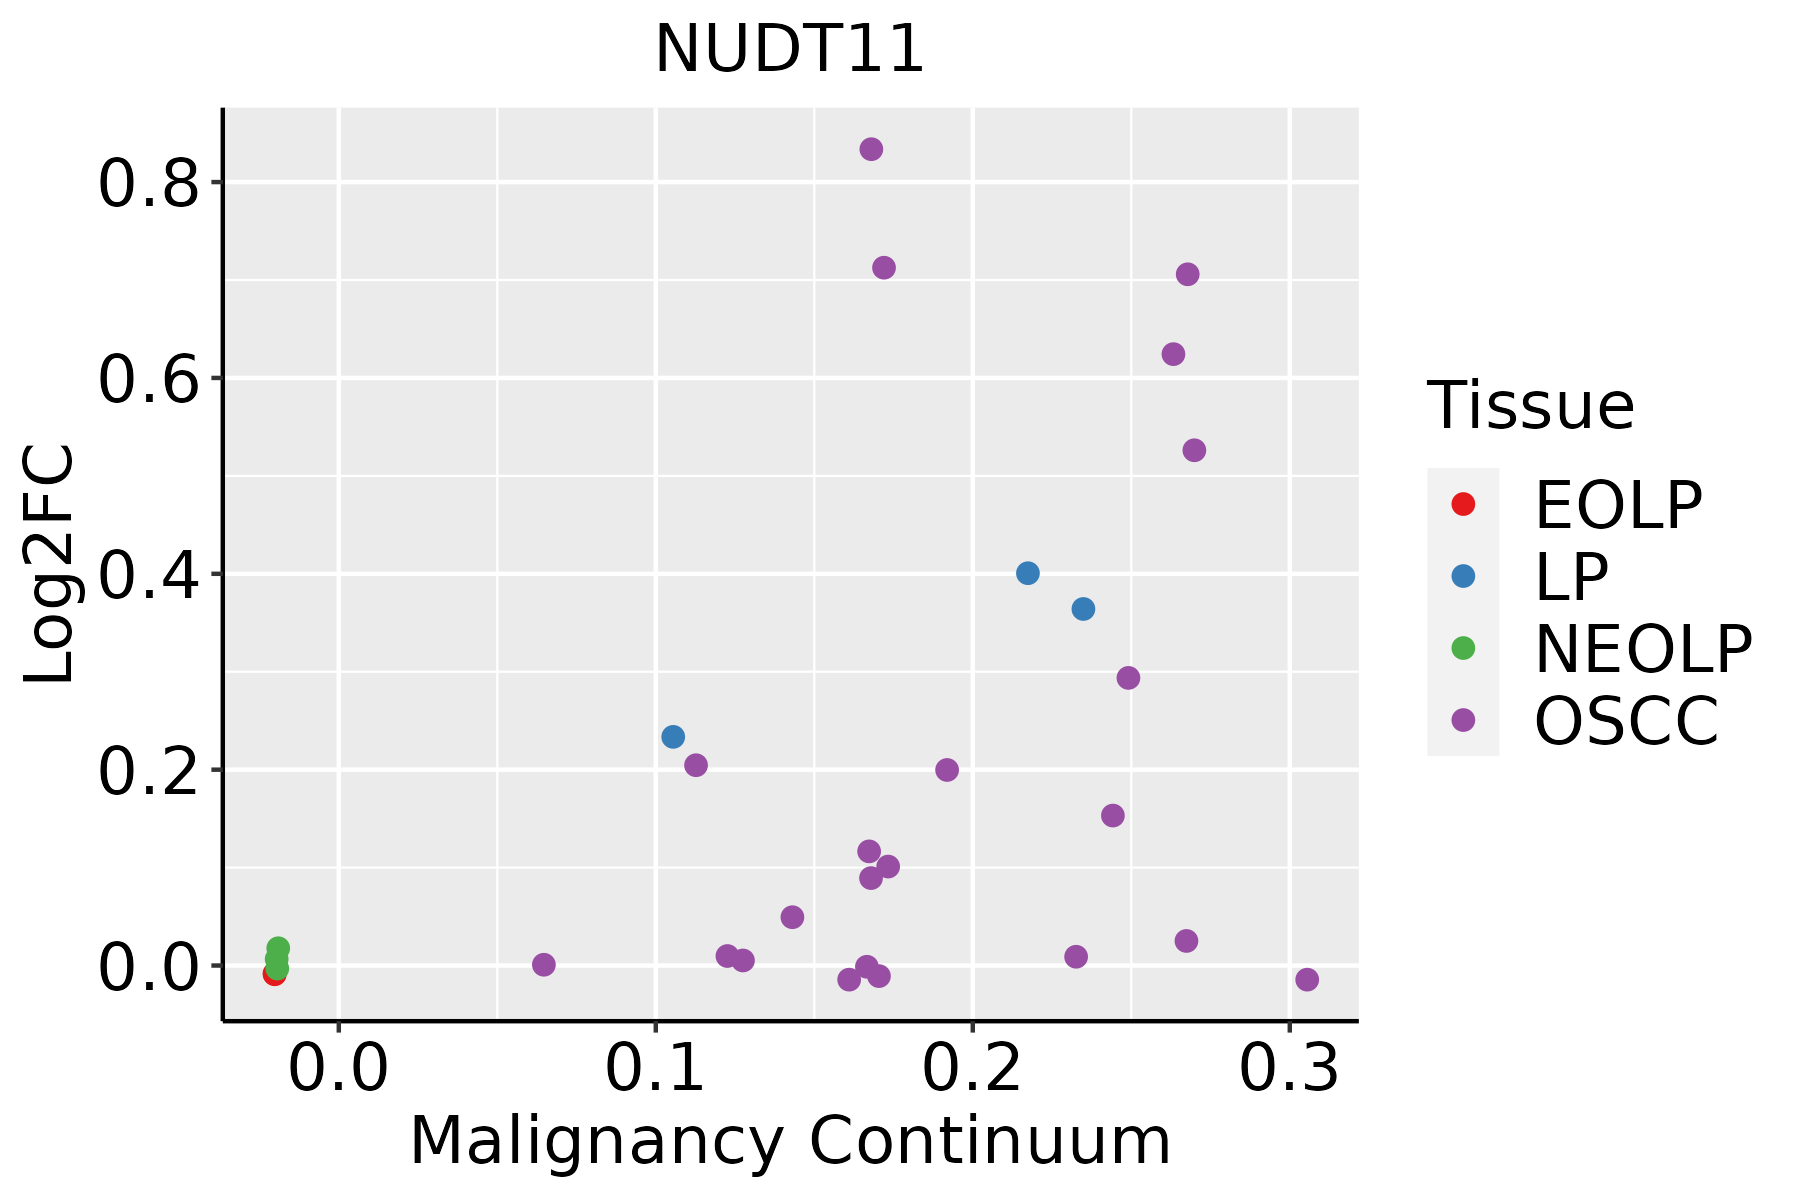 | EOLP: Erosive Oral lichen planus |
| LP: leukoplakia | ||
| NEOLP: Non-erosive oral lichen planus | ||
| OSCC: Oral squamous cell carcinoma |
| ∗log2FC in expression of this searched gene in stem-like cells from each diseased tissue sample relative to stem-like cells in normal samples in each tissue plotted against the malignancy continuum. Samples are colored based on if they are from different disease stage. |
Top |
Malignant transformation related pathway analysis |
| Find out the enriched GO biological processes and KEGG pathways involved in transition from healthy to precancer to cancer |
| Tissue | Disease Stage | Enriched GO biological Processes |
| Colorectum | AD |  |
| Colorectum | SER |  |
| Colorectum | MSS |  |
| Colorectum | MSI-H |  |
| Colorectum | FAP |  |
| ∗Top 15 enriched GO BP terms are showed in the bar plot of each disease state in each tissue. Each row represents a significant GO biological process which is colored according to the -log10(p.adjust). |
| Page: 1 2 3 4 5 6 7 8 9 |
| GO ID | Tissue | Disease Stage | Description | Gene Ratio | Bg Ratio | pvalue | p.adjust | Count |
| GO:0034655110 | Esophagus | ESCC | nucleobase-containing compound catabolic process | 272/8552 | 407/18723 | 2.92e-18 | 2.90e-16 | 272 |
| GO:004670018 | Esophagus | ESCC | heterocycle catabolic process | 286/8552 | 445/18723 | 1.12e-15 | 7.47e-14 | 286 |
| GO:004427019 | Esophagus | ESCC | cellular nitrogen compound catabolic process | 288/8552 | 451/18723 | 3.03e-15 | 1.79e-13 | 288 |
| GO:001943918 | Esophagus | ESCC | aromatic compound catabolic process | 295/8552 | 467/18723 | 1.09e-14 | 5.98e-13 | 295 |
| GO:190136118 | Esophagus | ESCC | organic cyclic compound catabolic process | 307/8552 | 495/18723 | 9.99e-14 | 4.80e-12 | 307 |
| GO:0006753110 | Esophagus | ESCC | nucleoside phosphate metabolic process | 288/8552 | 497/18723 | 1.80e-08 | 3.50e-07 | 288 |
| GO:0019693111 | Esophagus | ESCC | ribose phosphate metabolic process | 234/8552 | 396/18723 | 4.24e-08 | 7.76e-07 | 234 |
| GO:0009117111 | Esophagus | ESCC | nucleotide metabolic process | 282/8552 | 489/18723 | 4.70e-08 | 8.50e-07 | 282 |
| GO:0009259111 | Esophagus | ESCC | ribonucleotide metabolic process | 224/8552 | 385/18723 | 4.41e-07 | 6.00e-06 | 224 |
| GO:0072521111 | Esophagus | ESCC | purine-containing compound metabolic process | 238/8552 | 416/18723 | 1.20e-06 | 1.49e-05 | 238 |
| GO:0009150111 | Esophagus | ESCC | purine ribonucleotide metabolic process | 213/8552 | 368/18723 | 1.40e-06 | 1.69e-05 | 213 |
| GO:0006163111 | Esophagus | ESCC | purine nucleotide metabolic process | 226/8552 | 396/18723 | 2.81e-06 | 3.21e-05 | 226 |
| GO:00060668 | Esophagus | ESCC | alcohol metabolic process | 202/8552 | 353/18723 | 7.32e-06 | 7.26e-05 | 202 |
| GO:19011362 | Esophagus | ESCC | carbohydrate derivative catabolic process | 99/8552 | 172/18723 | 1.11e-03 | 5.54e-03 | 99 |
| GO:003465517 | Oral cavity | OSCC | nucleobase-containing compound catabolic process | 244/7305 | 407/18723 | 5.38e-18 | 5.49e-16 | 244 |
| GO:004670015 | Oral cavity | OSCC | heterocycle catabolic process | 254/7305 | 445/18723 | 5.07e-15 | 3.31e-13 | 254 |
| GO:004427016 | Oral cavity | OSCC | cellular nitrogen compound catabolic process | 256/7305 | 451/18723 | 9.67e-15 | 5.88e-13 | 256 |
| GO:001943915 | Oral cavity | OSCC | aromatic compound catabolic process | 263/7305 | 467/18723 | 1.49e-14 | 8.84e-13 | 263 |
| GO:190136115 | Oral cavity | OSCC | organic cyclic compound catabolic process | 272/7305 | 495/18723 | 2.73e-13 | 1.36e-11 | 272 |
| GO:000675318 | Oral cavity | OSCC | nucleoside phosphate metabolic process | 247/7305 | 497/18723 | 6.28e-07 | 8.96e-06 | 247 |
| Page: 1 2 |
| Pathway ID | Tissue | Disease Stage | Description | Gene Ratio | Bg Ratio | pvalue | p.adjust | qvalue | Count |
| Page: 1 |
Top |
Cell-cell communication analysis |
| Identification of potential cell-cell interactions between two cell types and their ligand-receptor pairs for different disease states |
| Ligand | Receptor | LRpair | Pathway | Tissue | Disease Stage |
| Page: 1 |
Top |
Single-cell gene regulatory network inference analysis |
| Find out the significant the regulons (TFs) and the target genes of each regulon across cell types for different disease states |
| TF | Cell Type | Tissue | Disease Stage | Target Gene | RSS | Regulon Activity |
| ∗The dot plots of a searched regulon are shown for all cell subpopulations in each disease state of each tissue based on the regulon specific score inferred using pySCENIC and by calculating the average expression. |
| Page: 1 |
Top |
Somatic mutation of malignant transformation related genes |
| Annotation of somatic variants for genes involved in malignant transformation |
| Hugo Symbol | Variant Class | Variant Classification | dbSNP RS | HGVSc | HGVSp | HGVSp Short | SWISSPROT | BIOTYPE | SIFT | PolyPhen | Tumor Sample Barcode | Tissue | Histology | Sex | Age | Stage | Therapy Types | Drugs | Outcome |
| NUDT11 | SNV | Missense_Mutation | c.490N>A | p.Pro164Thr | p.P164T | Q96G61 | protein_coding | deleterious_low_confidence(0) | benign(0) | TCGA-A2-A04T-01 | Breast | breast invasive carcinoma | Female | <65 | I/II | Chemotherapy | cyclophosphamide | SD | |
| NUDT11 | SNV | Missense_Mutation | novel | c.62N>T | p.Ala21Val | p.A21V | Q96G61 | protein_coding | deleterious(0.02) | probably_damaging(0.928) | TCGA-VS-A9UJ-01 | Cervix | cervical & endocervical cancer | Female | <65 | I/II | Unknown | Unknown | PD |
| NUDT11 | SNV | Missense_Mutation | novel | c.79N>G | p.Ser27Gly | p.S27G | Q96G61 | protein_coding | tolerated(0.17) | benign(0.003) | TCGA-5M-AAT6-01 | Colorectum | colon adenocarcinoma | Female | <65 | III/IV | Unknown | Unknown | PD |
| NUDT11 | SNV | Missense_Mutation | novel | c.51N>T | p.Lys17Asn | p.K17N | Q96G61 | protein_coding | deleterious(0.01) | possibly_damaging(0.707) | TCGA-AA-A00N-01 | Colorectum | colon adenocarcinoma | Male | >=65 | I/II | Unknown | Unknown | PD |
| NUDT11 | SNV | Missense_Mutation | c.156N>T | p.Met52Ile | p.M52I | Q96G61 | protein_coding | tolerated(0.32) | benign(0.014) | TCGA-G4-6309-01 | Colorectum | colon adenocarcinoma | Female | <65 | III/IV | Chemotherapy | xeloda | PD | |
| NUDT11 | SNV | Missense_Mutation | c.286N>C | p.Tyr96His | p.Y96H | Q96G61 | protein_coding | deleterious(0.03) | probably_damaging(0.993) | TCGA-F5-6814-01 | Colorectum | rectum adenocarcinoma | Male | <65 | I/II | Unknown | Unknown | SD | |
| NUDT11 | SNV | Missense_Mutation | novel | c.233G>A | p.Arg78Gln | p.R78Q | Q96G61 | protein_coding | deleterious(0) | probably_damaging(0.966) | TCGA-AJ-A2QO-01 | Endometrium | uterine corpus endometrioid carcinoma | Female | >=65 | I/II | Unknown | Unknown | SD |
| NUDT11 | SNV | Missense_Mutation | novel | c.281N>G | p.Tyr94Cys | p.Y94C | Q96G61 | protein_coding | tolerated(0.12) | benign(0.071) | TCGA-AJ-A3EL-01 | Endometrium | uterine corpus endometrioid carcinoma | Female | <65 | I/II | Unknown | Unknown | SD |
| NUDT11 | SNV | Missense_Mutation | rs782555414 | c.329N>T | p.Ser110Leu | p.S110L | Q96G61 | protein_coding | deleterious(0.04) | benign(0.163) | TCGA-AP-A056-01 | Endometrium | uterine corpus endometrioid carcinoma | Female | <65 | I/II | Unknown | Unknown | SD |
| NUDT11 | SNV | Missense_Mutation | c.459N>A | p.Asn153Lys | p.N153K | Q96G61 | protein_coding | tolerated(0.14) | benign(0.18) | TCGA-AP-A059-01 | Endometrium | uterine corpus endometrioid carcinoma | Female | >=65 | I/II | Unknown | Unknown | SD |
| Page: 1 2 3 |
Top |
Related drugs of malignant transformation related genes |
| Identification of chemicals and drugs interact with genes involved in malignant transfromation |
| (DGIdb 4.0) |
| Entrez ID | Symbol | Category | Interaction Types | Drug Claim Name | Drug Name | PMIDs |
| Page: 1 |

Copyright 2023-Present -The University of Texas Health Science Center at Houston |