
|
|||||
|
 | |
| |
| |
| |
| |
| |
|
Gene: NUDCD3 |
Gene summary for NUDCD3 |
| Gene information | Species | Human | Gene symbol | NUDCD3 | Gene ID | 23386 |
| Gene name | NudC domain containing 3 | |
| Gene Alias | NudCL | |
| Cytomap | 7p13 | |
| Gene Type | protein-coding | GO ID | GO:0006457 | UniProtAcc | Q8IVD9 |
Top |
Malignant transformation analysis |
| Identification of the aberrant gene expression in precancerous and cancerous lesions by comparing the gene expression of stem-like cells in diseased tissues with normal stem cells |
| Entrez ID | Symbol | Replicates | Species | Organ | Tissue | Adj P-value | Log2FC | Malignancy |
| 23386 | NUDCD3 | LZE4T | Human | Esophagus | ESCC | 4.42e-16 | 3.02e-01 | 0.0811 |
| 23386 | NUDCD3 | LZE5T | Human | Esophagus | ESCC | 2.70e-05 | 2.93e-01 | 0.0514 |
| 23386 | NUDCD3 | LZE7T | Human | Esophagus | ESCC | 9.27e-09 | 3.46e-01 | 0.0667 |
| 23386 | NUDCD3 | LZE8T | Human | Esophagus | ESCC | 5.61e-03 | 9.78e-02 | 0.067 |
| 23386 | NUDCD3 | LZE20T | Human | Esophagus | ESCC | 2.14e-04 | 1.17e-01 | 0.0662 |
| 23386 | NUDCD3 | LZE22T | Human | Esophagus | ESCC | 4.45e-04 | 2.11e-01 | 0.068 |
| 23386 | NUDCD3 | LZE24T | Human | Esophagus | ESCC | 1.49e-12 | 3.34e-01 | 0.0596 |
| 23386 | NUDCD3 | P1T-E | Human | Esophagus | ESCC | 4.07e-12 | 5.45e-01 | 0.0875 |
| 23386 | NUDCD3 | P2T-E | Human | Esophagus | ESCC | 2.23e-29 | 4.34e-01 | 0.1177 |
| 23386 | NUDCD3 | P4T-E | Human | Esophagus | ESCC | 1.32e-15 | 3.90e-01 | 0.1323 |
| 23386 | NUDCD3 | P5T-E | Human | Esophagus | ESCC | 1.00e-05 | 9.63e-02 | 0.1327 |
| 23386 | NUDCD3 | P8T-E | Human | Esophagus | ESCC | 4.03e-21 | 3.32e-01 | 0.0889 |
| 23386 | NUDCD3 | P9T-E | Human | Esophagus | ESCC | 9.55e-12 | 2.09e-01 | 0.1131 |
| 23386 | NUDCD3 | P10T-E | Human | Esophagus | ESCC | 3.64e-22 | 3.60e-01 | 0.116 |
| 23386 | NUDCD3 | P11T-E | Human | Esophagus | ESCC | 2.71e-20 | 7.48e-01 | 0.1426 |
| 23386 | NUDCD3 | P12T-E | Human | Esophagus | ESCC | 4.27e-24 | 3.98e-01 | 0.1122 |
| 23386 | NUDCD3 | P15T-E | Human | Esophagus | ESCC | 4.60e-25 | 5.01e-01 | 0.1149 |
| 23386 | NUDCD3 | P16T-E | Human | Esophagus | ESCC | 6.29e-25 | 4.88e-01 | 0.1153 |
| 23386 | NUDCD3 | P17T-E | Human | Esophagus | ESCC | 1.18e-07 | 4.27e-01 | 0.1278 |
| 23386 | NUDCD3 | P19T-E | Human | Esophagus | ESCC | 2.48e-10 | 4.76e-01 | 0.1662 |
| Page: 1 2 3 4 5 6 |
| Tissue | Expression Dynamics | Abbreviation |
| Esophagus | 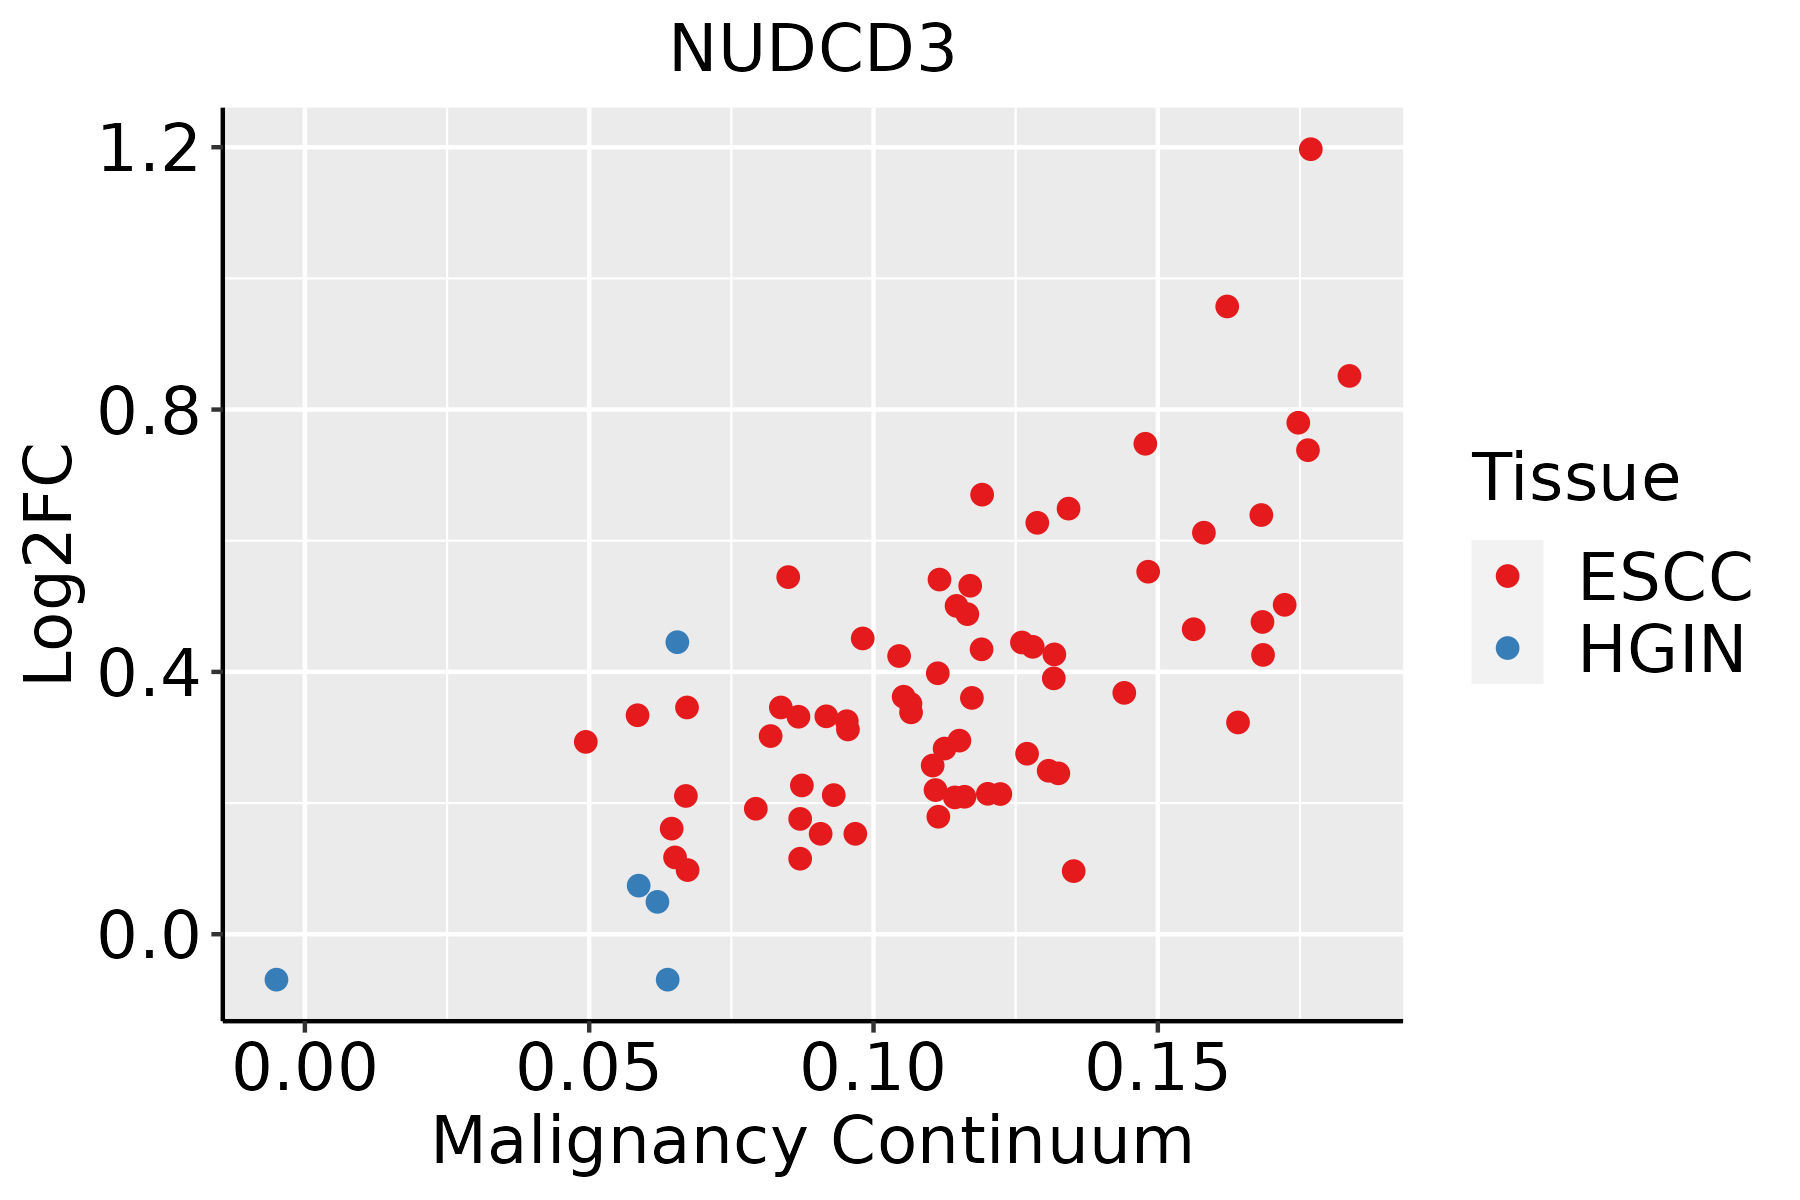 | ESCC: Esophageal squamous cell carcinoma |
| HGIN: High-grade intraepithelial neoplasias | ||
| LGIN: Low-grade intraepithelial neoplasias | ||
| Liver | 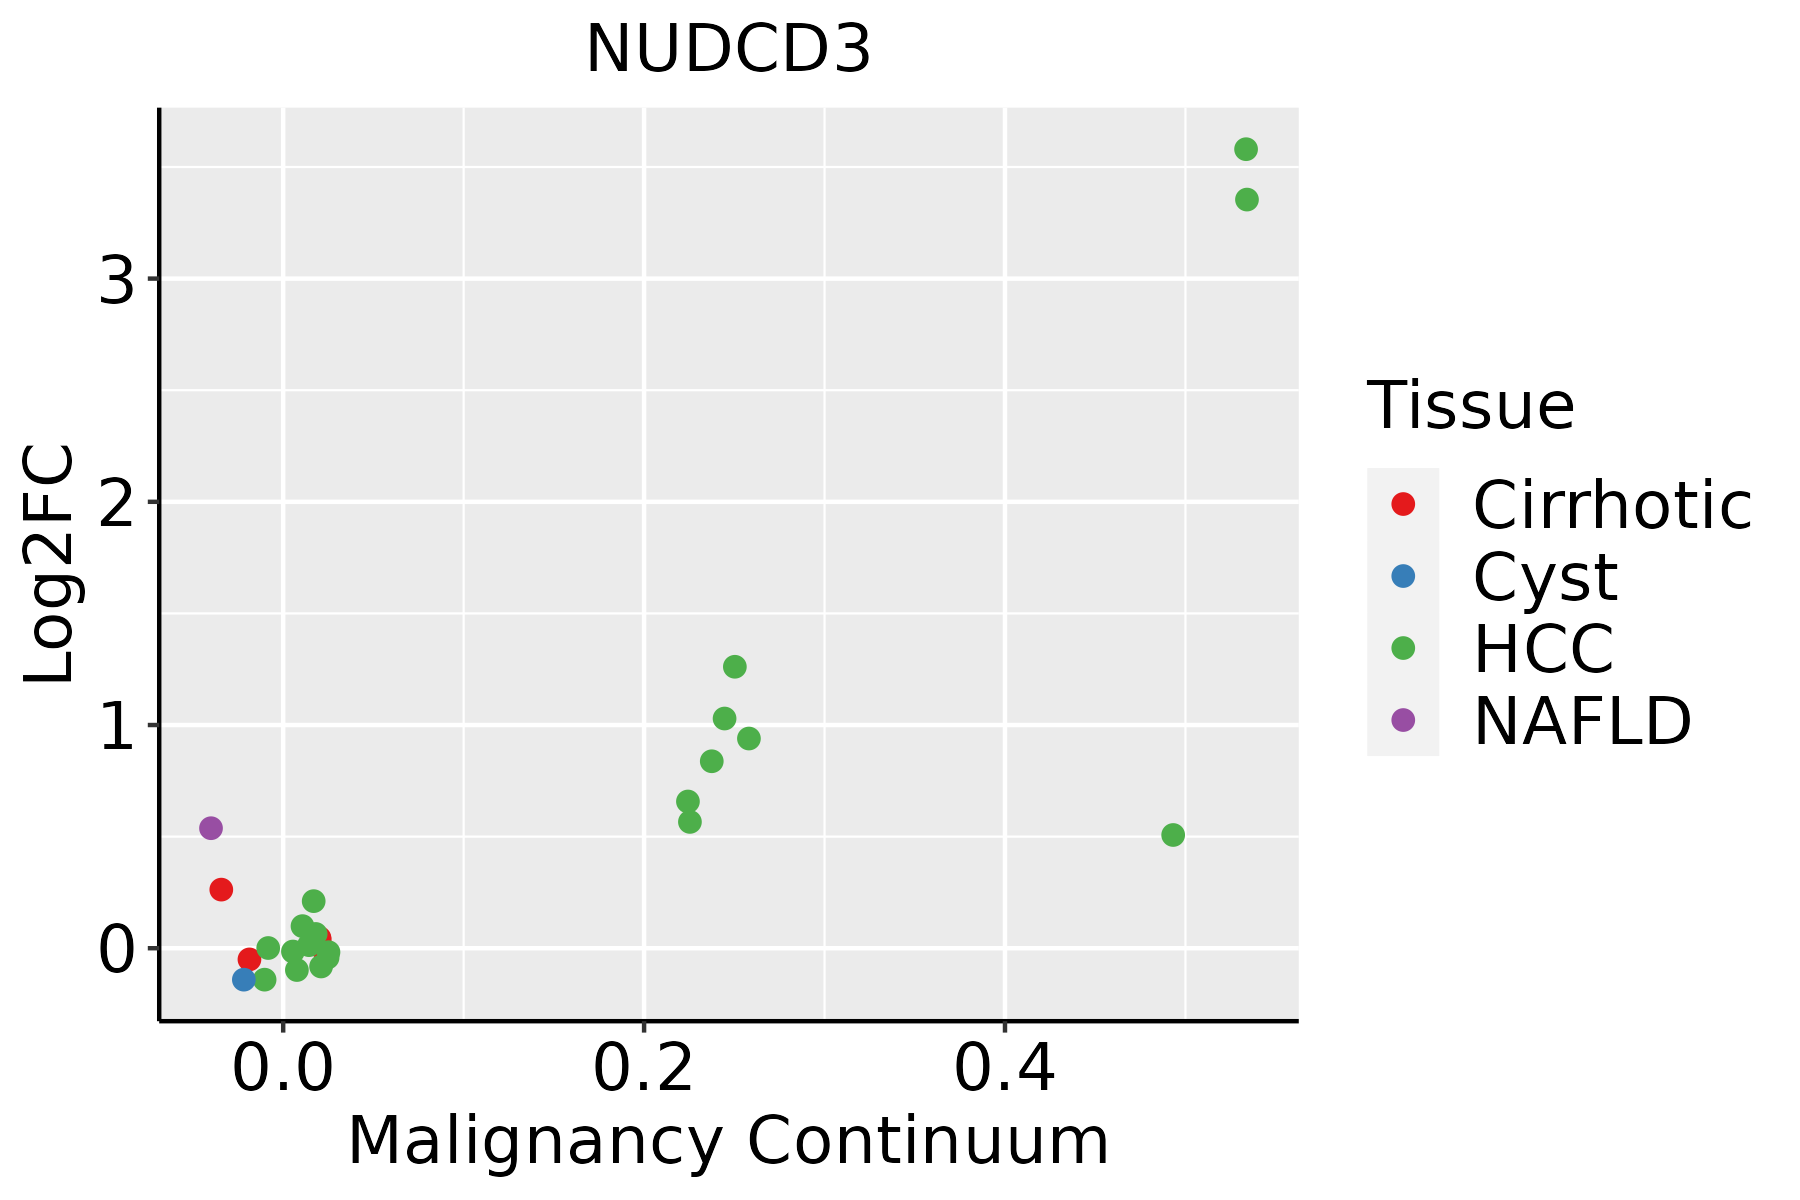 | HCC: Hepatocellular carcinoma |
| NAFLD: Non-alcoholic fatty liver disease | ||
| Oral Cavity | 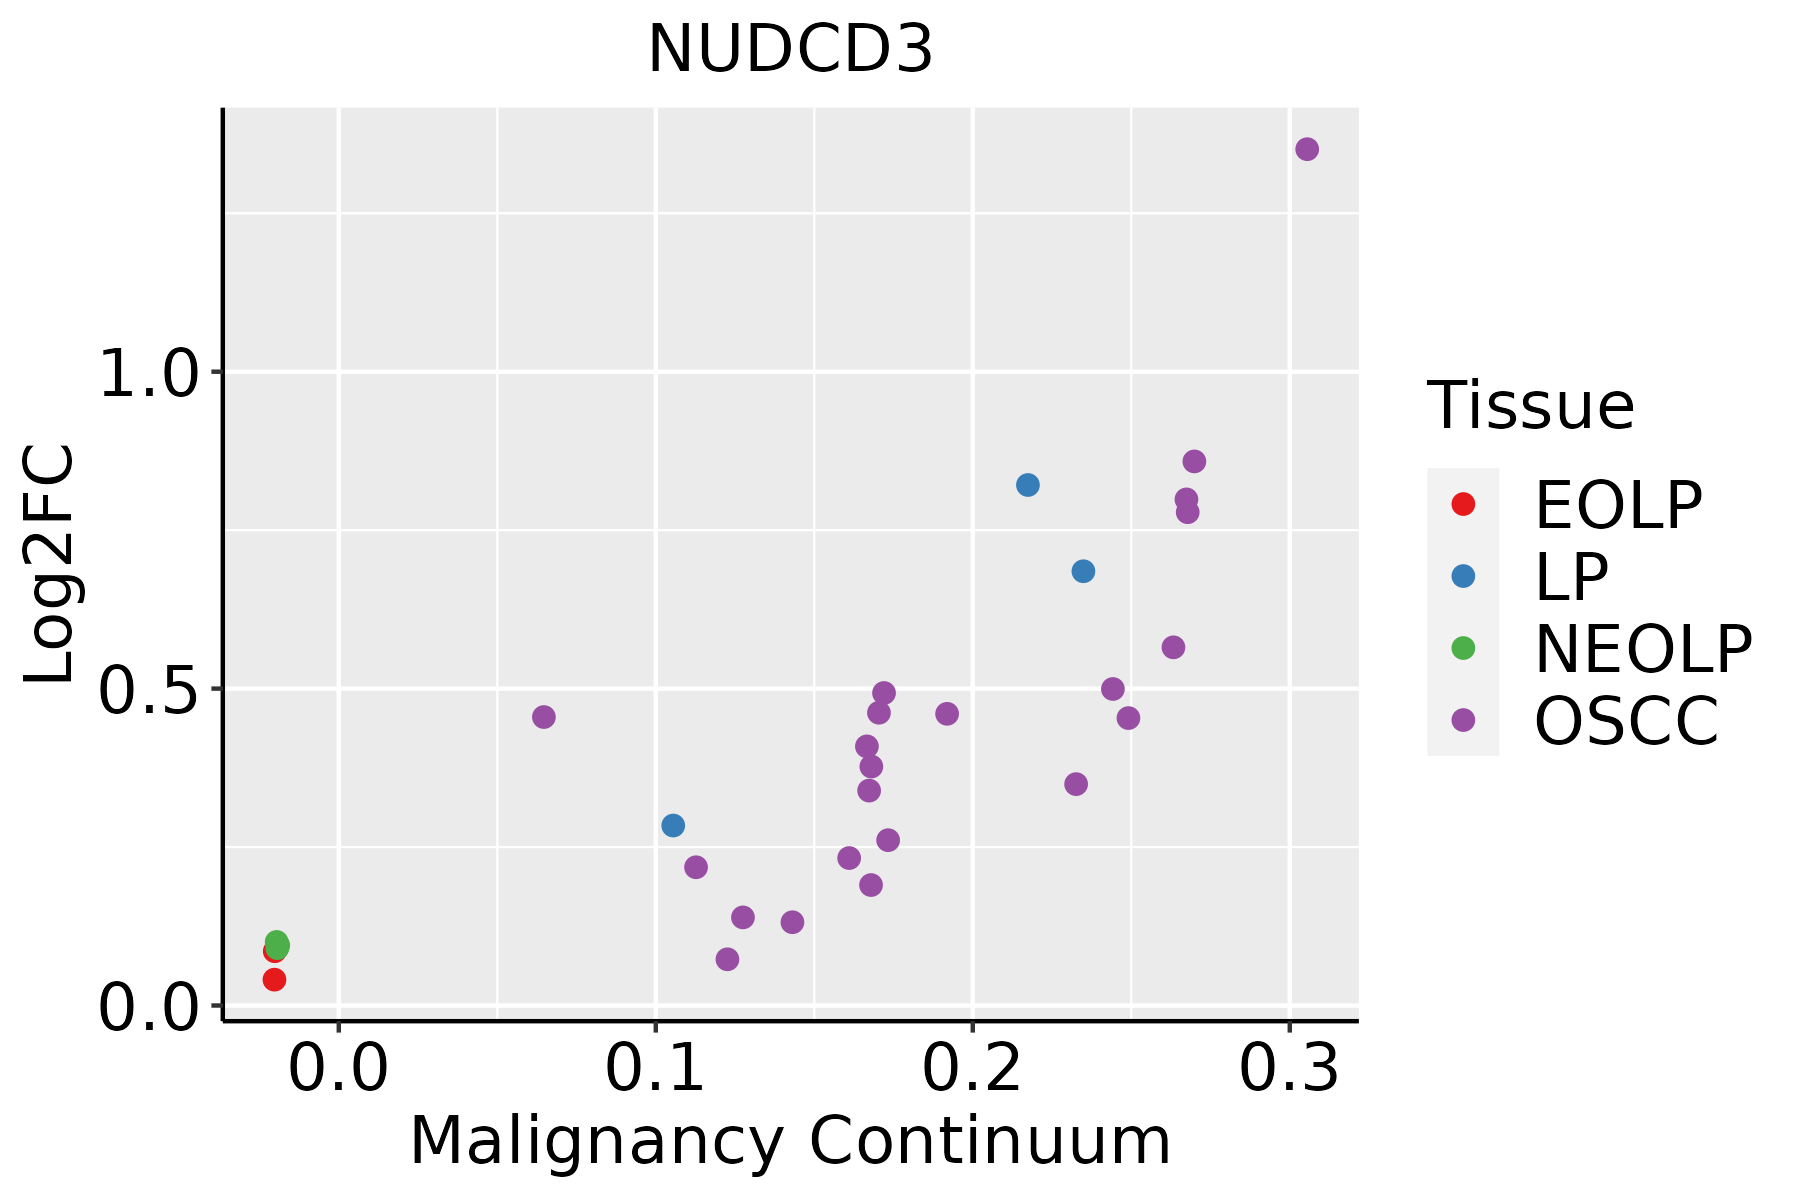 | EOLP: Erosive Oral lichen planus |
| LP: leukoplakia | ||
| NEOLP: Non-erosive oral lichen planus | ||
| OSCC: Oral squamous cell carcinoma | ||
| Skin | 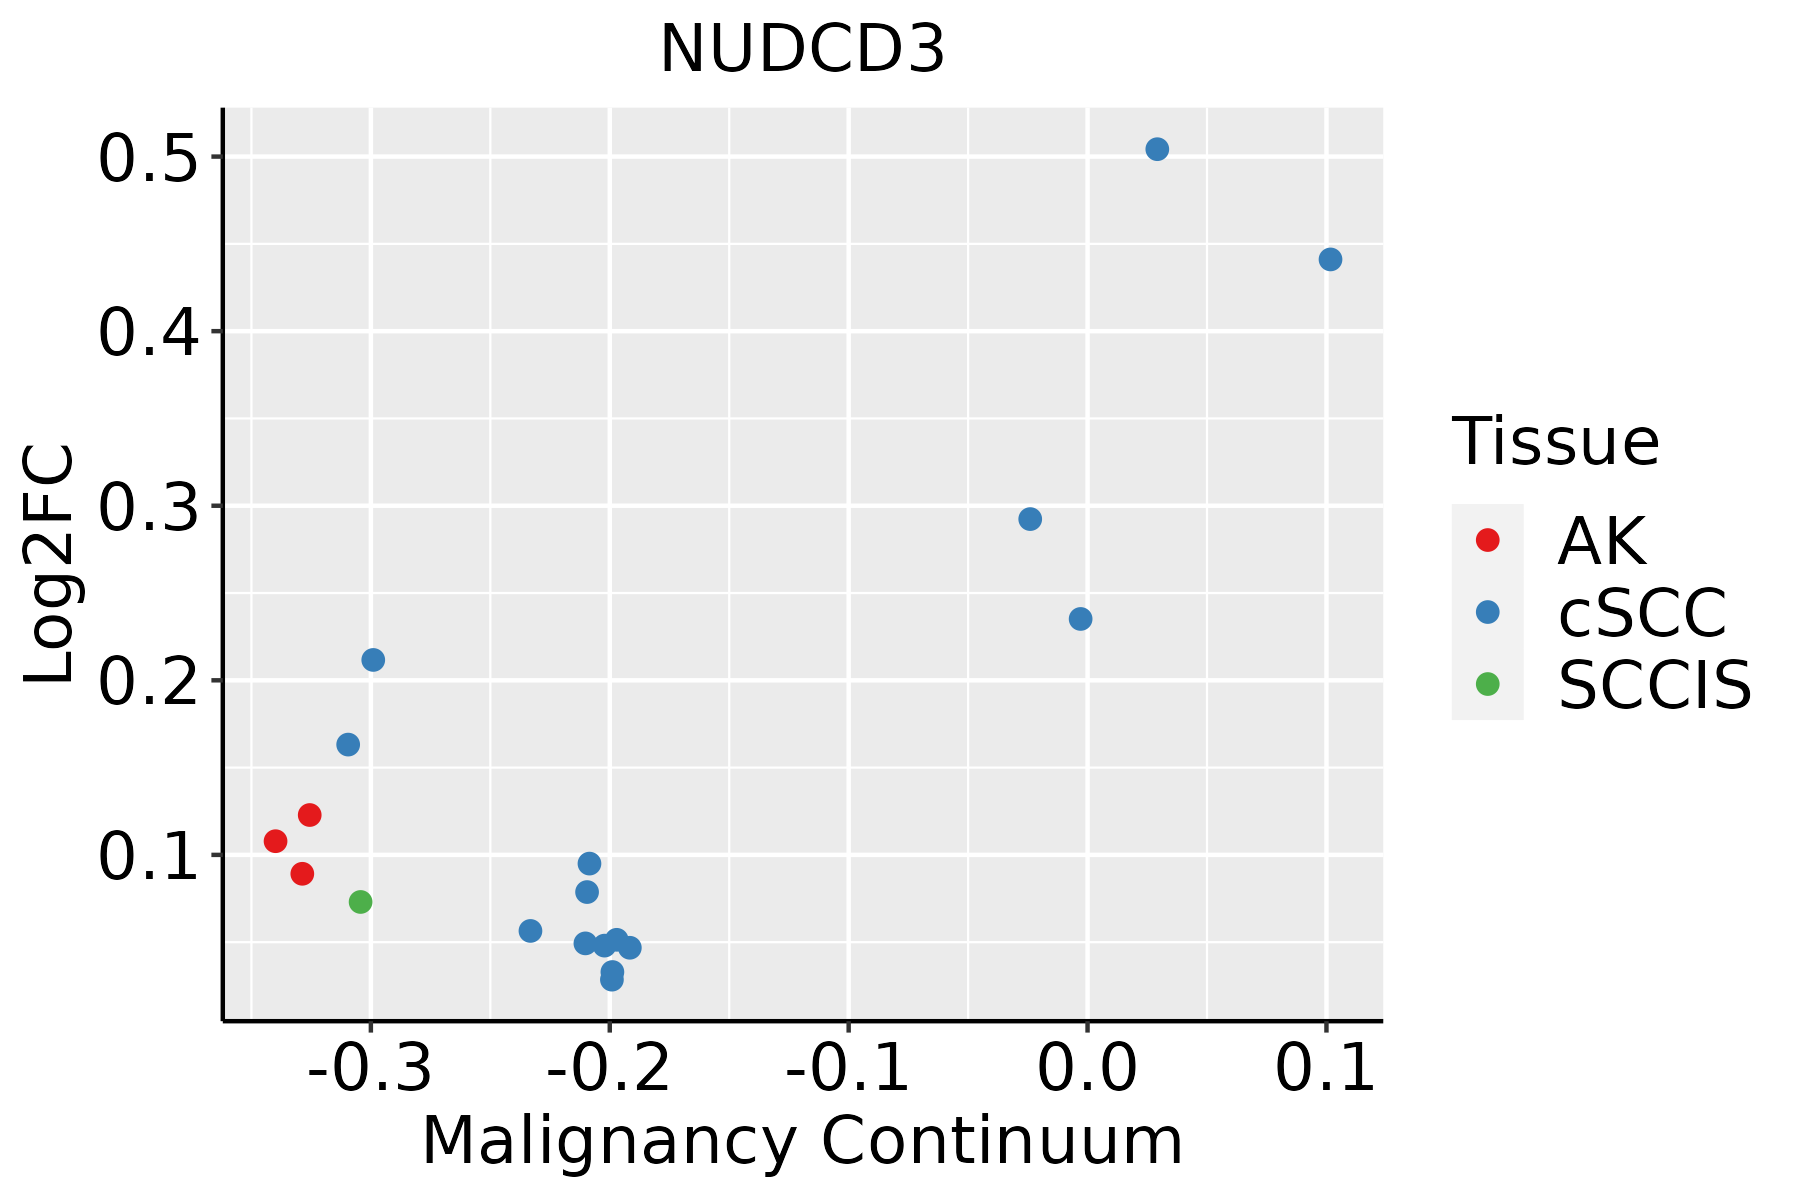 | AK: Actinic keratosis |
| cSCC: Cutaneous squamous cell carcinoma | ||
| SCCIS:squamous cell carcinoma in situ | ||
| Thyroid | 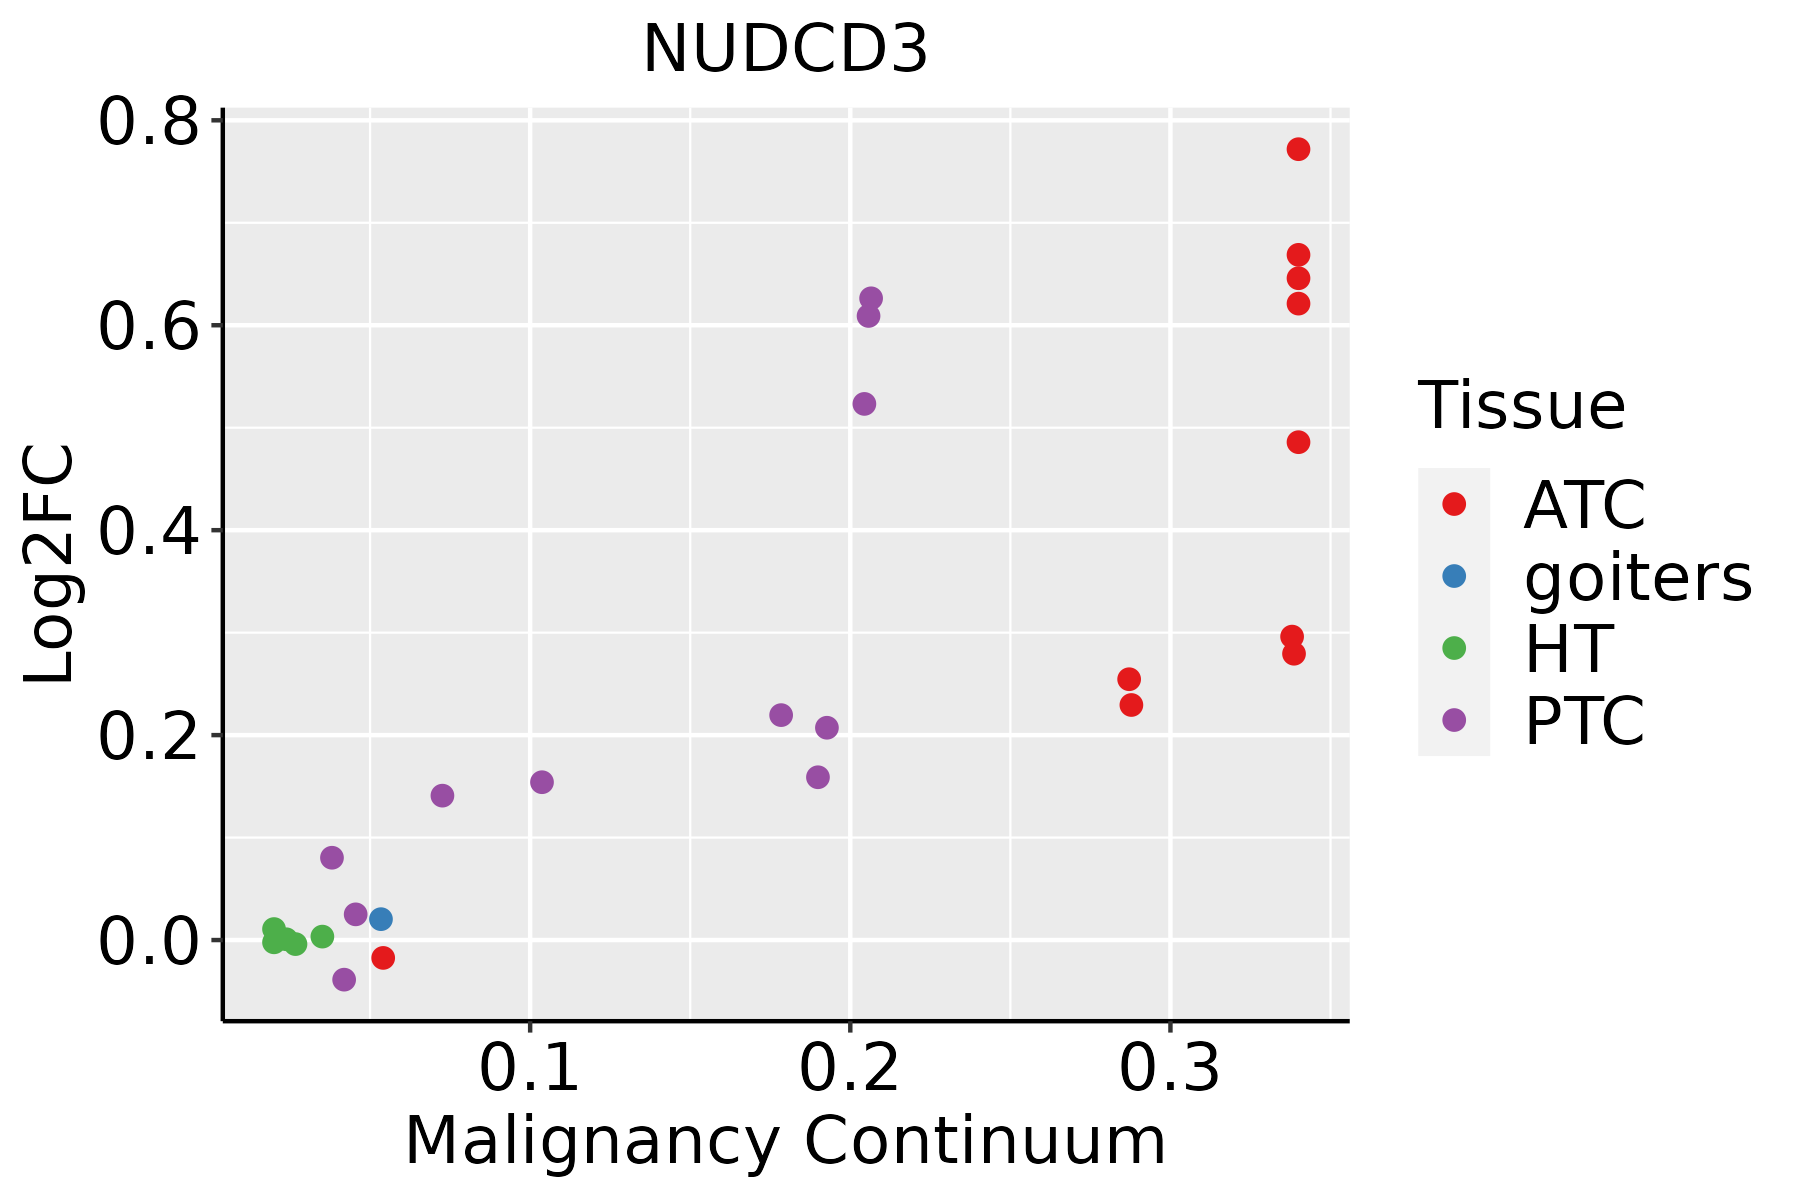 | ATC: Anaplastic thyroid cancer |
| HT: Hashimoto's thyroiditis | ||
| PTC: Papillary thyroid cancer |
| ∗log2FC in expression of this searched gene in stem-like cells from each diseased tissue sample relative to stem-like cells in normal samples in each tissue plotted against the malignancy continuum. Samples are colored based on if they are from different disease stage. |
Top |
Malignant transformation related pathway analysis |
| Find out the enriched GO biological processes and KEGG pathways involved in transition from healthy to precancer to cancer |
| Tissue | Disease Stage | Enriched GO biological Processes |
| Colorectum | AD |  |
| Colorectum | SER |  |
| Colorectum | MSS |  |
| Colorectum | MSI-H |  |
| Colorectum | FAP |  |
| ∗Top 15 enriched GO BP terms are showed in the bar plot of each disease state in each tissue. Each row represents a significant GO biological process which is colored according to the -log10(p.adjust). |
| Page: 1 2 3 4 5 6 7 8 9 |
| GO ID | Tissue | Disease Stage | Description | Gene Ratio | Bg Ratio | pvalue | p.adjust | Count |
| GO:0006457110 | Esophagus | ESCC | protein folding | 163/8552 | 212/18723 | 1.13e-20 | 1.74e-18 | 163 |
| GO:00726985 | Esophagus | ESCC | protein localization to microtubule cytoskeleton | 43/8552 | 54/18723 | 3.28e-07 | 4.61e-06 | 43 |
| GO:00443804 | Esophagus | ESCC | protein localization to cytoskeleton | 45/8552 | 58/18723 | 6.89e-07 | 8.99e-06 | 45 |
| GO:19055086 | Esophagus | ESCC | protein localization to microtubule organizing center | 28/8552 | 35/18723 | 3.40e-05 | 2.78e-04 | 28 |
| GO:00715396 | Esophagus | ESCC | protein localization to centrosome | 26/8552 | 33/18723 | 1.06e-04 | 7.43e-04 | 26 |
| GO:00715394 | Liver | NAFLD | protein localization to centrosome | 10/1882 | 33/18723 | 1.09e-03 | 1.27e-02 | 10 |
| GO:19055084 | Liver | NAFLD | protein localization to microtubule organizing center | 10/1882 | 35/18723 | 1.79e-03 | 1.85e-02 | 10 |
| GO:00726983 | Liver | NAFLD | protein localization to microtubule cytoskeleton | 12/1882 | 54/18723 | 6.44e-03 | 4.69e-02 | 12 |
| GO:000645712 | Liver | HCC | protein folding | 160/7958 | 212/18723 | 1.07e-22 | 1.88e-20 | 160 |
| GO:00443802 | Liver | HCC | protein localization to cytoskeleton | 38/7958 | 58/18723 | 3.37e-04 | 2.36e-03 | 38 |
| GO:007269811 | Liver | HCC | protein localization to microtubule cytoskeleton | 35/7958 | 54/18723 | 7.73e-04 | 4.65e-03 | 35 |
| GO:190550811 | Liver | HCC | protein localization to microtubule organizing center | 23/7958 | 35/18723 | 4.72e-03 | 2.02e-02 | 23 |
| GO:007153911 | Liver | HCC | protein localization to centrosome | 21/7958 | 33/18723 | 1.16e-02 | 4.28e-02 | 21 |
| GO:000645718 | Oral cavity | OSCC | protein folding | 154/7305 | 212/18723 | 1.89e-23 | 4.60e-21 | 154 |
| GO:00443803 | Oral cavity | OSCC | protein localization to cytoskeleton | 33/7305 | 58/18723 | 4.32e-03 | 1.75e-02 | 33 |
| GO:00726984 | Oral cavity | OSCC | protein localization to microtubule cytoskeleton | 30/7305 | 54/18723 | 9.99e-03 | 3.49e-02 | 30 |
| GO:000645719 | Oral cavity | LP | protein folding | 125/4623 | 212/18723 | 1.62e-26 | 8.45e-24 | 125 |
| GO:0006457111 | Skin | cSCC | protein folding | 131/4864 | 212/18723 | 2.96e-28 | 1.32e-25 | 131 |
| GO:00443805 | Skin | cSCC | protein localization to cytoskeleton | 26/4864 | 58/18723 | 1.44e-03 | 9.09e-03 | 26 |
| GO:00726986 | Skin | cSCC | protein localization to microtubule cytoskeleton | 24/4864 | 54/18723 | 2.49e-03 | 1.42e-02 | 24 |
| Page: 1 2 |
| Pathway ID | Tissue | Disease Stage | Description | Gene Ratio | Bg Ratio | pvalue | p.adjust | qvalue | Count |
| Page: 1 |
Top |
Cell-cell communication analysis |
| Identification of potential cell-cell interactions between two cell types and their ligand-receptor pairs for different disease states |
| Ligand | Receptor | LRpair | Pathway | Tissue | Disease Stage |
| Page: 1 |
Top |
Single-cell gene regulatory network inference analysis |
| Find out the significant the regulons (TFs) and the target genes of each regulon across cell types for different disease states |
| TF | Cell Type | Tissue | Disease Stage | Target Gene | RSS | Regulon Activity |
| ∗The dot plots of a searched regulon are shown for all cell subpopulations in each disease state of each tissue based on the regulon specific score inferred using pySCENIC and by calculating the average expression. |
| Page: 1 |
Top |
Somatic mutation of malignant transformation related genes |
| Annotation of somatic variants for genes involved in malignant transformation |
| Hugo Symbol | Variant Class | Variant Classification | dbSNP RS | HGVSc | HGVSp | HGVSp Short | SWISSPROT | BIOTYPE | SIFT | PolyPhen | Tumor Sample Barcode | Tissue | Histology | Sex | Age | Stage | Therapy Types | Drugs | Outcome |
| NUDCD3 | SNV | Missense_Mutation | novel | c.208N>C | p.Asp70His | p.D70H | Q8IVD9 | protein_coding | deleterious(0) | possibly_damaging(0.674) | TCGA-AC-A3W6-01 | Breast | breast invasive carcinoma | Female | >=65 | III/IV | Unknown | Unknown | SD |
| NUDCD3 | insertion | Nonsense_Mutation | novel | c.797_798insATAGTTGAGAAGAGCCCTGAAGAATAAGGAGACAAGTAAGCAA | p.Ser266ArgfsTer2 | p.S266Rfs*2 | Q8IVD9 | protein_coding | TCGA-A8-A079-01 | Breast | breast invasive carcinoma | Female | >=65 | III/IV | Chemotherapy | 5-fluorouracil | SD | ||
| NUDCD3 | SNV | Missense_Mutation | novel | c.266N>A | p.Arg89Lys | p.R89K | Q8IVD9 | protein_coding | tolerated(0.76) | benign(0.034) | TCGA-JW-A5VL-01 | Cervix | cervical & endocervical cancer | Female | <65 | I/II | Unknown | Unknown | SD |
| NUDCD3 | SNV | Missense_Mutation | rs747911756 | c.143N>T | p.Ser48Leu | p.S48L | Q8IVD9 | protein_coding | tolerated(0.09) | benign(0.066) | TCGA-VS-A958-01 | Cervix | cervical & endocervical cancer | Female | <65 | I/II | Chemotherapy | cisplatin | CR |
| NUDCD3 | SNV | Missense_Mutation | rs569119981 | c.110N>G | p.Lys37Arg | p.K37R | Q8IVD9 | protein_coding | tolerated(0.52) | possibly_damaging(0.448) | TCGA-AA-3560-01 | Colorectum | colon adenocarcinoma | Female | >=65 | III/IV | Chemotherapy | folinic | CR |
| NUDCD3 | SNV | Missense_Mutation | rs760773518 | c.1042G>A | p.Asp348Asn | p.D348N | Q8IVD9 | protein_coding | deleterious(0.02) | probably_damaging(0.909) | TCGA-AA-3984-01 | Colorectum | colon adenocarcinoma | Female | <65 | I/II | Unknown | Unknown | SD |
| NUDCD3 | SNV | Missense_Mutation | novel | c.387A>T | p.Glu129Asp | p.E129D | Q8IVD9 | protein_coding | tolerated(0.19) | benign(0) | TCGA-AA-A01K-01 | Colorectum | colon adenocarcinoma | Female | >=65 | III/IV | Chemotherapy | folinic | CR |
| NUDCD3 | SNV | Missense_Mutation | novel | c.987G>T | p.Glu329Asp | p.E329D | Q8IVD9 | protein_coding | tolerated(0.38) | benign(0.019) | TCGA-CA-6717-01 | Colorectum | colon adenocarcinoma | Male | <65 | I/II | Chemotherapy | oxaliplatin | CR |
| NUDCD3 | SNV | Missense_Mutation | rs760773518 | c.1042N>A | p.Asp348Asn | p.D348N | Q8IVD9 | protein_coding | deleterious(0.02) | probably_damaging(0.909) | TCGA-CM-6171-01 | Colorectum | colon adenocarcinoma | Female | >=65 | I/II | Unknown | Unknown | SD |
| NUDCD3 | SNV | Missense_Mutation | c.772G>A | p.Gly258Arg | p.G258R | Q8IVD9 | protein_coding | deleterious(0.02) | probably_damaging(0.991) | TCGA-F4-6856-01 | Colorectum | colon adenocarcinoma | Male | <65 | I/II | Ancillary | leucovorin | CR |
| Page: 1 2 3 4 |
Top |
Related drugs of malignant transformation related genes |
| Identification of chemicals and drugs interact with genes involved in malignant transfromation |
| (DGIdb 4.0) |
| Entrez ID | Symbol | Category | Interaction Types | Drug Claim Name | Drug Name | PMIDs |
| Page: 1 |

Copyright 2023-Present -The University of Texas Health Science Center at Houston |