
|
|||||
|
 | |
| |
| |
| |
| |
| |
|
Gene: NUDCD2 |
Gene summary for NUDCD2 |
| Gene information | Species | Human | Gene symbol | NUDCD2 | Gene ID | 134492 |
| Gene name | NudC domain containing 2 | |
| Gene Alias | NudCL2 | |
| Cytomap | 5q34 | |
| Gene Type | protein-coding | GO ID | GO:0006457 | UniProtAcc | Q8WVJ2 |
Top |
Malignant transformation analysis |
| Identification of the aberrant gene expression in precancerous and cancerous lesions by comparing the gene expression of stem-like cells in diseased tissues with normal stem cells |
| Entrez ID | Symbol | Replicates | Species | Organ | Tissue | Adj P-value | Log2FC | Malignancy |
| 134492 | NUDCD2 | LZE2T | Human | Esophagus | ESCC | 9.92e-09 | 1.13e+00 | 0.082 |
| 134492 | NUDCD2 | LZE4T | Human | Esophagus | ESCC | 1.43e-14 | 3.57e-01 | 0.0811 |
| 134492 | NUDCD2 | LZE7T | Human | Esophagus | ESCC | 4.98e-06 | 5.73e-01 | 0.0667 |
| 134492 | NUDCD2 | LZE8T | Human | Esophagus | ESCC | 9.41e-07 | 5.41e-01 | 0.067 |
| 134492 | NUDCD2 | LZE22D1 | Human | Esophagus | HGIN | 2.07e-02 | 1.48e-01 | 0.0595 |
| 134492 | NUDCD2 | LZE22T | Human | Esophagus | ESCC | 1.75e-02 | 2.90e-01 | 0.068 |
| 134492 | NUDCD2 | LZE24T | Human | Esophagus | ESCC | 7.93e-29 | 9.88e-01 | 0.0596 |
| 134492 | NUDCD2 | LZE21T | Human | Esophagus | ESCC | 1.90e-02 | 3.64e-01 | 0.0655 |
| 134492 | NUDCD2 | LZE6T | Human | Esophagus | ESCC | 3.96e-11 | 9.72e-01 | 0.0845 |
| 134492 | NUDCD2 | P1T-E | Human | Esophagus | ESCC | 3.66e-06 | 4.00e-01 | 0.0875 |
| 134492 | NUDCD2 | P2T-E | Human | Esophagus | ESCC | 3.94e-35 | 7.05e-01 | 0.1177 |
| 134492 | NUDCD2 | P4T-E | Human | Esophagus | ESCC | 1.62e-40 | 1.12e+00 | 0.1323 |
| 134492 | NUDCD2 | P5T-E | Human | Esophagus | ESCC | 2.57e-36 | 8.56e-01 | 0.1327 |
| 134492 | NUDCD2 | P8T-E | Human | Esophagus | ESCC | 1.02e-15 | 3.23e-01 | 0.0889 |
| 134492 | NUDCD2 | P9T-E | Human | Esophagus | ESCC | 1.01e-19 | 6.40e-01 | 0.1131 |
| 134492 | NUDCD2 | P10T-E | Human | Esophagus | ESCC | 2.60e-28 | 6.96e-01 | 0.116 |
| 134492 | NUDCD2 | P11T-E | Human | Esophagus | ESCC | 9.67e-21 | 9.42e-01 | 0.1426 |
| 134492 | NUDCD2 | P12T-E | Human | Esophagus | ESCC | 7.94e-43 | 1.04e+00 | 0.1122 |
| 134492 | NUDCD2 | P15T-E | Human | Esophagus | ESCC | 3.23e-18 | 6.04e-01 | 0.1149 |
| 134492 | NUDCD2 | P16T-E | Human | Esophagus | ESCC | 1.34e-21 | 5.28e-01 | 0.1153 |
| Page: 1 2 3 4 5 6 7 |
| Tissue | Expression Dynamics | Abbreviation |
| Esophagus | 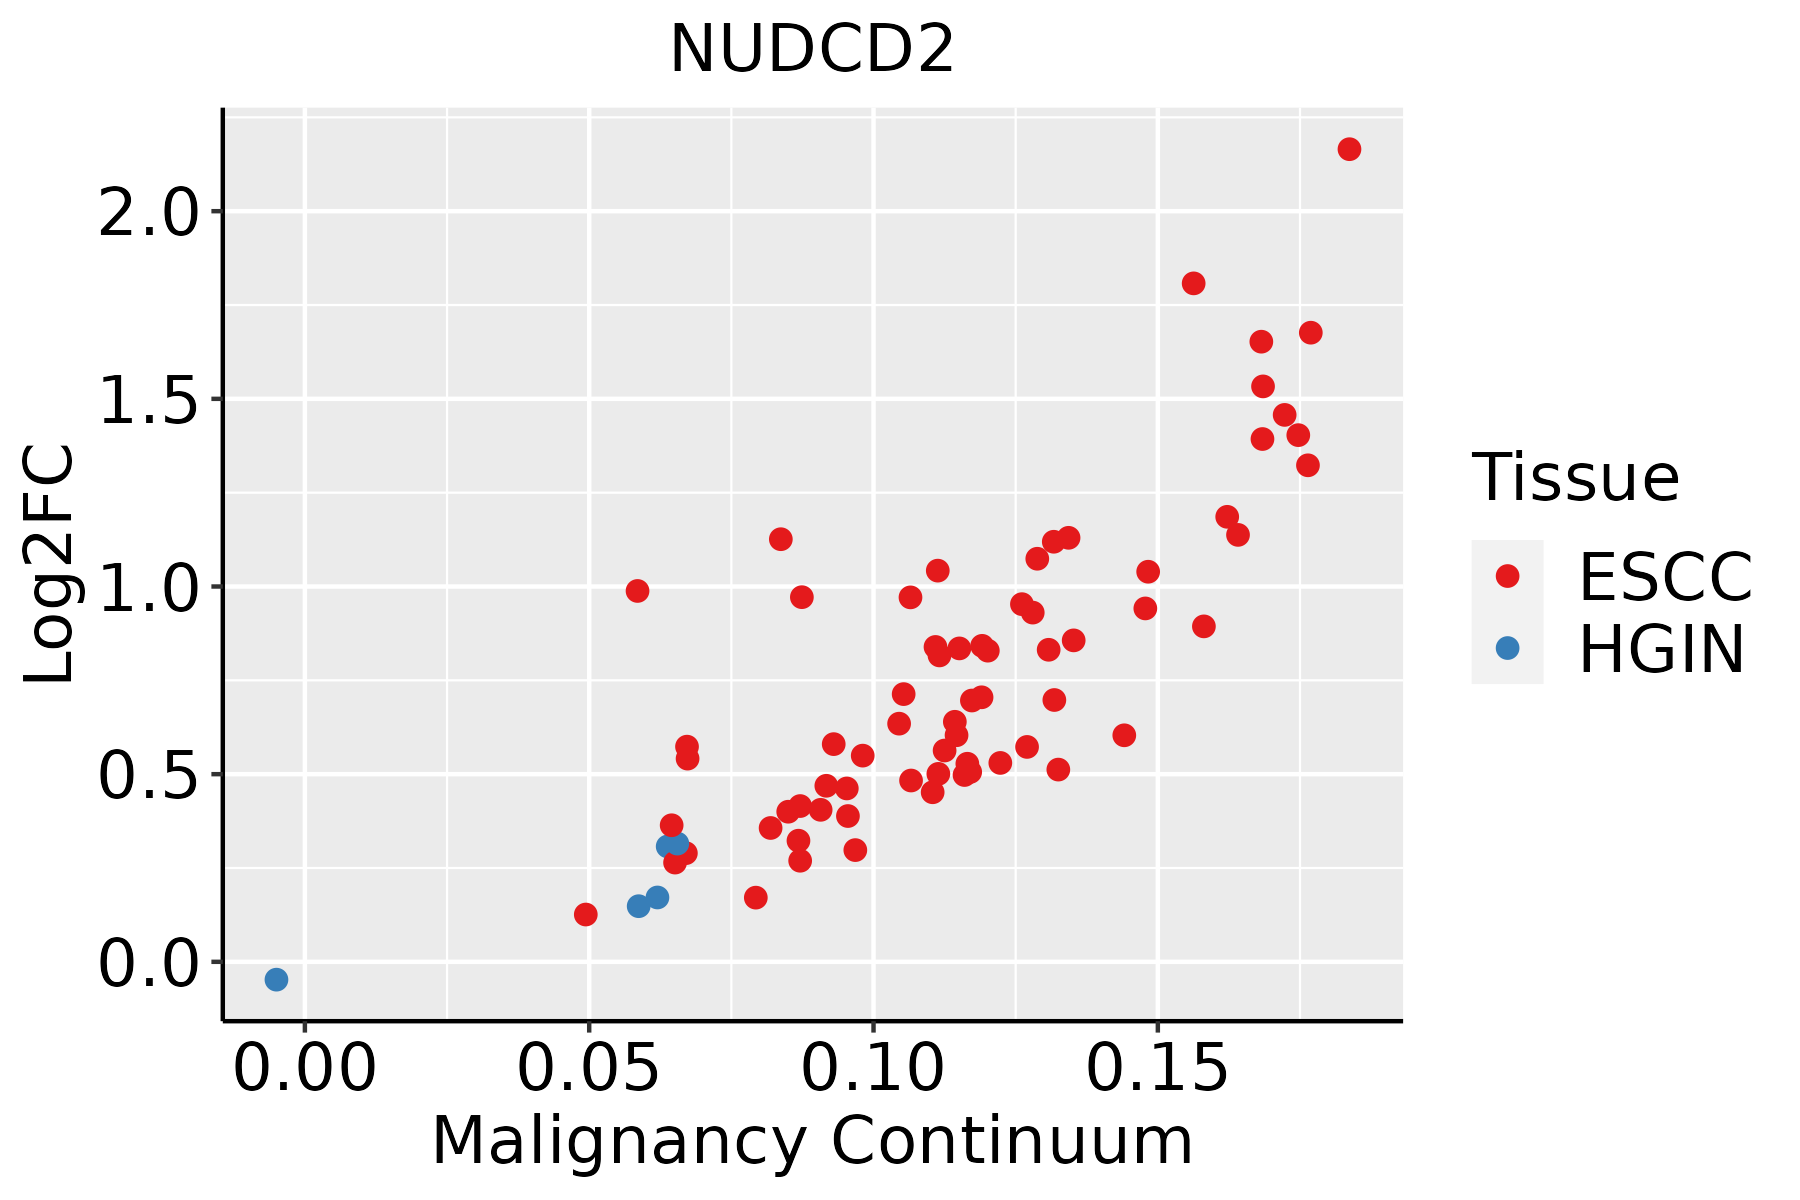 | ESCC: Esophageal squamous cell carcinoma |
| HGIN: High-grade intraepithelial neoplasias | ||
| LGIN: Low-grade intraepithelial neoplasias | ||
| Liver | 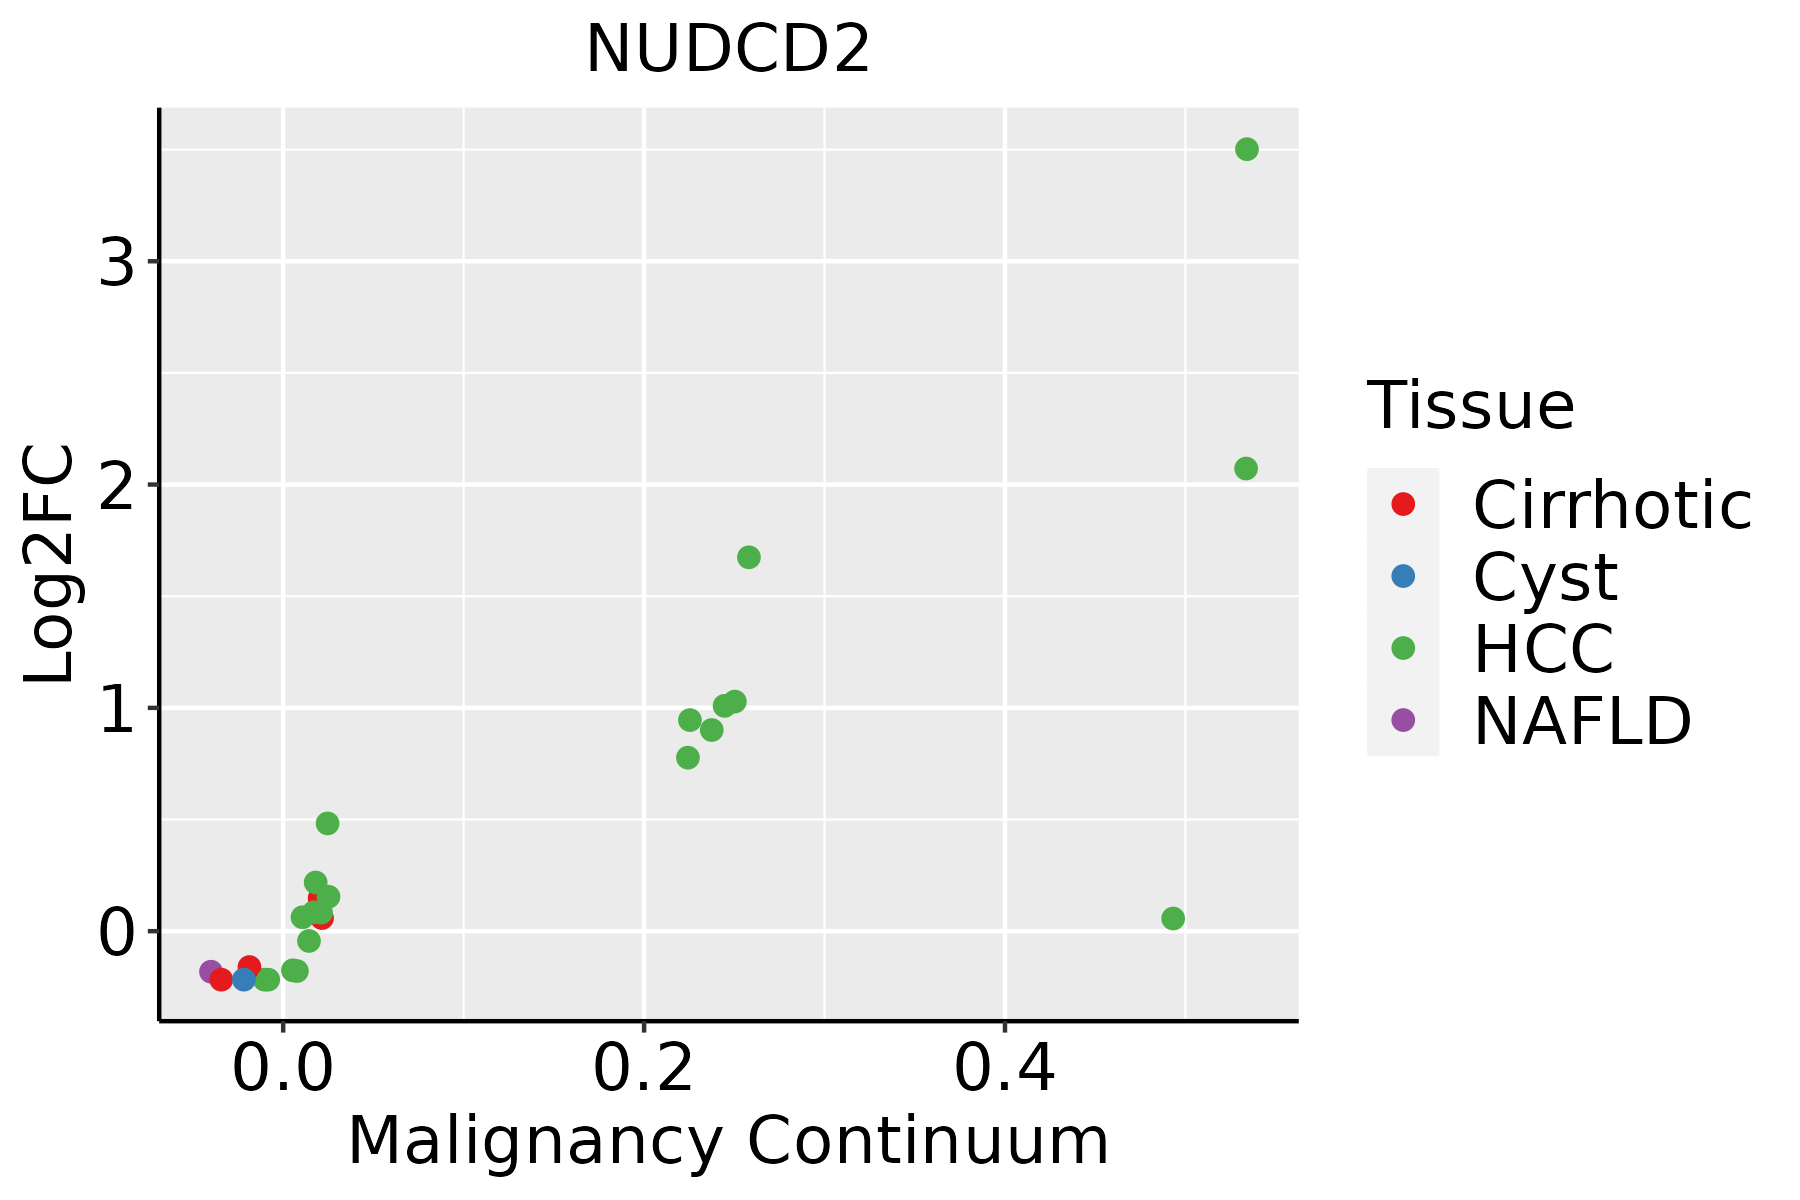 | HCC: Hepatocellular carcinoma |
| NAFLD: Non-alcoholic fatty liver disease | ||
| Oral Cavity |  | EOLP: Erosive Oral lichen planus |
| LP: leukoplakia | ||
| NEOLP: Non-erosive oral lichen planus | ||
| OSCC: Oral squamous cell carcinoma | ||
| Skin | 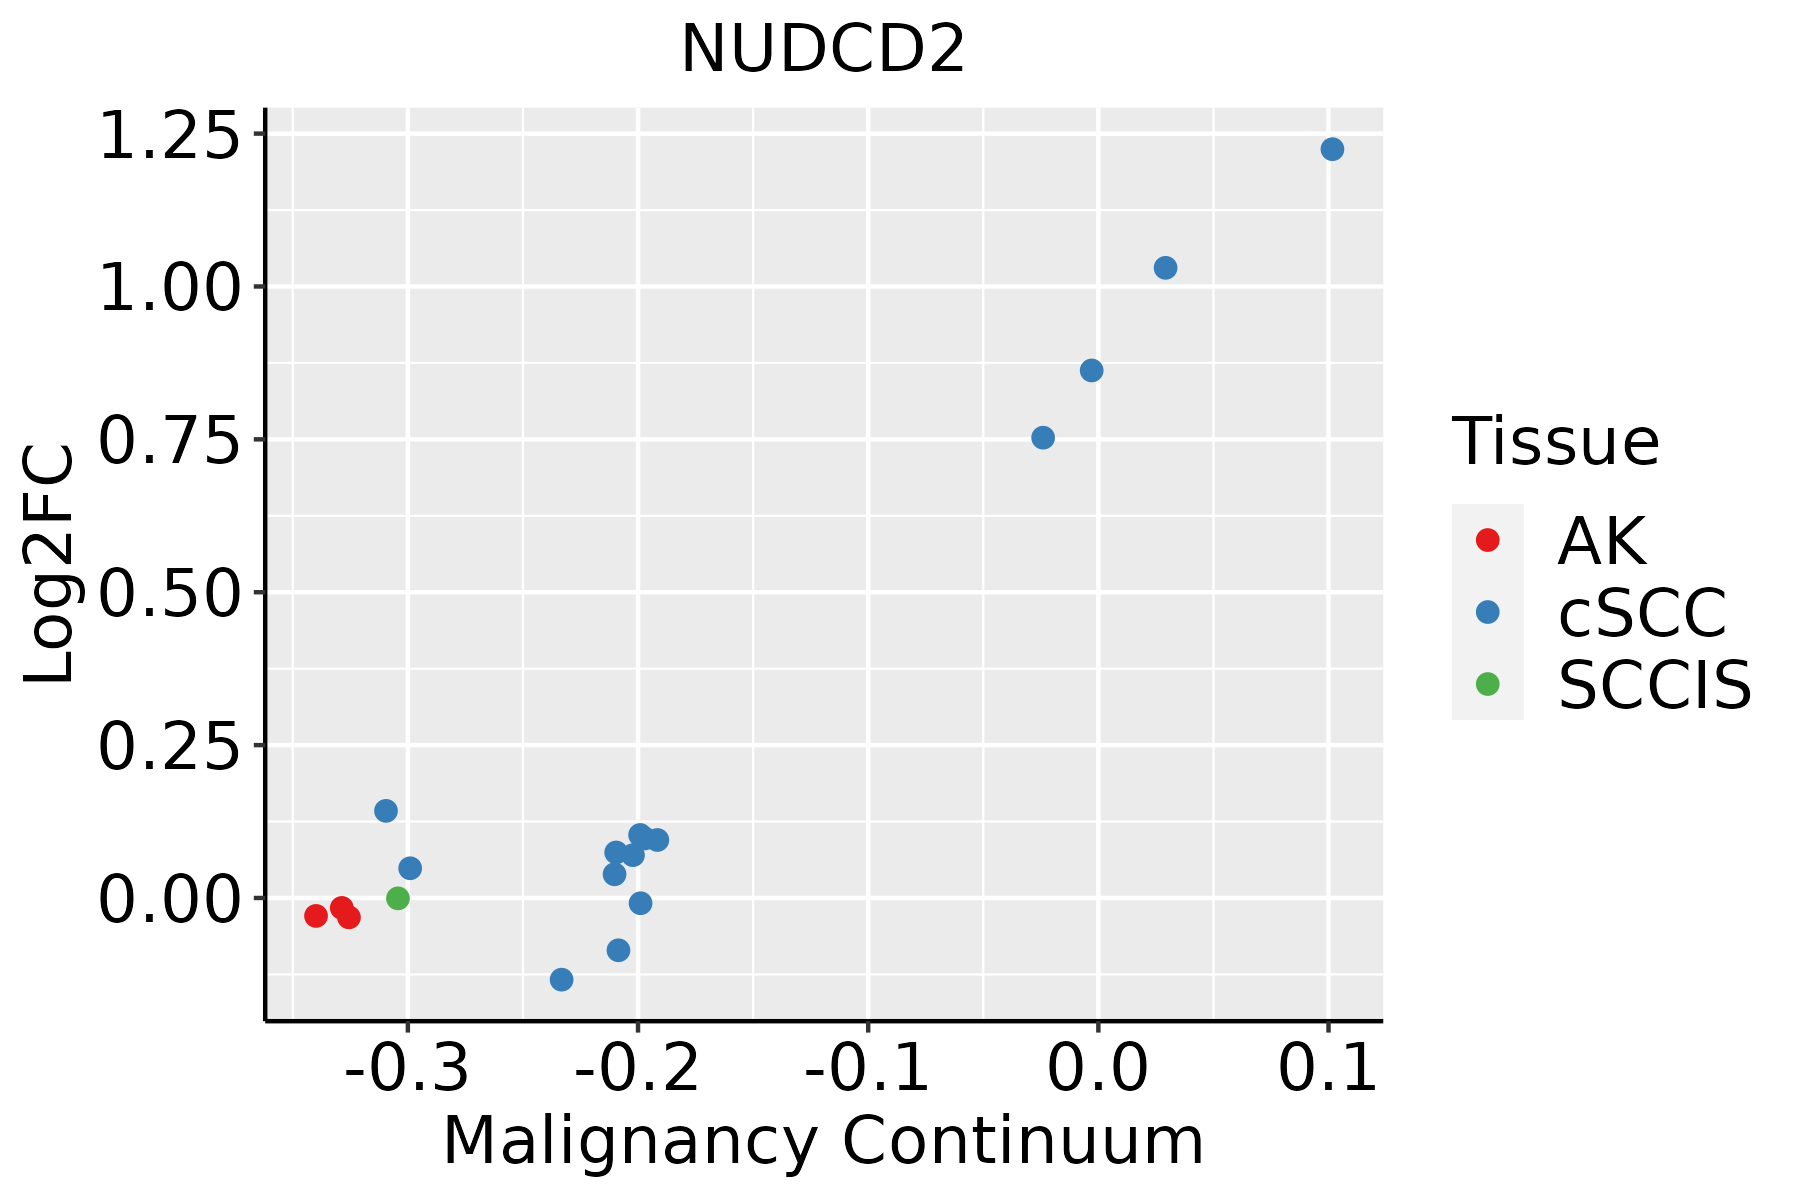 | AK: Actinic keratosis |
| cSCC: Cutaneous squamous cell carcinoma | ||
| SCCIS:squamous cell carcinoma in situ | ||
| Thyroid |  | ATC: Anaplastic thyroid cancer |
| HT: Hashimoto's thyroiditis | ||
| PTC: Papillary thyroid cancer |
| ∗log2FC in expression of this searched gene in stem-like cells from each diseased tissue sample relative to stem-like cells in normal samples in each tissue plotted against the malignancy continuum. Samples are colored based on if they are from different disease stage. |
Top |
Malignant transformation related pathway analysis |
| Find out the enriched GO biological processes and KEGG pathways involved in transition from healthy to precancer to cancer |
| Tissue | Disease Stage | Enriched GO biological Processes |
| Colorectum | AD |  |
| Colorectum | SER |  |
| Colorectum | MSS |  |
| Colorectum | MSI-H |  |
| Colorectum | FAP |  |
| ∗Top 15 enriched GO BP terms are showed in the bar plot of each disease state in each tissue. Each row represents a significant GO biological process which is colored according to the -log10(p.adjust). |
| Page: 1 2 3 4 5 6 7 8 9 |
| GO ID | Tissue | Disease Stage | Description | Gene Ratio | Bg Ratio | pvalue | p.adjust | Count |
| GO:000645720 | Esophagus | HGIN | protein folding | 75/2587 | 212/18723 | 1.61e-15 | 3.86e-13 | 75 |
| GO:0006457110 | Esophagus | ESCC | protein folding | 163/8552 | 212/18723 | 1.13e-20 | 1.74e-18 | 163 |
| GO:00064577 | Liver | Cirrhotic | protein folding | 114/4634 | 212/18723 | 9.23e-20 | 2.31e-17 | 114 |
| GO:000645712 | Liver | HCC | protein folding | 160/7958 | 212/18723 | 1.07e-22 | 1.88e-20 | 160 |
| GO:000645718 | Oral cavity | OSCC | protein folding | 154/7305 | 212/18723 | 1.89e-23 | 4.60e-21 | 154 |
| GO:000645719 | Oral cavity | LP | protein folding | 125/4623 | 212/18723 | 1.62e-26 | 8.45e-24 | 125 |
| GO:0006457111 | Skin | cSCC | protein folding | 131/4864 | 212/18723 | 2.96e-28 | 1.32e-25 | 131 |
| GO:0006457112 | Thyroid | PTC | protein folding | 137/5968 | 212/18723 | 8.29e-23 | 2.01e-20 | 137 |
| GO:000645733 | Thyroid | ATC | protein folding | 140/6293 | 212/18723 | 3.46e-22 | 8.09e-20 | 140 |
| Page: 1 |
| Pathway ID | Tissue | Disease Stage | Description | Gene Ratio | Bg Ratio | pvalue | p.adjust | qvalue | Count |
| Page: 1 |
Top |
Cell-cell communication analysis |
| Identification of potential cell-cell interactions between two cell types and their ligand-receptor pairs for different disease states |
| Ligand | Receptor | LRpair | Pathway | Tissue | Disease Stage |
| Page: 1 |
Top |
Single-cell gene regulatory network inference analysis |
| Find out the significant the regulons (TFs) and the target genes of each regulon across cell types for different disease states |
| TF | Cell Type | Tissue | Disease Stage | Target Gene | RSS | Regulon Activity |
| ∗The dot plots of a searched regulon are shown for all cell subpopulations in each disease state of each tissue based on the regulon specific score inferred using pySCENIC and by calculating the average expression. |
| Page: 1 |
Top |
Somatic mutation of malignant transformation related genes |
| Annotation of somatic variants for genes involved in malignant transformation |
| Hugo Symbol | Variant Class | Variant Classification | dbSNP RS | HGVSc | HGVSp | HGVSp Short | SWISSPROT | BIOTYPE | SIFT | PolyPhen | Tumor Sample Barcode | Tissue | Histology | Sex | Age | Stage | Therapy Types | Drugs | Outcome |
| NUDCD2 | SNV | Missense_Mutation | c.430N>T | p.Asn144Tyr | p.N144Y | Q8WVJ2 | protein_coding | deleterious(0) | probably_damaging(0.988) | TCGA-A8-A09Q-01 | Breast | breast invasive carcinoma | Female | >=65 | III/IV | Hormone Therapy | anastrozole | SD | |
| NUDCD2 | SNV | Missense_Mutation | novel | c.191N>C | p.Gly64Ala | p.G64A | Q8WVJ2 | protein_coding | deleterious(0.01) | probably_damaging(0.999) | TCGA-E9-A2JS-01 | Breast | breast invasive carcinoma | Female | >=65 | I/II | Chemotherapy | cyclophosphamide | PD |
| NUDCD2 | SNV | Missense_Mutation | novel | c.331N>A | p.Asp111Asn | p.D111N | Q8WVJ2 | protein_coding | tolerated(0.08) | benign(0.062) | TCGA-A5-A0G2-01 | Endometrium | uterine corpus endometrioid carcinoma | Female | <65 | III/IV | Unknown | Unknown | SD |
| NUDCD2 | SNV | Missense_Mutation | rs780024537 | c.122N>G | p.Gln41Arg | p.Q41R | Q8WVJ2 | protein_coding | tolerated(0.1) | benign(0) | TCGA-DF-A2KN-01 | Endometrium | uterine corpus endometrioid carcinoma | Female | Unknown | I/II | Unknown | Unknown | SD |
| NUDCD2 | SNV | Missense_Mutation | novel | c.56N>A | p.Gly19Asp | p.G19D | Q8WVJ2 | protein_coding | deleterious(0) | probably_damaging(1) | TCGA-4R-AA8I-01 | Liver | liver hepatocellular carcinoma | Male | >=65 | I/II | Unknown | Unknown | PD |
| NUDCD2 | SNV | Missense_Mutation | c.134N>C | p.Cys45Ser | p.C45S | Q8WVJ2 | protein_coding | deleterious(0.01) | benign(0.125) | TCGA-44-7670-01 | Lung | lung adenocarcinoma | Female | <65 | I/II | Chemotherapy | docetaxel | SD | |
| NUDCD2 | SNV | Missense_Mutation | c.373N>C | p.Glu125Gln | p.E125Q | Q8WVJ2 | protein_coding | tolerated(0.2) | possibly_damaging(0.606) | TCGA-78-7149-01 | Lung | lung adenocarcinoma | Male | >=65 | III/IV | Unknown | Unknown | SD | |
| NUDCD2 | SNV | Missense_Mutation | novel | c.16G>C | p.Glu6Gln | p.E6Q | Q8WVJ2 | protein_coding | deleterious(0.02) | benign(0.2) | TCGA-21-1079-01 | Lung | lung squamous cell carcinoma | Male | >=65 | III/IV | Unknown | Unknown | PD |
| NUDCD2 | deletion | Frame_Shift_Del | c.170delG | p.Gly57AlafsTer15 | p.G57Afs*15 | Q8WVJ2 | protein_coding | TCGA-60-2726-01 | Lung | lung squamous cell carcinoma | Male | <65 | I/II | Unknown | Unknown | SD | |||
| NUDCD2 | SNV | Missense_Mutation | c.65A>G | p.Tyr22Cys | p.Y22C | Q8WVJ2 | protein_coding | tolerated(0.12) | benign(0.056) | TCGA-CG-5721-01 | Stomach | stomach adenocarcinoma | Male | <65 | III/IV | Unknown | Unknown | SD |
| Page: 1 2 |
Top |
Related drugs of malignant transformation related genes |
| Identification of chemicals and drugs interact with genes involved in malignant transfromation |
| (DGIdb 4.0) |
| Entrez ID | Symbol | Category | Interaction Types | Drug Claim Name | Drug Name | PMIDs |
| Page: 1 |

Copyright 2023-Present -The University of Texas Health Science Center at Houston |