
|
|||||
|
 | |
| |
| |
| |
| |
| |
|
Gene: NUDCD1 |
Gene summary for NUDCD1 |
| Gene information | Species | Human | Gene symbol | NUDCD1 | Gene ID | 84955 |
| Gene name | NudC domain containing 1 | |
| Gene Alias | CML66 | |
| Cytomap | 8q23.1 | |
| Gene Type | protein-coding | GO ID | GO:0002376 | UniProtAcc | Q96RS6 |
Top |
Malignant transformation analysis |
| Identification of the aberrant gene expression in precancerous and cancerous lesions by comparing the gene expression of stem-like cells in diseased tissues with normal stem cells |
| Entrez ID | Symbol | Replicates | Species | Organ | Tissue | Adj P-value | Log2FC | Malignancy |
| 84955 | NUDCD1 | LZE3D | Human | Esophagus | HGIN | 2.39e-02 | 5.85e-01 | 0.0668 |
| 84955 | NUDCD1 | LZE4T | Human | Esophagus | ESCC | 2.41e-06 | 1.96e-01 | 0.0811 |
| 84955 | NUDCD1 | LZE20T | Human | Esophagus | ESCC | 7.16e-08 | 1.36e-01 | 0.0662 |
| 84955 | NUDCD1 | LZE24T | Human | Esophagus | ESCC | 1.15e-07 | 1.66e-01 | 0.0596 |
| 84955 | NUDCD1 | LZE6T | Human | Esophagus | ESCC | 8.52e-06 | 1.26e-01 | 0.0845 |
| 84955 | NUDCD1 | P2T-E | Human | Esophagus | ESCC | 8.17e-25 | 4.03e-01 | 0.1177 |
| 84955 | NUDCD1 | P4T-E | Human | Esophagus | ESCC | 2.33e-22 | 5.45e-01 | 0.1323 |
| 84955 | NUDCD1 | P5T-E | Human | Esophagus | ESCC | 9.78e-09 | 2.52e-01 | 0.1327 |
| 84955 | NUDCD1 | P8T-E | Human | Esophagus | ESCC | 1.06e-14 | 2.51e-01 | 0.0889 |
| 84955 | NUDCD1 | P9T-E | Human | Esophagus | ESCC | 2.76e-16 | 2.21e-01 | 0.1131 |
| 84955 | NUDCD1 | P10T-E | Human | Esophagus | ESCC | 2.50e-13 | 2.86e-01 | 0.116 |
| 84955 | NUDCD1 | P11T-E | Human | Esophagus | ESCC | 1.17e-13 | 3.47e-01 | 0.1426 |
| 84955 | NUDCD1 | P12T-E | Human | Esophagus | ESCC | 1.33e-18 | 4.59e-01 | 0.1122 |
| 84955 | NUDCD1 | P15T-E | Human | Esophagus | ESCC | 1.75e-20 | 4.24e-01 | 0.1149 |
| 84955 | NUDCD1 | P16T-E | Human | Esophagus | ESCC | 1.72e-35 | 6.74e-01 | 0.1153 |
| 84955 | NUDCD1 | P17T-E | Human | Esophagus | ESCC | 4.68e-08 | 4.15e-01 | 0.1278 |
| 84955 | NUDCD1 | P19T-E | Human | Esophagus | ESCC | 4.66e-05 | 5.80e-01 | 0.1662 |
| 84955 | NUDCD1 | P20T-E | Human | Esophagus | ESCC | 1.68e-15 | 2.53e-01 | 0.1124 |
| 84955 | NUDCD1 | P21T-E | Human | Esophagus | ESCC | 3.20e-22 | 5.95e-01 | 0.1617 |
| 84955 | NUDCD1 | P22T-E | Human | Esophagus | ESCC | 8.40e-10 | 1.98e-01 | 0.1236 |
| Page: 1 2 3 4 5 |
| Tissue | Expression Dynamics | Abbreviation |
| Esophagus |  | ESCC: Esophageal squamous cell carcinoma |
| HGIN: High-grade intraepithelial neoplasias | ||
| LGIN: Low-grade intraepithelial neoplasias | ||
| Liver | 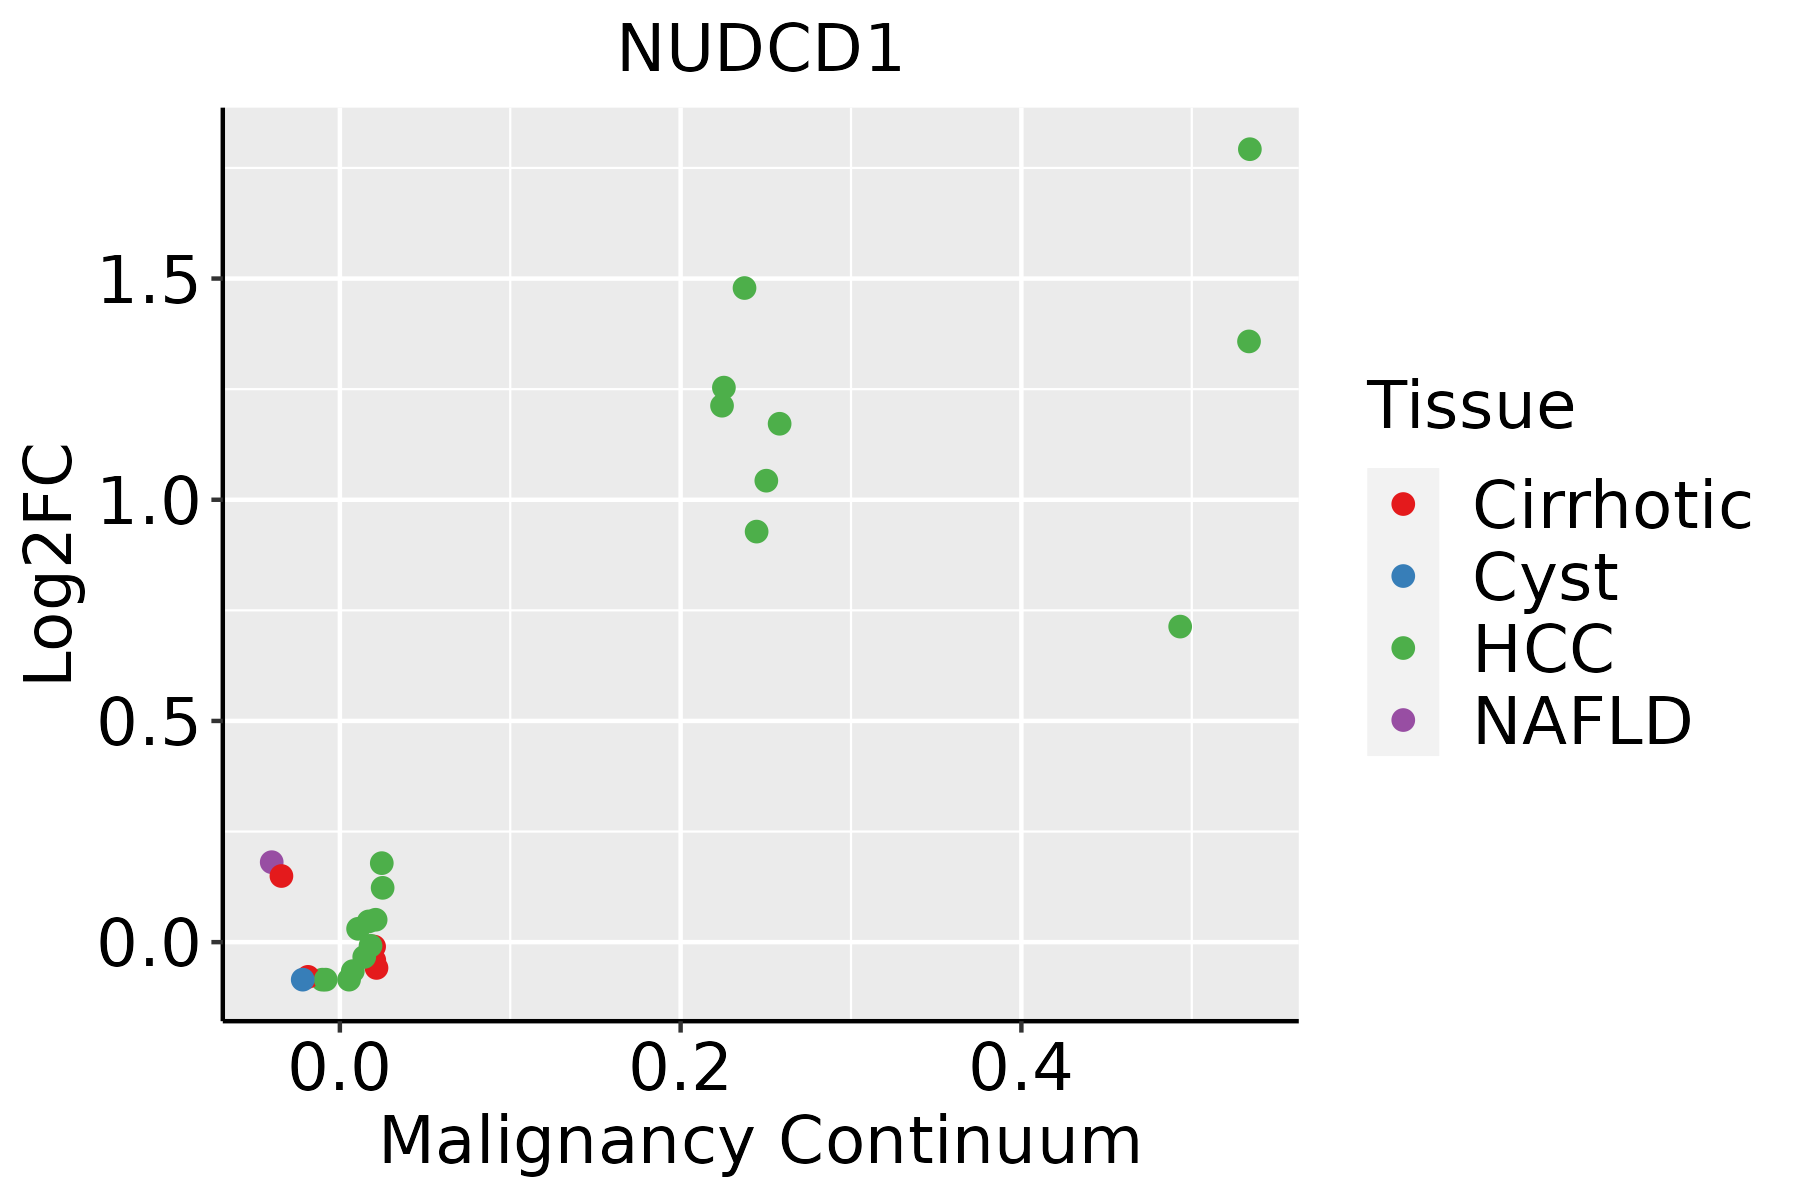 | HCC: Hepatocellular carcinoma |
| NAFLD: Non-alcoholic fatty liver disease | ||
| Oral Cavity |  | EOLP: Erosive Oral lichen planus |
| LP: leukoplakia | ||
| NEOLP: Non-erosive oral lichen planus | ||
| OSCC: Oral squamous cell carcinoma | ||
| Skin | 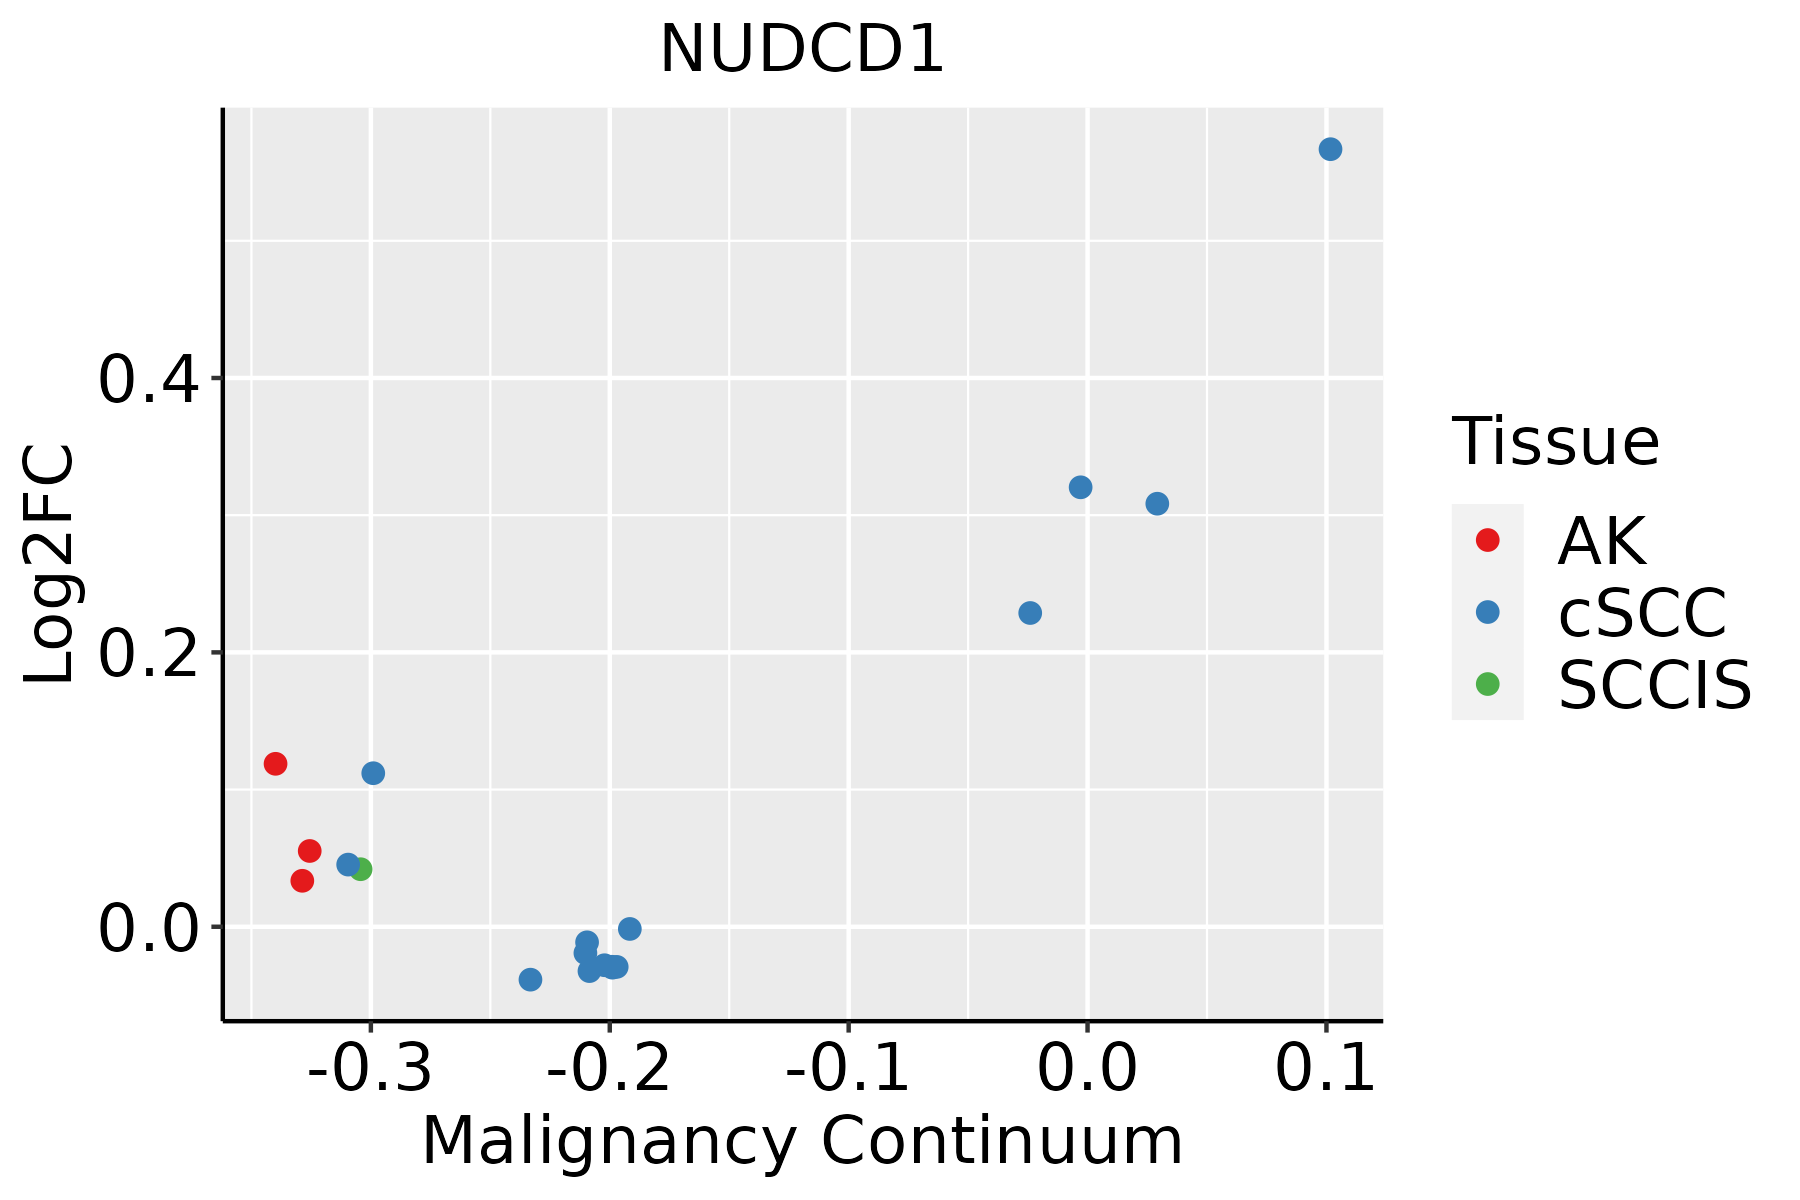 | AK: Actinic keratosis |
| cSCC: Cutaneous squamous cell carcinoma | ||
| SCCIS:squamous cell carcinoma in situ | ||
| Thyroid |  | ATC: Anaplastic thyroid cancer |
| HT: Hashimoto's thyroiditis | ||
| PTC: Papillary thyroid cancer |
| ∗log2FC in expression of this searched gene in stem-like cells from each diseased tissue sample relative to stem-like cells in normal samples in each tissue plotted against the malignancy continuum. Samples are colored based on if they are from different disease stage. |
Top |
Malignant transformation related pathway analysis |
| Find out the enriched GO biological processes and KEGG pathways involved in transition from healthy to precancer to cancer |
| Tissue | Disease Stage | Enriched GO biological Processes |
| Colorectum | AD |  |
| Colorectum | SER |  |
| Colorectum | MSS |  |
| Colorectum | MSI-H |  |
| Colorectum | FAP |  |
| ∗Top 15 enriched GO BP terms are showed in the bar plot of each disease state in each tissue. Each row represents a significant GO biological process which is colored according to the -log10(p.adjust). |
| Page: 1 2 3 4 5 6 7 8 9 |
| GO ID | Tissue | Disease Stage | Description | Gene Ratio | Bg Ratio | pvalue | p.adjust | Count |
| Page: 1 |
| Pathway ID | Tissue | Disease Stage | Description | Gene Ratio | Bg Ratio | pvalue | p.adjust | qvalue | Count |
| Page: 1 |
Top |
Cell-cell communication analysis |
| Identification of potential cell-cell interactions between two cell types and their ligand-receptor pairs for different disease states |
| Ligand | Receptor | LRpair | Pathway | Tissue | Disease Stage |
| Page: 1 |
Top |
Single-cell gene regulatory network inference analysis |
| Find out the significant the regulons (TFs) and the target genes of each regulon across cell types for different disease states |
| TF | Cell Type | Tissue | Disease Stage | Target Gene | RSS | Regulon Activity |
| ∗The dot plots of a searched regulon are shown for all cell subpopulations in each disease state of each tissue based on the regulon specific score inferred using pySCENIC and by calculating the average expression. |
| Page: 1 |
Top |
Somatic mutation of malignant transformation related genes |
| Annotation of somatic variants for genes involved in malignant transformation |
| Hugo Symbol | Variant Class | Variant Classification | dbSNP RS | HGVSc | HGVSp | HGVSp Short | SWISSPROT | BIOTYPE | SIFT | PolyPhen | Tumor Sample Barcode | Tissue | Histology | Sex | Age | Stage | Therapy Types | Drugs | Outcome |
| NUDCD1 | SNV | Missense_Mutation | c.1152N>C | p.Met384Ile | p.M384I | Q96RS6 | protein_coding | tolerated(0.48) | benign(0.003) | TCGA-A2-A1FW-01 | Breast | breast invasive carcinoma | Female | <65 | III/IV | Chemotherapy | cytoxan | SD | |
| NUDCD1 | SNV | Missense_Mutation | rs543121980 | c.850N>A | p.Glu284Lys | p.E284K | Q96RS6 | protein_coding | tolerated(0.49) | benign(0.346) | TCGA-A8-A0A7-01 | Breast | breast invasive carcinoma | Female | <65 | I/II | Unknown | Unknown | SD |
| NUDCD1 | SNV | Missense_Mutation | c.1554N>A | p.Phe518Leu | p.F518L | Q96RS6 | protein_coding | deleterious(0.01) | possibly_damaging(0.76) | TCGA-AC-A23H-01 | Breast | breast invasive carcinoma | Female | >=65 | I/II | Unknown | Unknown | PD | |
| NUDCD1 | SNV | Missense_Mutation | c.1643N>G | p.Ala548Gly | p.A548G | Q96RS6 | protein_coding | deleterious(0.01) | benign(0.133) | TCGA-BH-A0BZ-01 | Breast | breast invasive carcinoma | Female | <65 | III/IV | Chemotherapy | doxorubicin | CR | |
| NUDCD1 | SNV | Missense_Mutation | c.571N>A | p.Glu191Lys | p.E191K | Q96RS6 | protein_coding | deleterious(0.03) | benign(0.217) | TCGA-D8-A1J8-01 | Breast | breast invasive carcinoma | Female | >=65 | I/II | Hormone Therapy | nolvadex | SD | |
| NUDCD1 | deletion | Frame_Shift_Del | novel | c.1457delT | p.Leu486Ter | p.L486* | Q96RS6 | protein_coding | TCGA-EW-A2FV-01 | Breast | breast invasive carcinoma | Female | <65 | III/IV | Chemotherapy | docetaxel | SD | ||
| NUDCD1 | SNV | Missense_Mutation | c.488N>A | p.Pro163His | p.P163H | Q96RS6 | protein_coding | deleterious(0) | probably_damaging(0.999) | TCGA-A6-6654-01 | Colorectum | colon adenocarcinoma | Female | >=65 | III/IV | Chemotherapy | oxaliplatin | SD | |
| NUDCD1 | SNV | Missense_Mutation | novel | c.589N>C | p.Ser197Arg | p.S197R | Q96RS6 | protein_coding | deleterious(0) | probably_damaging(0.964) | TCGA-AA-3984-01 | Colorectum | colon adenocarcinoma | Female | <65 | I/II | Unknown | Unknown | SD |
| NUDCD1 | SNV | Missense_Mutation | novel | c.544N>G | p.Thr182Ala | p.T182A | Q96RS6 | protein_coding | tolerated(0.11) | benign(0) | TCGA-AD-6964-01 | Colorectum | colon adenocarcinoma | Male | <65 | III/IV | Chemotherapy | folfox | PD |
| NUDCD1 | SNV | Missense_Mutation | novel | c.1746N>T | p.Glu582Asp | p.E582D | Q96RS6 | protein_coding | tolerated(0.48) | benign(0) | TCGA-CA-6717-01 | Colorectum | colon adenocarcinoma | Male | <65 | I/II | Chemotherapy | oxaliplatin | CR |
| Page: 1 2 3 4 5 6 7 8 |
Top |
Related drugs of malignant transformation related genes |
| Identification of chemicals and drugs interact with genes involved in malignant transfromation |
| (DGIdb 4.0) |
| Entrez ID | Symbol | Category | Interaction Types | Drug Claim Name | Drug Name | PMIDs |
| Page: 1 |

Copyright 2023-Present -The University of Texas Health Science Center at Houston |