
|
|||||
|
 | |
| |
| |
| |
| |
| |
|
Gene: NUDC |
Gene summary for NUDC |
| Gene information | Species | Human | Gene symbol | NUDC | Gene ID | 10726 |
| Gene name | nuclear distribution C, dynein complex regulator | |
| Gene Alias | HNUDC | |
| Cytomap | 1p36.11 | |
| Gene Type | protein-coding | GO ID | GO:0000070 | UniProtAcc | Q9Y266 |
Top |
Malignant transformation analysis |
| Identification of the aberrant gene expression in precancerous and cancerous lesions by comparing the gene expression of stem-like cells in diseased tissues with normal stem cells |
| Entrez ID | Symbol | Replicates | Species | Organ | Tissue | Adj P-value | Log2FC | Malignancy |
| 10726 | NUDC | GSM4909282 | Human | Breast | IDC | 1.52e-10 | 3.89e-01 | -0.0288 |
| 10726 | NUDC | GSM4909296 | Human | Breast | IDC | 8.44e-06 | -9.34e-02 | 0.1524 |
| 10726 | NUDC | GSM4909297 | Human | Breast | IDC | 1.88e-11 | -2.62e-02 | 0.1517 |
| 10726 | NUDC | GSM4909311 | Human | Breast | IDC | 1.98e-27 | -3.98e-01 | 0.1534 |
| 10726 | NUDC | GSM4909312 | Human | Breast | IDC | 6.43e-11 | -2.79e-01 | 0.1552 |
| 10726 | NUDC | GSM4909318 | Human | Breast | IDC | 2.85e-02 | 1.66e-01 | 0.2031 |
| 10726 | NUDC | GSM4909319 | Human | Breast | IDC | 4.13e-39 | -1.78e-01 | 0.1563 |
| 10726 | NUDC | GSM4909320 | Human | Breast | IDC | 3.51e-06 | -1.28e-01 | 0.1575 |
| 10726 | NUDC | GSM4909321 | Human | Breast | IDC | 1.76e-11 | 5.69e-02 | 0.1559 |
| 10726 | NUDC | brca1 | Human | Breast | Precancer | 9.31e-18 | 5.35e-01 | -0.0338 |
| 10726 | NUDC | brca2 | Human | Breast | Precancer | 1.72e-17 | 4.43e-01 | -0.024 |
| 10726 | NUDC | brca3 | Human | Breast | Precancer | 8.92e-10 | 3.89e-01 | -0.0263 |
| 10726 | NUDC | M2 | Human | Breast | IDC | 8.04e-03 | 8.61e-02 | 0.21 |
| 10726 | NUDC | NCCBC11 | Human | Breast | DCIS | 2.15e-02 | 1.75e-01 | 0.1232 |
| 10726 | NUDC | NCCBC14 | Human | Breast | DCIS | 1.52e-11 | -7.65e-03 | 0.2021 |
| 10726 | NUDC | NCCBC2 | Human | Breast | DCIS | 5.86e-03 | -2.00e-01 | 0.1554 |
| 10726 | NUDC | NCCBC5 | Human | Breast | DCIS | 4.01e-14 | -2.16e-04 | 0.2046 |
| 10726 | NUDC | P1 | Human | Breast | IDC | 2.89e-25 | -2.72e-01 | 0.1527 |
| 10726 | NUDC | P2 | Human | Breast | IDC | 3.28e-14 | 5.17e-01 | 0.21 |
| 10726 | NUDC | DCIS2 | Human | Breast | DCIS | 2.23e-61 | 1.95e-01 | 0.0085 |
| Page: 1 2 3 4 5 6 7 8 9 10 11 |
| Tissue | Expression Dynamics | Abbreviation |
| Breast |  | IDC: Invasive ductal carcinoma |
| DCIS: Ductal carcinoma in situ | ||
| Precancer(BRCA1-mut): Precancerous lesion from BRCA1 mutation carriers | ||
| Colorectum (GSE201348) |  | FAP: Familial adenomatous polyposis |
| CRC: Colorectal cancer | ||
| Colorectum (HTA11) |  | AD: Adenomas |
| SER: Sessile serrated lesions | ||
| MSI-H: Microsatellite-high colorectal cancer | ||
| MSS: Microsatellite stable colorectal cancer | ||
| Endometrium |  | AEH: Atypical endometrial hyperplasia |
| EEC: Endometrioid Cancer | ||
| Esophagus | 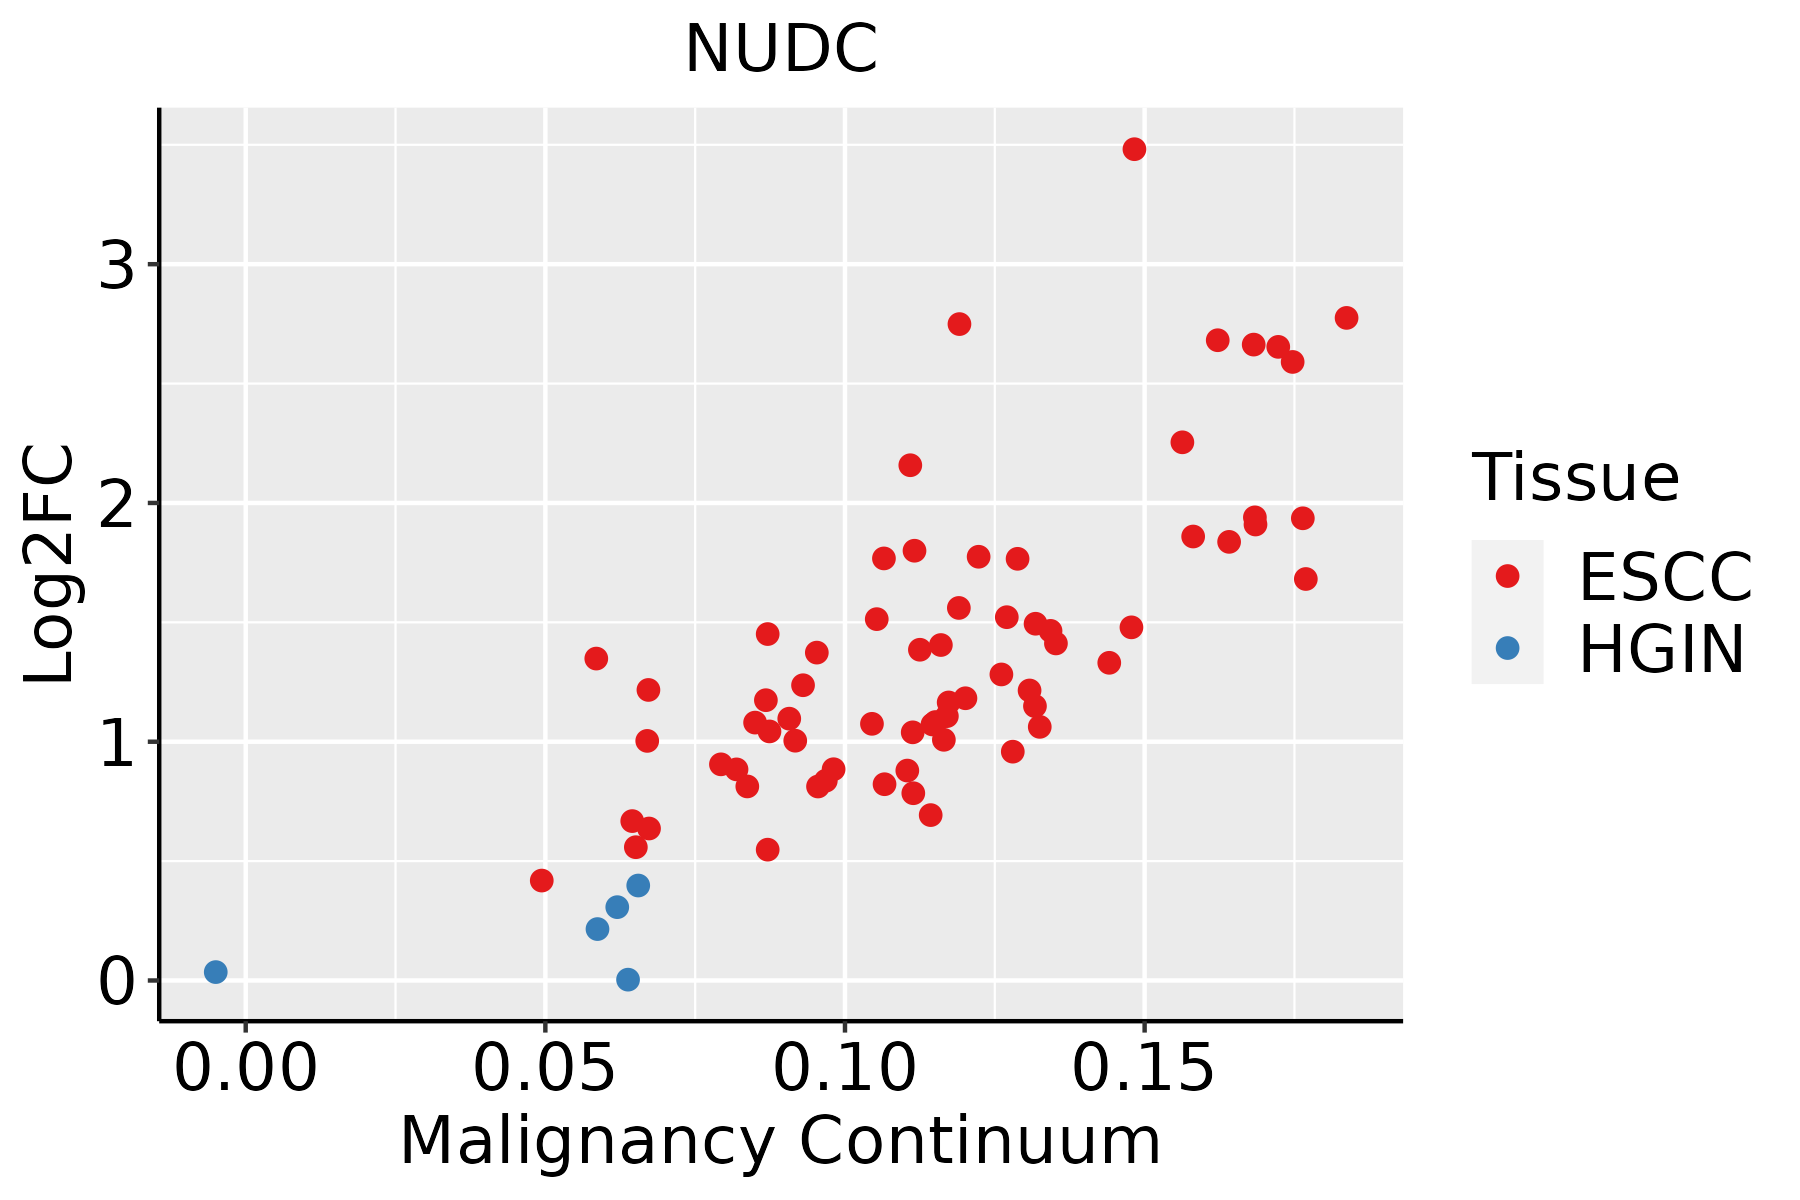 | ESCC: Esophageal squamous cell carcinoma |
| HGIN: High-grade intraepithelial neoplasias | ||
| LGIN: Low-grade intraepithelial neoplasias | ||
| Liver | 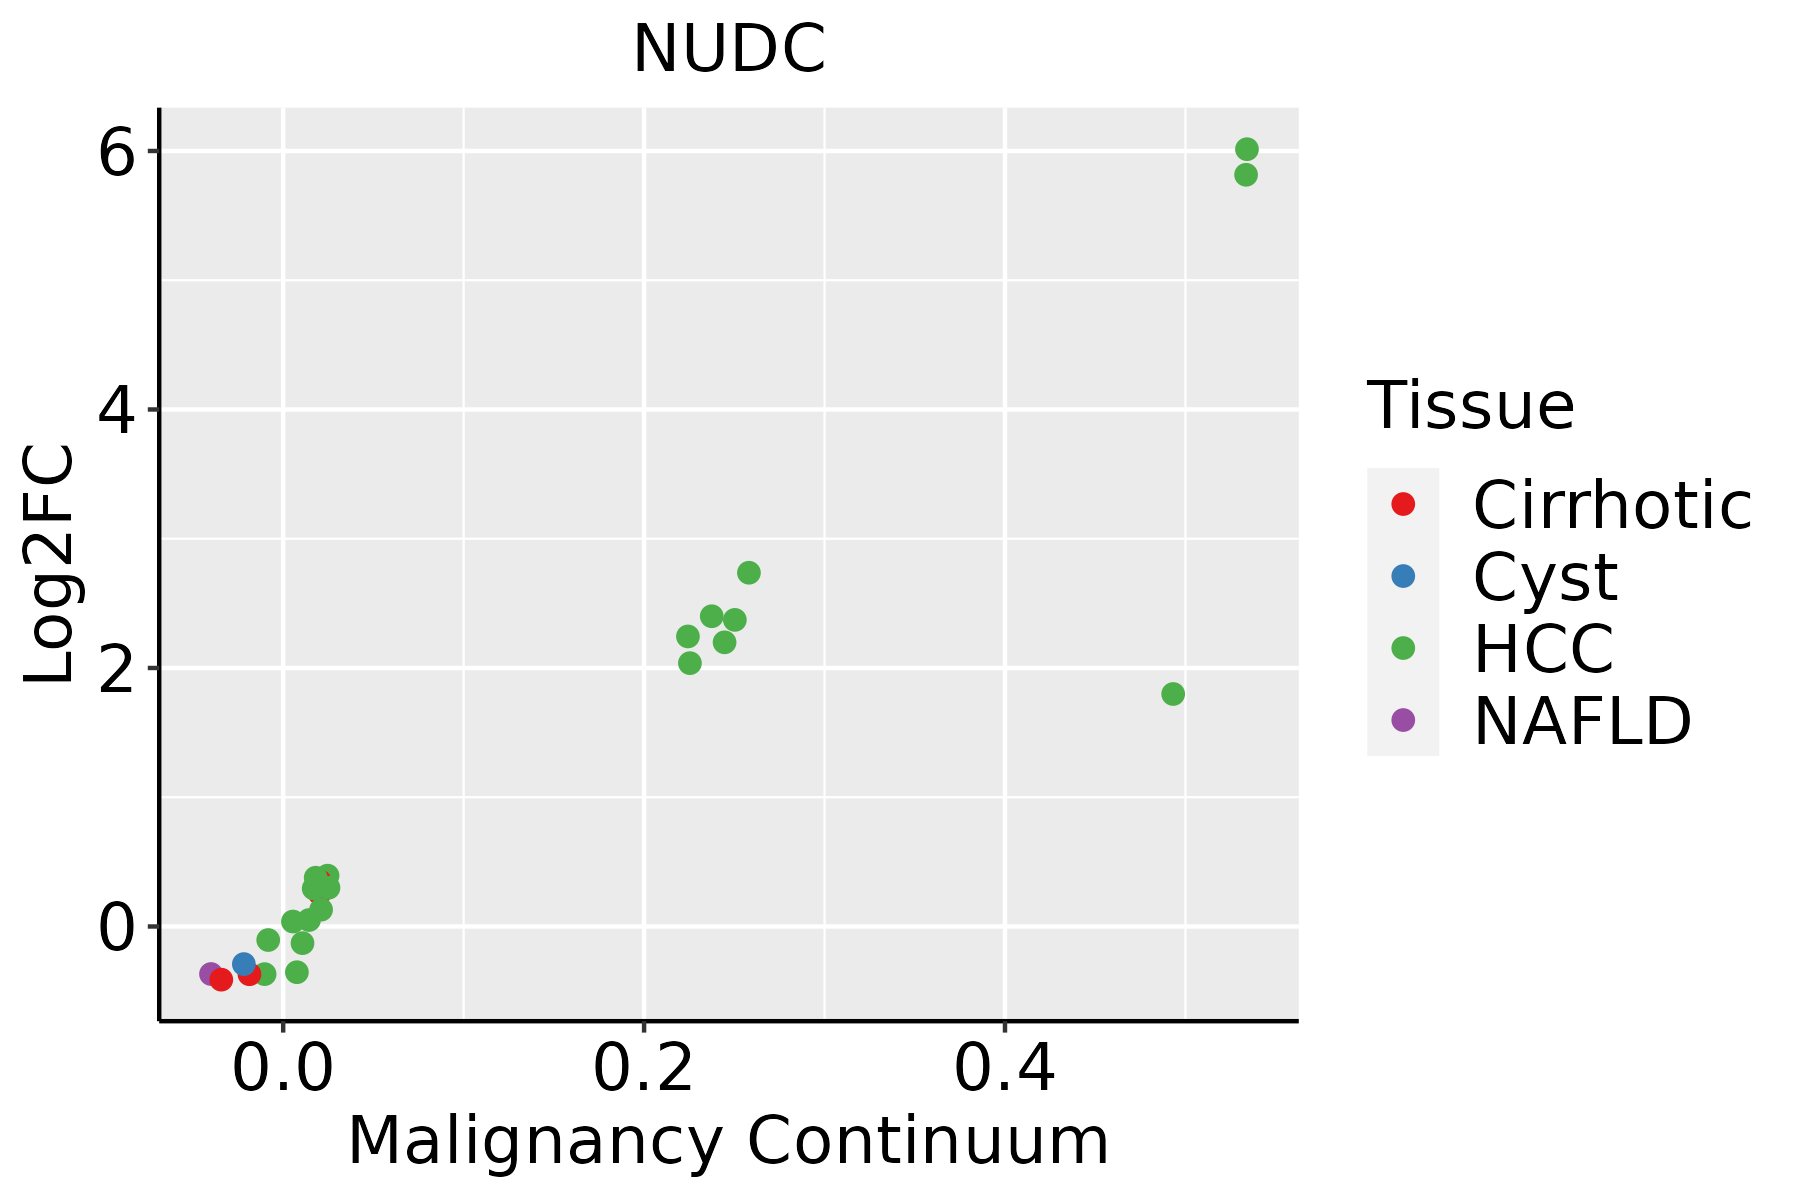 | HCC: Hepatocellular carcinoma |
| NAFLD: Non-alcoholic fatty liver disease | ||
| Oral Cavity |  | EOLP: Erosive Oral lichen planus |
| LP: leukoplakia | ||
| NEOLP: Non-erosive oral lichen planus | ||
| OSCC: Oral squamous cell carcinoma | ||
| Prostate |  | BPH: Benign Prostatic Hyperplasia |
| Skin | 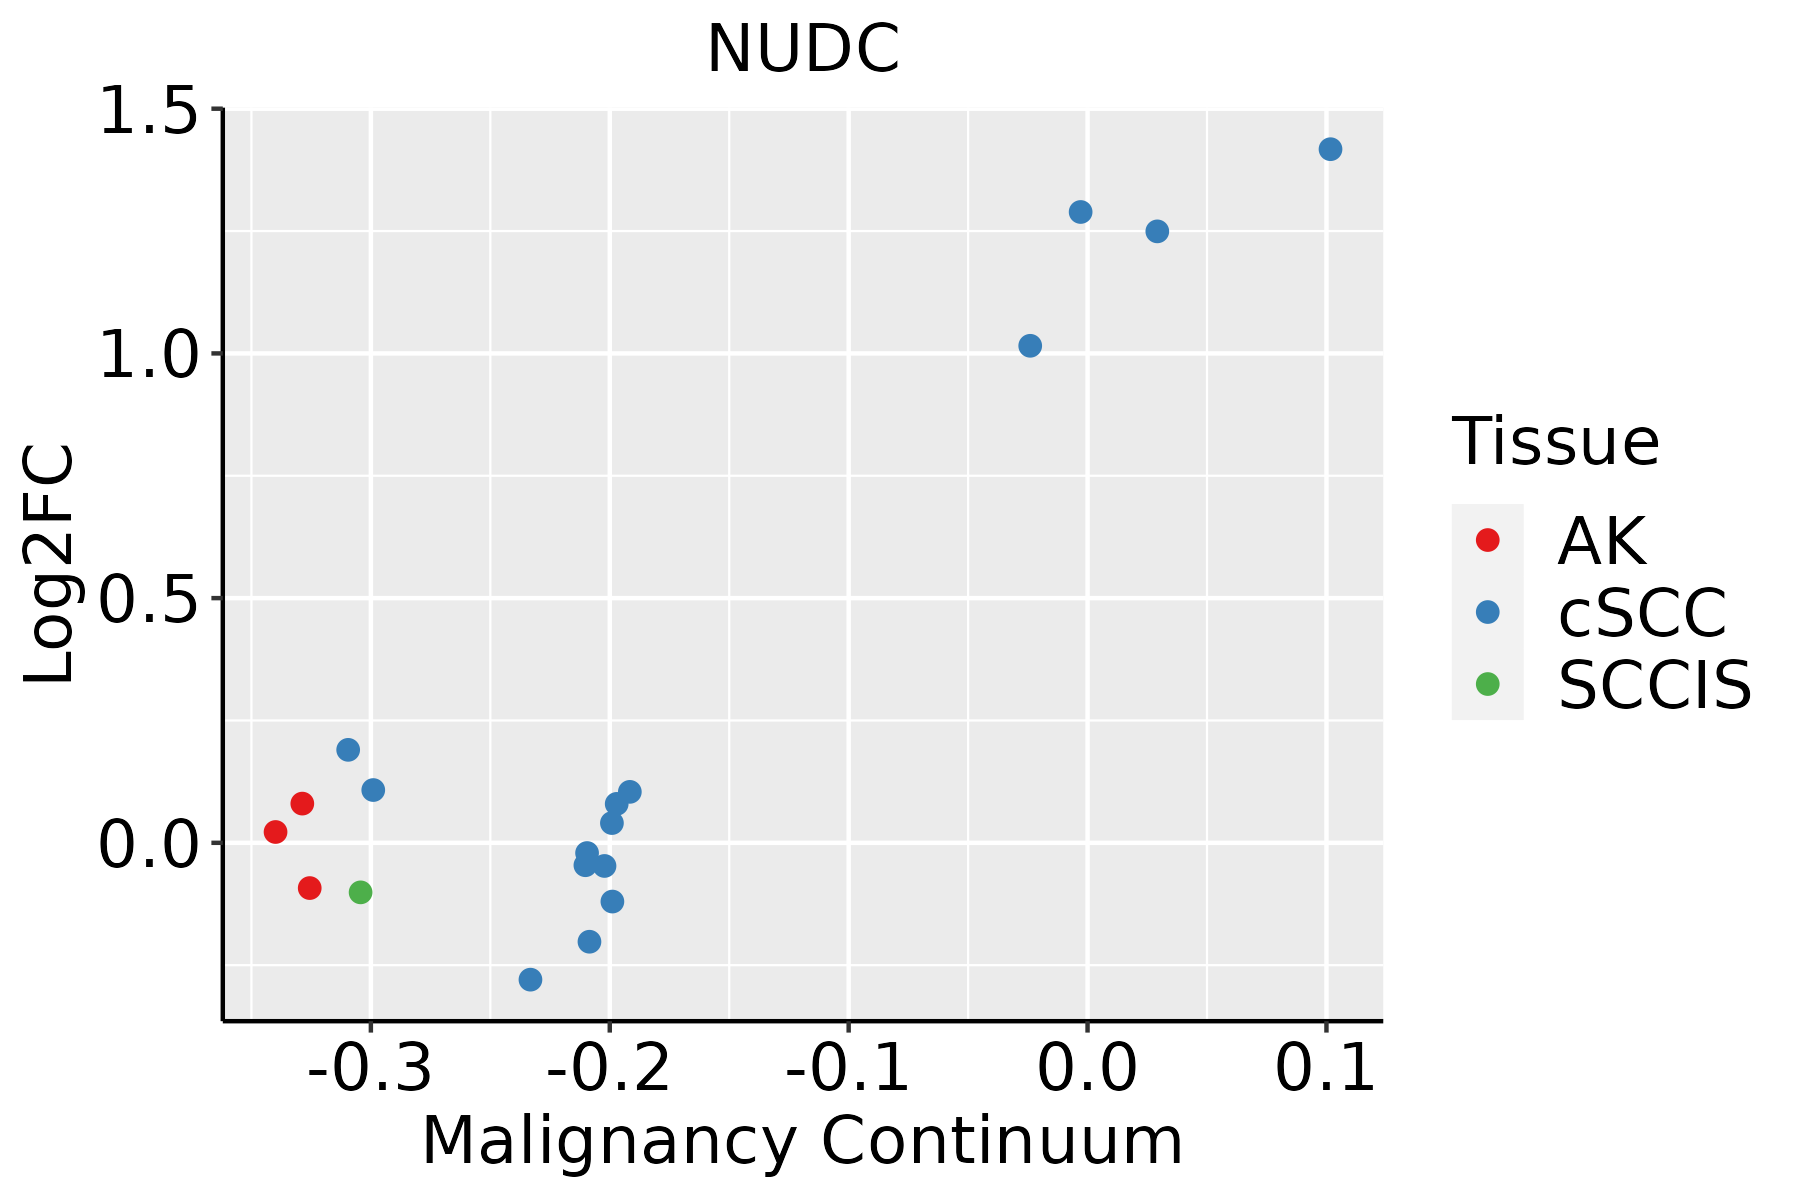 | AK: Actinic keratosis |
| cSCC: Cutaneous squamous cell carcinoma | ||
| SCCIS:squamous cell carcinoma in situ | ||
| Thyroid | 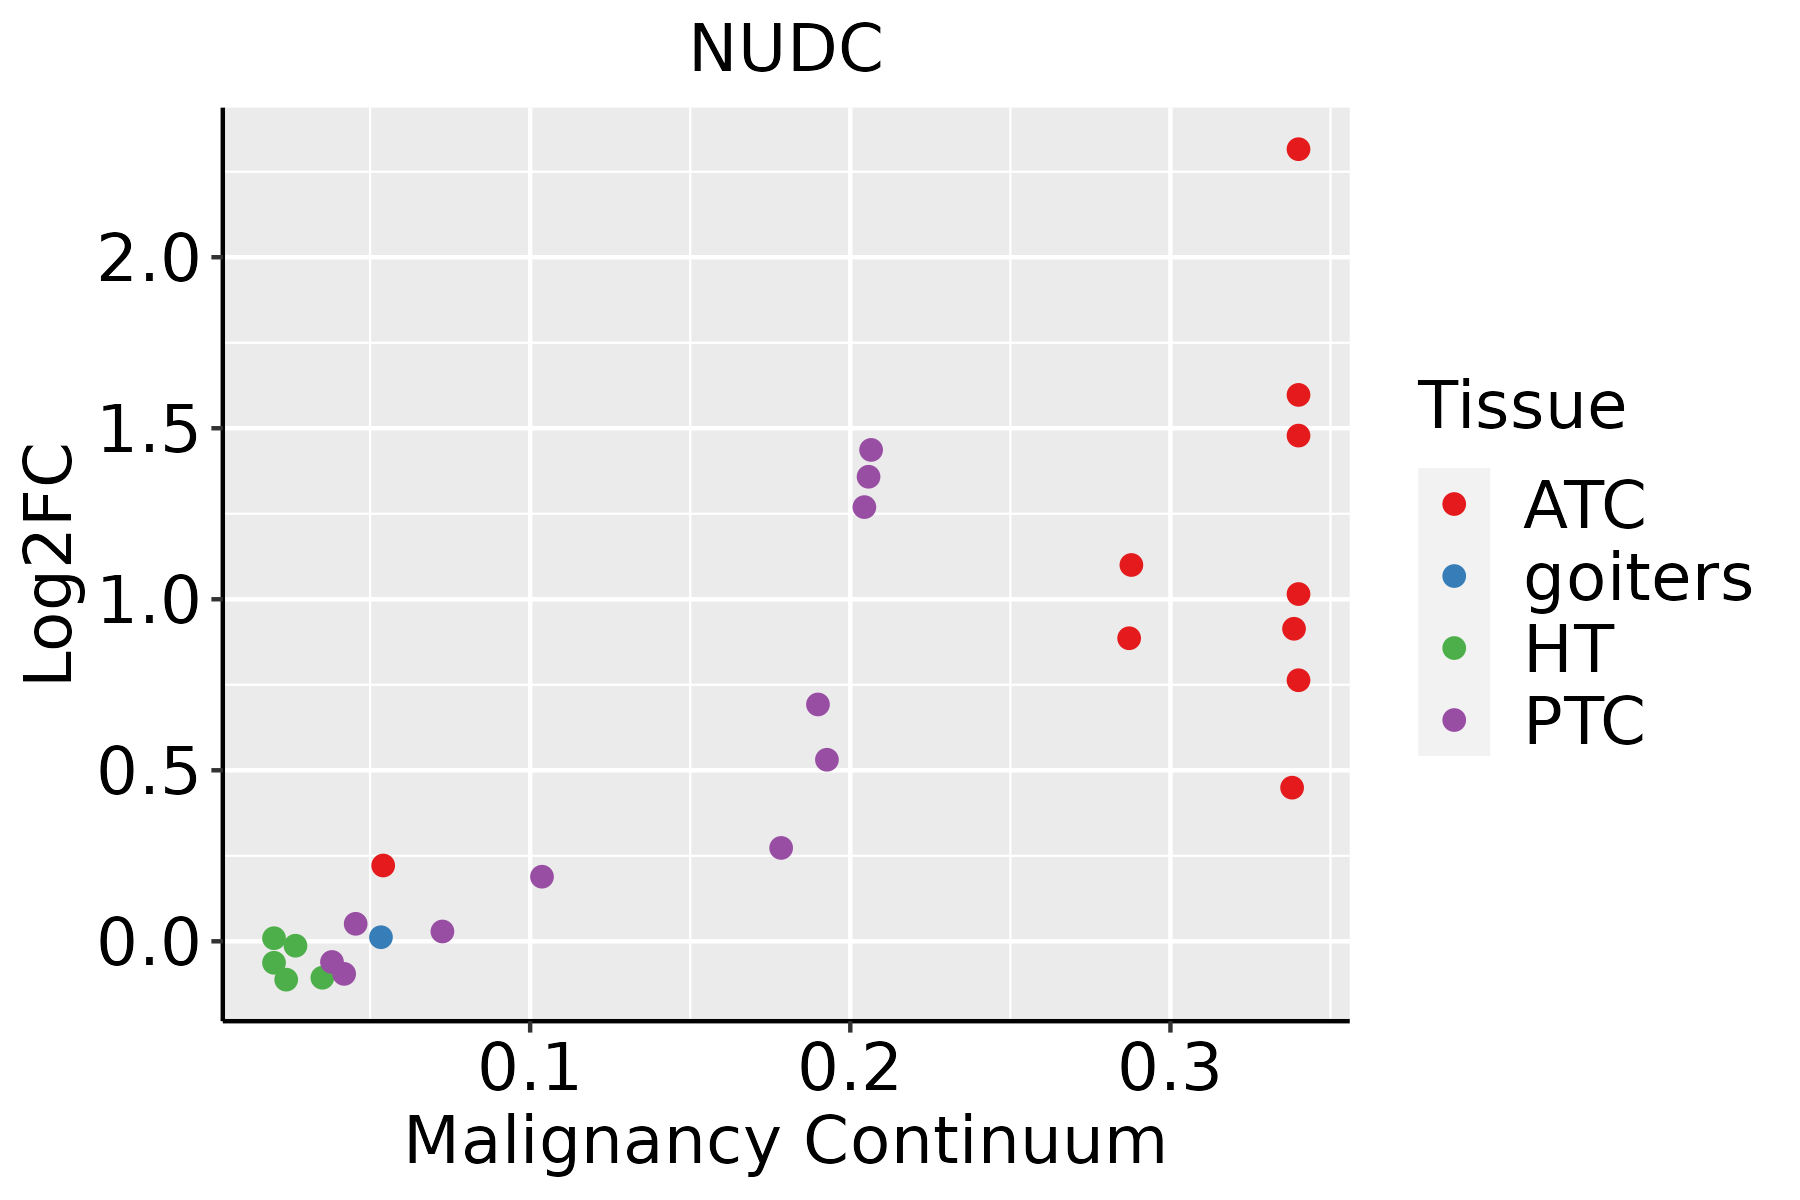 | ATC: Anaplastic thyroid cancer |
| HT: Hashimoto's thyroiditis | ||
| PTC: Papillary thyroid cancer |
| ∗log2FC in expression of this searched gene in stem-like cells from each diseased tissue sample relative to stem-like cells in normal samples in each tissue plotted against the malignancy continuum. Samples are colored based on if they are from different disease stage. |
Top |
Malignant transformation related pathway analysis |
| Find out the enriched GO biological processes and KEGG pathways involved in transition from healthy to precancer to cancer |
| Tissue | Disease Stage | Enriched GO biological Processes |
| Colorectum | AD |  |
| Colorectum | SER |  |
| Colorectum | MSS |  |
| Colorectum | MSI-H |  |
| Colorectum | FAP |  |
| ∗Top 15 enriched GO BP terms are showed in the bar plot of each disease state in each tissue. Each row represents a significant GO biological process which is colored according to the -log10(p.adjust). |
| Page: 1 2 3 4 5 6 7 8 9 |
| GO ID | Tissue | Disease Stage | Description | Gene Ratio | Bg Ratio | pvalue | p.adjust | Count |
| GO:00064578 | Breast | Precancer | protein folding | 43/1080 | 212/18723 | 3.48e-13 | 7.45e-11 | 43 |
| GO:000645713 | Breast | IDC | protein folding | 47/1434 | 212/18723 | 2.31e-11 | 3.86e-09 | 47 |
| GO:000645723 | Breast | DCIS | protein folding | 47/1390 | 212/18723 | 7.84e-12 | 1.53e-09 | 47 |
| GO:0051656 | Colorectum | AD | establishment of organelle localization | 131/3918 | 390/18723 | 3.00e-09 | 2.06e-07 | 131 |
| GO:0006457 | Colorectum | AD | protein folding | 73/3918 | 212/18723 | 3.24e-06 | 9.10e-05 | 73 |
| GO:0007051 | Colorectum | AD | spindle organization | 58/3918 | 184/18723 | 4.71e-04 | 5.20e-03 | 58 |
| GO:1902850 | Colorectum | AD | microtubule cytoskeleton organization involved in mitosis | 48/3918 | 147/18723 | 5.87e-04 | 6.21e-03 | 48 |
| GO:0007052 | Colorectum | AD | mitotic spindle organization | 40/3918 | 120/18723 | 1.03e-03 | 9.61e-03 | 40 |
| GO:0140014 | Colorectum | AD | mitotic nuclear division | 78/3918 | 287/18723 | 6.48e-03 | 4.05e-02 | 78 |
| GO:00516561 | Colorectum | SER | establishment of organelle localization | 100/2897 | 390/18723 | 1.11e-07 | 6.79e-06 | 100 |
| GO:00064571 | Colorectum | SER | protein folding | 54/2897 | 212/18723 | 1.04e-04 | 2.18e-03 | 54 |
| GO:00516562 | Colorectum | MSS | establishment of organelle localization | 115/3467 | 390/18723 | 7.30e-08 | 3.67e-06 | 115 |
| GO:00064572 | Colorectum | MSS | protein folding | 71/3467 | 212/18723 | 1.25e-07 | 5.91e-06 | 71 |
| GO:00070511 | Colorectum | MSS | spindle organization | 53/3467 | 184/18723 | 4.23e-04 | 5.19e-03 | 53 |
| GO:19028501 | Colorectum | MSS | microtubule cytoskeleton organization involved in mitosis | 44/3467 | 147/18723 | 5.17e-04 | 5.98e-03 | 44 |
| GO:00070521 | Colorectum | MSS | mitotic spindle organization | 36/3467 | 120/18723 | 1.52e-03 | 1.39e-02 | 36 |
| GO:01400141 | Colorectum | MSS | mitotic nuclear division | 70/3467 | 287/18723 | 7.48e-03 | 4.72e-02 | 70 |
| GO:00516563 | Colorectum | FAP | establishment of organelle localization | 97/2622 | 390/18723 | 5.91e-09 | 9.48e-07 | 97 |
| GO:00070512 | Colorectum | FAP | spindle organization | 41/2622 | 184/18723 | 1.50e-03 | 1.34e-02 | 41 |
| GO:00064574 | Colorectum | FAP | protein folding | 44/2622 | 212/18723 | 4.36e-03 | 2.98e-02 | 44 |
| Page: 1 2 3 4 5 6 7 8 9 10 |
| Pathway ID | Tissue | Disease Stage | Description | Gene Ratio | Bg Ratio | pvalue | p.adjust | qvalue | Count |
| Page: 1 |
Top |
Cell-cell communication analysis |
| Identification of potential cell-cell interactions between two cell types and their ligand-receptor pairs for different disease states |
| Ligand | Receptor | LRpair | Pathway | Tissue | Disease Stage |
| Page: 1 |
Top |
Single-cell gene regulatory network inference analysis |
| Find out the significant the regulons (TFs) and the target genes of each regulon across cell types for different disease states |
| TF | Cell Type | Tissue | Disease Stage | Target Gene | RSS | Regulon Activity |
| ∗The dot plots of a searched regulon are shown for all cell subpopulations in each disease state of each tissue based on the regulon specific score inferred using pySCENIC and by calculating the average expression. |
| Page: 1 |
Top |
Somatic mutation of malignant transformation related genes |
| Annotation of somatic variants for genes involved in malignant transformation |
| Hugo Symbol | Variant Class | Variant Classification | dbSNP RS | HGVSc | HGVSp | HGVSp Short | SWISSPROT | BIOTYPE | SIFT | PolyPhen | Tumor Sample Barcode | Tissue | Histology | Sex | Age | Stage | Therapy Types | Drugs | Outcome |
| NUDC | insertion | Frame_Shift_Ins | novel | c.267_268insAAGCATCACTTTTTAAAACAGCCAGTTTATTG | p.Arg90LysfsTer11 | p.R90Kfs*11 | Q9Y266 | protein_coding | TCGA-A2-A0CM-01 | Breast | breast invasive carcinoma | Female | <65 | I/II | Chemotherapy | adriamycin | PD | ||
| NUDC | insertion | Nonsense_Mutation | novel | c.557_558insCAAGATGGTGAAACCCCATCTCTACTAAAAATACAAAAA | p.Pro186_Phe187insLysMetValLysProHisLeuTyrTerLysTyrLysAsn | p.P186_F187insKMVKPHLY*KYKN | Q9Y266 | protein_coding | TCGA-B6-A0I9-01 | Breast | breast invasive carcinoma | Female | <65 | III/IV | Unknown | Unknown | PD | ||
| NUDC | insertion | Nonsense_Mutation | novel | c.613_614insATCTCTACTAAAAATACAAAAATTAGCCA | p.Arg205HisfsTer4 | p.R205Hfs*4 | Q9Y266 | protein_coding | TCGA-B6-A0RE-01 | Breast | breast invasive carcinoma | Female | <65 | I/II | Unknown | Unknown | SD | ||
| NUDC | SNV | Missense_Mutation | novel | c.743N>C | p.Ile248Thr | p.I248T | Q9Y266 | protein_coding | deleterious(0.03) | benign(0.036) | TCGA-C5-A2LV-01 | Cervix | cervical & endocervical cancer | Female | <65 | I/II | Unknown | Unknown | SD |
| NUDC | SNV | Missense_Mutation | novel | c.814N>A | p.Glu272Lys | p.E272K | Q9Y266 | protein_coding | deleterious(0) | probably_damaging(0.987) | TCGA-VS-A8EL-01 | Cervix | cervical & endocervical cancer | Female | <65 | I/II | Chemotherapy | cisplatin | CR |
| NUDC | SNV | Missense_Mutation | rs556308052 | c.130N>G | p.Ile44Val | p.I44V | Q9Y266 | protein_coding | tolerated(0.29) | benign(0.003) | TCGA-A6-6780-01 | Colorectum | colon adenocarcinoma | Male | >=65 | I/II | Unknown | Unknown | SD |
| NUDC | SNV | Missense_Mutation | c.344N>G | p.Leu115Arg | p.L115R | Q9Y266 | protein_coding | deleterious(0.02) | probably_damaging(0.977) | TCGA-AD-6889-01 | Colorectum | colon adenocarcinoma | Male | >=65 | I/II | Chemotherapy | xeloda | PD | |
| NUDC | SNV | Missense_Mutation | c.484N>G | p.Asn162Asp | p.N162D | Q9Y266 | protein_coding | deleterious(0) | probably_damaging(0.992) | TCGA-AZ-6598-01 | Colorectum | colon adenocarcinoma | Female | >=65 | I/II | Unknown | Unknown | SD | |
| NUDC | SNV | Missense_Mutation | c.911C>T | p.Ser304Leu | p.S304L | Q9Y266 | protein_coding | deleterious(0) | probably_damaging(0.995) | TCGA-AG-4015-01 | Colorectum | rectum adenocarcinoma | Female | >=65 | I/II | Unknown | Unknown | SD | |
| NUDC | SNV | Missense_Mutation | rs757295638 | c.916N>A | p.Glu306Lys | p.E306K | Q9Y266 | protein_coding | deleterious(0) | probably_damaging(0.943) | TCGA-A5-A0G2-01 | Endometrium | uterine corpus endometrioid carcinoma | Female | <65 | III/IV | Unknown | Unknown | SD |
| Page: 1 2 3 |
Top |
Related drugs of malignant transformation related genes |
| Identification of chemicals and drugs interact with genes involved in malignant transfromation |
| (DGIdb 4.0) |
| Entrez ID | Symbol | Category | Interaction Types | Drug Claim Name | Drug Name | PMIDs |
| Page: 1 |

Copyright 2023-Present -The University of Texas Health Science Center at Houston |