
|
|||||
|
 | |
| |
| |
| |
| |
| |
|
Gene: NUCKS1 |
Gene summary for NUCKS1 |
| Gene information | Species | Human | Gene symbol | NUCKS1 | Gene ID | 64710 |
| Gene name | nuclear casein kinase and cyclin dependent kinase substrate 1 | |
| Gene Alias | JC7 | |
| Cytomap | 1q32.1 | |
| Gene Type | protein-coding | GO ID | GO:0000724 | UniProtAcc | Q9H1E3 |
Top |
Malignant transformation analysis |
| Identification of the aberrant gene expression in precancerous and cancerous lesions by comparing the gene expression of stem-like cells in diseased tissues with normal stem cells |
| Entrez ID | Symbol | Replicates | Species | Organ | Tissue | Adj P-value | Log2FC | Malignancy |
| 64710 | NUCKS1 | GSM4909281 | Human | Breast | IDC | 5.20e-19 | 5.54e-01 | 0.21 |
| 64710 | NUCKS1 | GSM4909282 | Human | Breast | IDC | 4.09e-26 | 5.97e-01 | -0.0288 |
| 64710 | NUCKS1 | GSM4909285 | Human | Breast | IDC | 7.37e-61 | 8.52e-01 | 0.21 |
| 64710 | NUCKS1 | GSM4909287 | Human | Breast | IDC | 1.30e-37 | 6.41e-01 | 0.2057 |
| 64710 | NUCKS1 | GSM4909290 | Human | Breast | IDC | 2.50e-23 | 6.22e-01 | 0.2096 |
| 64710 | NUCKS1 | GSM4909291 | Human | Breast | IDC | 2.01e-08 | 4.09e-01 | 0.1753 |
| 64710 | NUCKS1 | GSM4909293 | Human | Breast | IDC | 4.36e-86 | 9.29e-01 | 0.1581 |
| 64710 | NUCKS1 | GSM4909294 | Human | Breast | IDC | 4.64e-14 | 1.97e-01 | 0.2022 |
| 64710 | NUCKS1 | GSM4909296 | Human | Breast | IDC | 8.72e-18 | 1.79e-01 | 0.1524 |
| 64710 | NUCKS1 | GSM4909297 | Human | Breast | IDC | 8.69e-31 | 1.54e-01 | 0.1517 |
| 64710 | NUCKS1 | GSM4909298 | Human | Breast | IDC | 3.24e-27 | 6.20e-01 | 0.1551 |
| 64710 | NUCKS1 | GSM4909299 | Human | Breast | IDC | 5.41e-03 | 2.96e-01 | 0.035 |
| 64710 | NUCKS1 | GSM4909301 | Human | Breast | IDC | 1.51e-13 | 4.03e-01 | 0.1577 |
| 64710 | NUCKS1 | GSM4909302 | Human | Breast | IDC | 5.74e-26 | 4.87e-01 | 0.1545 |
| 64710 | NUCKS1 | GSM4909305 | Human | Breast | IDC | 3.64e-04 | 3.29e-01 | 0.0436 |
| 64710 | NUCKS1 | GSM4909306 | Human | Breast | IDC | 2.25e-26 | 5.82e-01 | 0.1564 |
| 64710 | NUCKS1 | GSM4909307 | Human | Breast | IDC | 5.99e-25 | 5.58e-01 | 0.1569 |
| 64710 | NUCKS1 | GSM4909308 | Human | Breast | IDC | 5.29e-19 | 5.32e-01 | 0.158 |
| 64710 | NUCKS1 | GSM4909309 | Human | Breast | IDC | 2.55e-12 | 3.24e-01 | 0.0483 |
| 64710 | NUCKS1 | GSM4909311 | Human | Breast | IDC | 3.19e-44 | -1.18e-01 | 0.1534 |
| Page: 1 2 3 4 5 6 7 8 9 10 11 12 13 14 |
| Tissue | Expression Dynamics | Abbreviation |
| Breast |  | IDC: Invasive ductal carcinoma |
| DCIS: Ductal carcinoma in situ | ||
| Precancer(BRCA1-mut): Precancerous lesion from BRCA1 mutation carriers | ||
| Colorectum (GSE201348) | 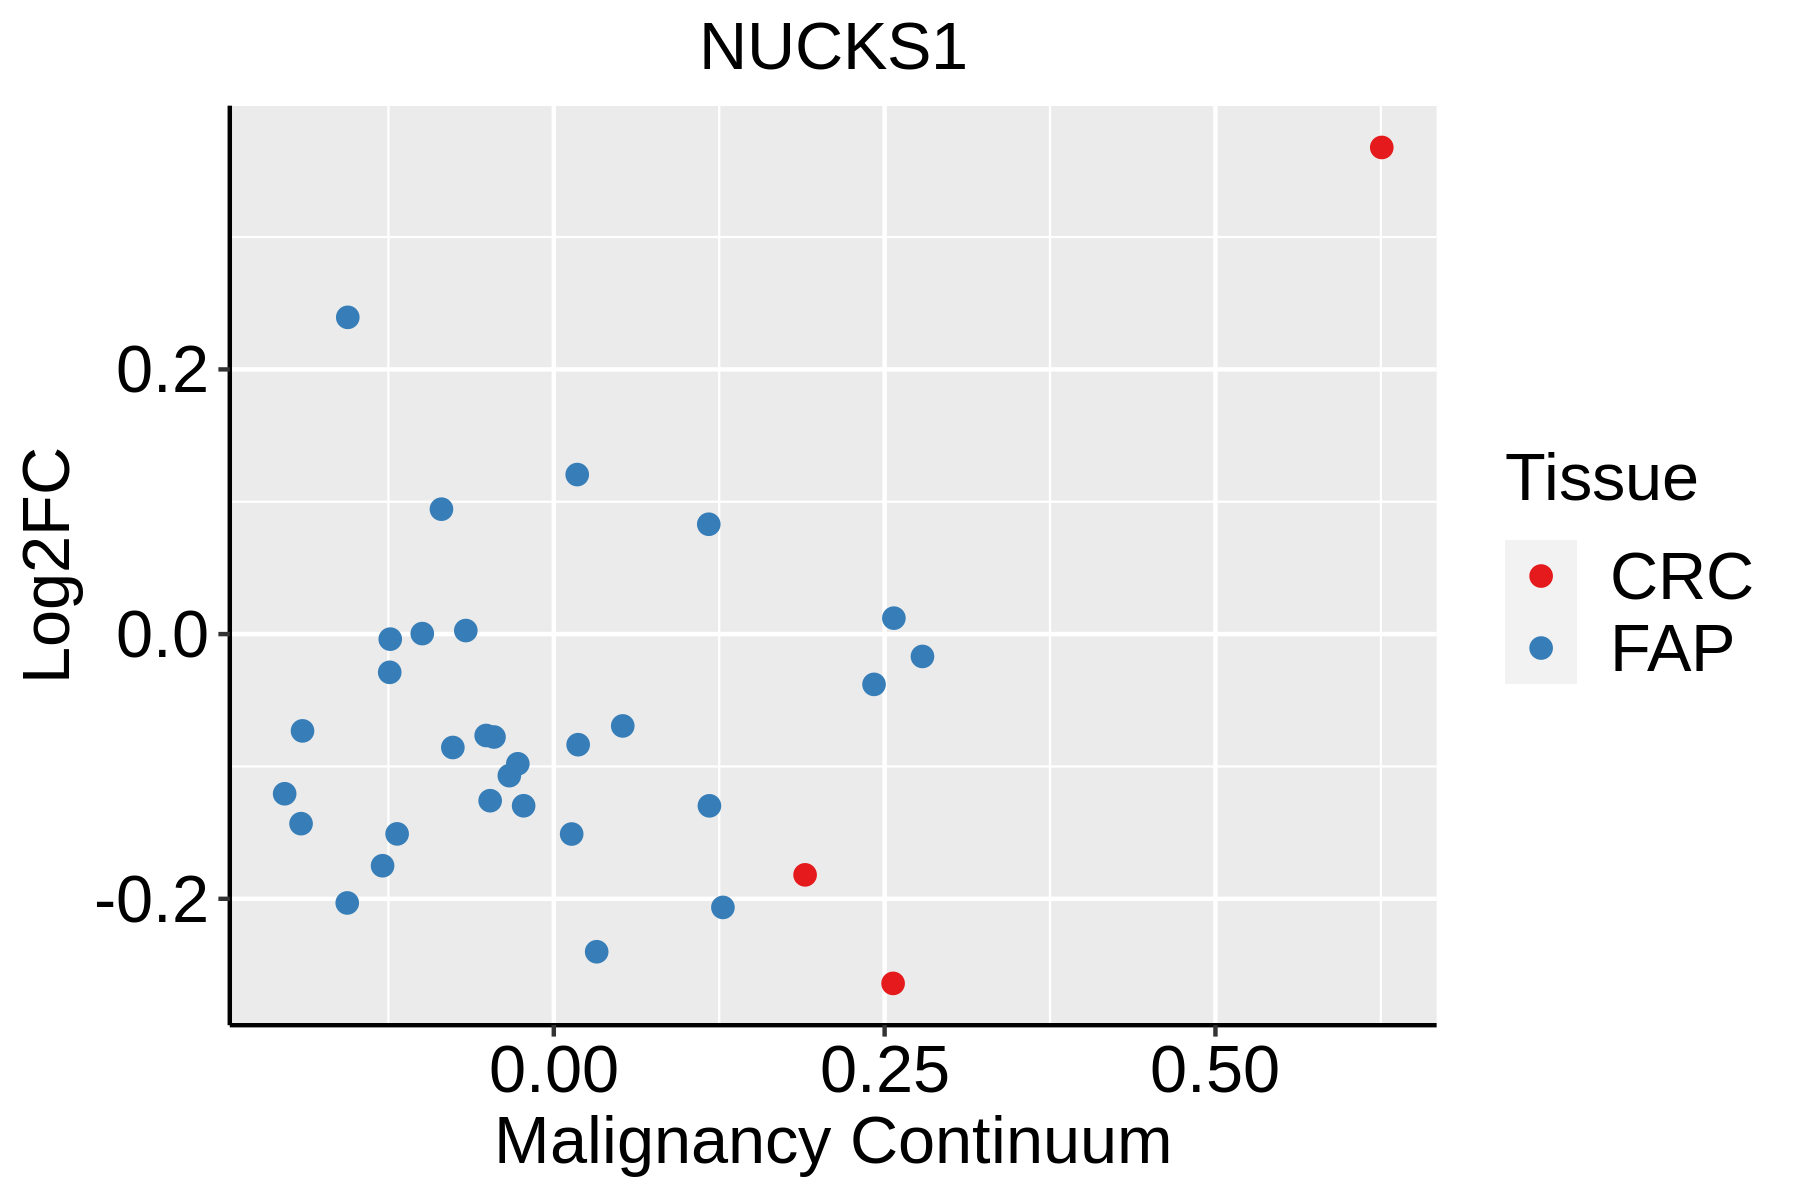 | FAP: Familial adenomatous polyposis |
| CRC: Colorectal cancer | ||
| Colorectum (HTA11) |  | AD: Adenomas |
| SER: Sessile serrated lesions | ||
| MSI-H: Microsatellite-high colorectal cancer | ||
| MSS: Microsatellite stable colorectal cancer | ||
| Endometrium | 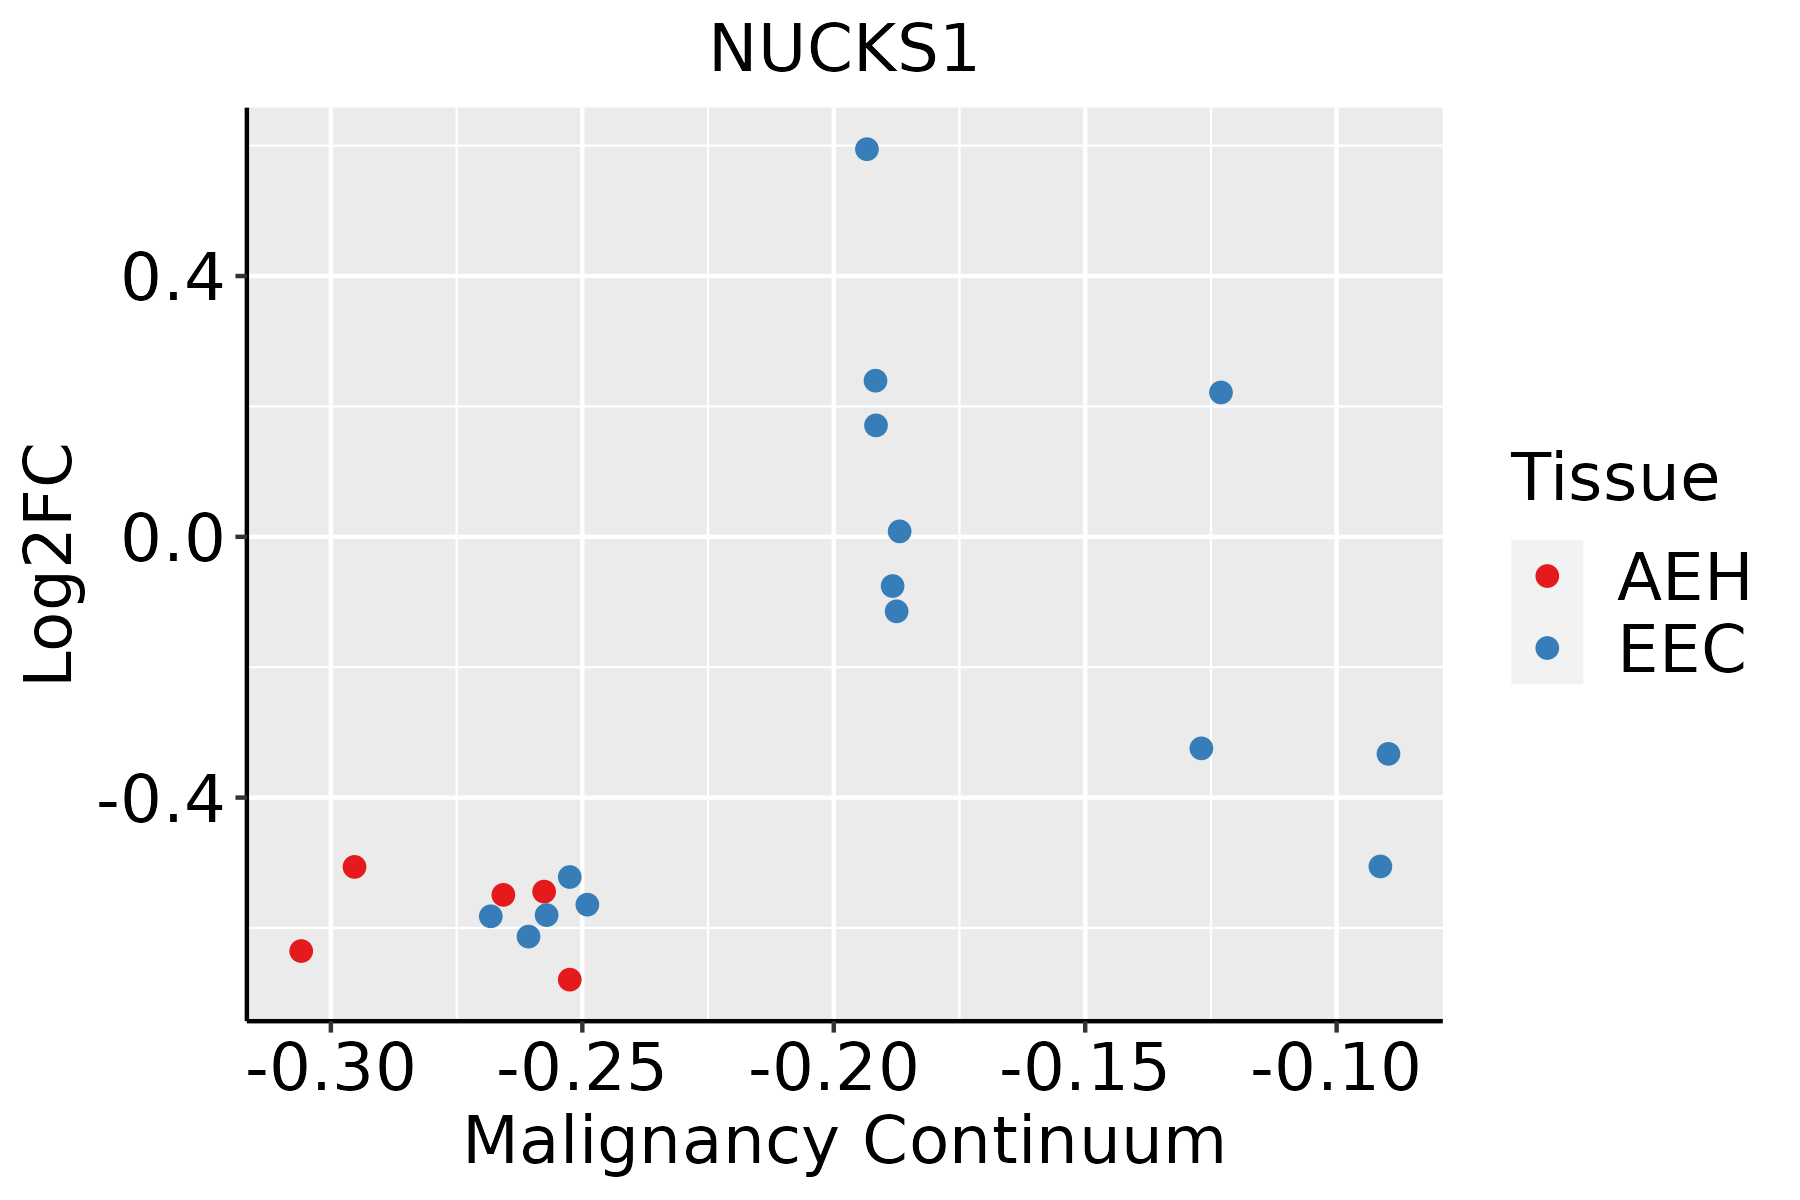 | AEH: Atypical endometrial hyperplasia |
| EEC: Endometrioid Cancer | ||
| Esophagus | 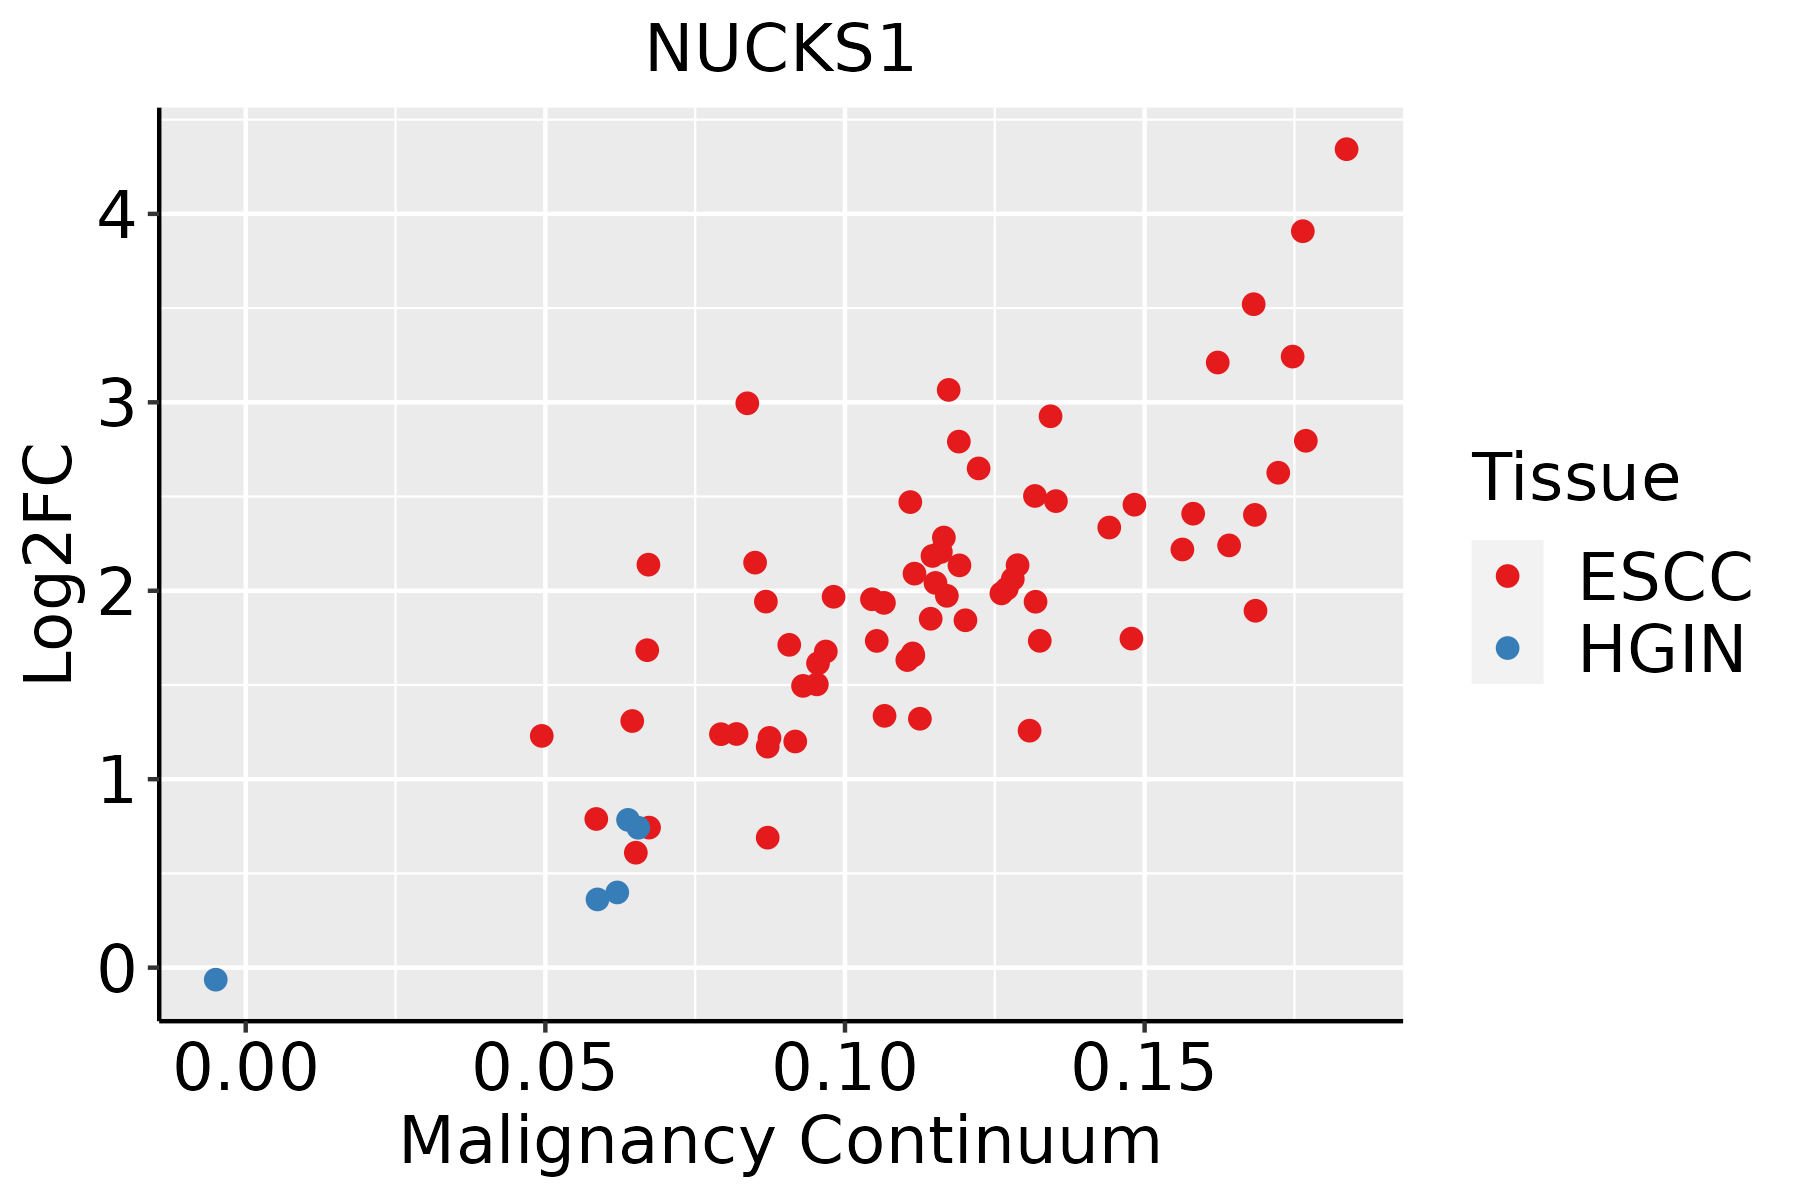 | ESCC: Esophageal squamous cell carcinoma |
| HGIN: High-grade intraepithelial neoplasias | ||
| LGIN: Low-grade intraepithelial neoplasias | ||
| Liver | 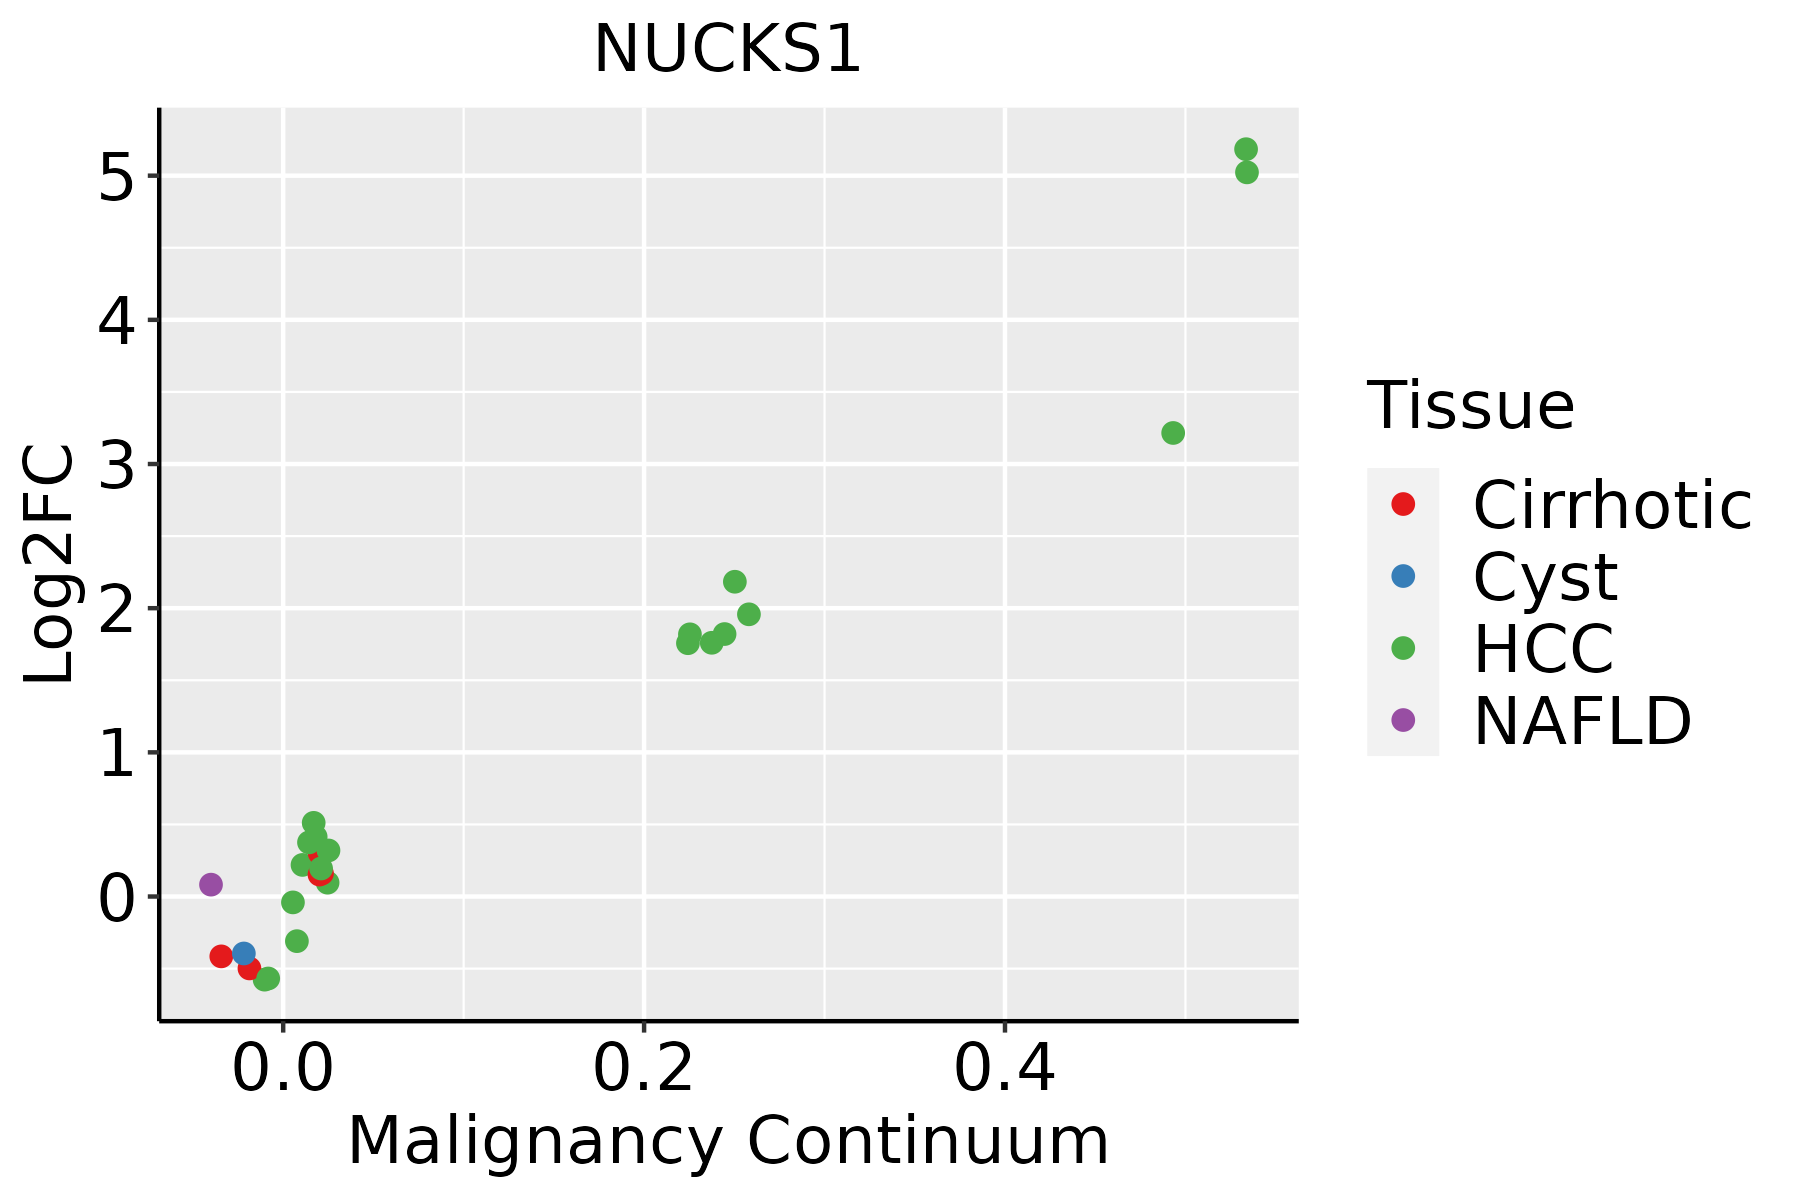 | HCC: Hepatocellular carcinoma |
| NAFLD: Non-alcoholic fatty liver disease | ||
| Oral Cavity | 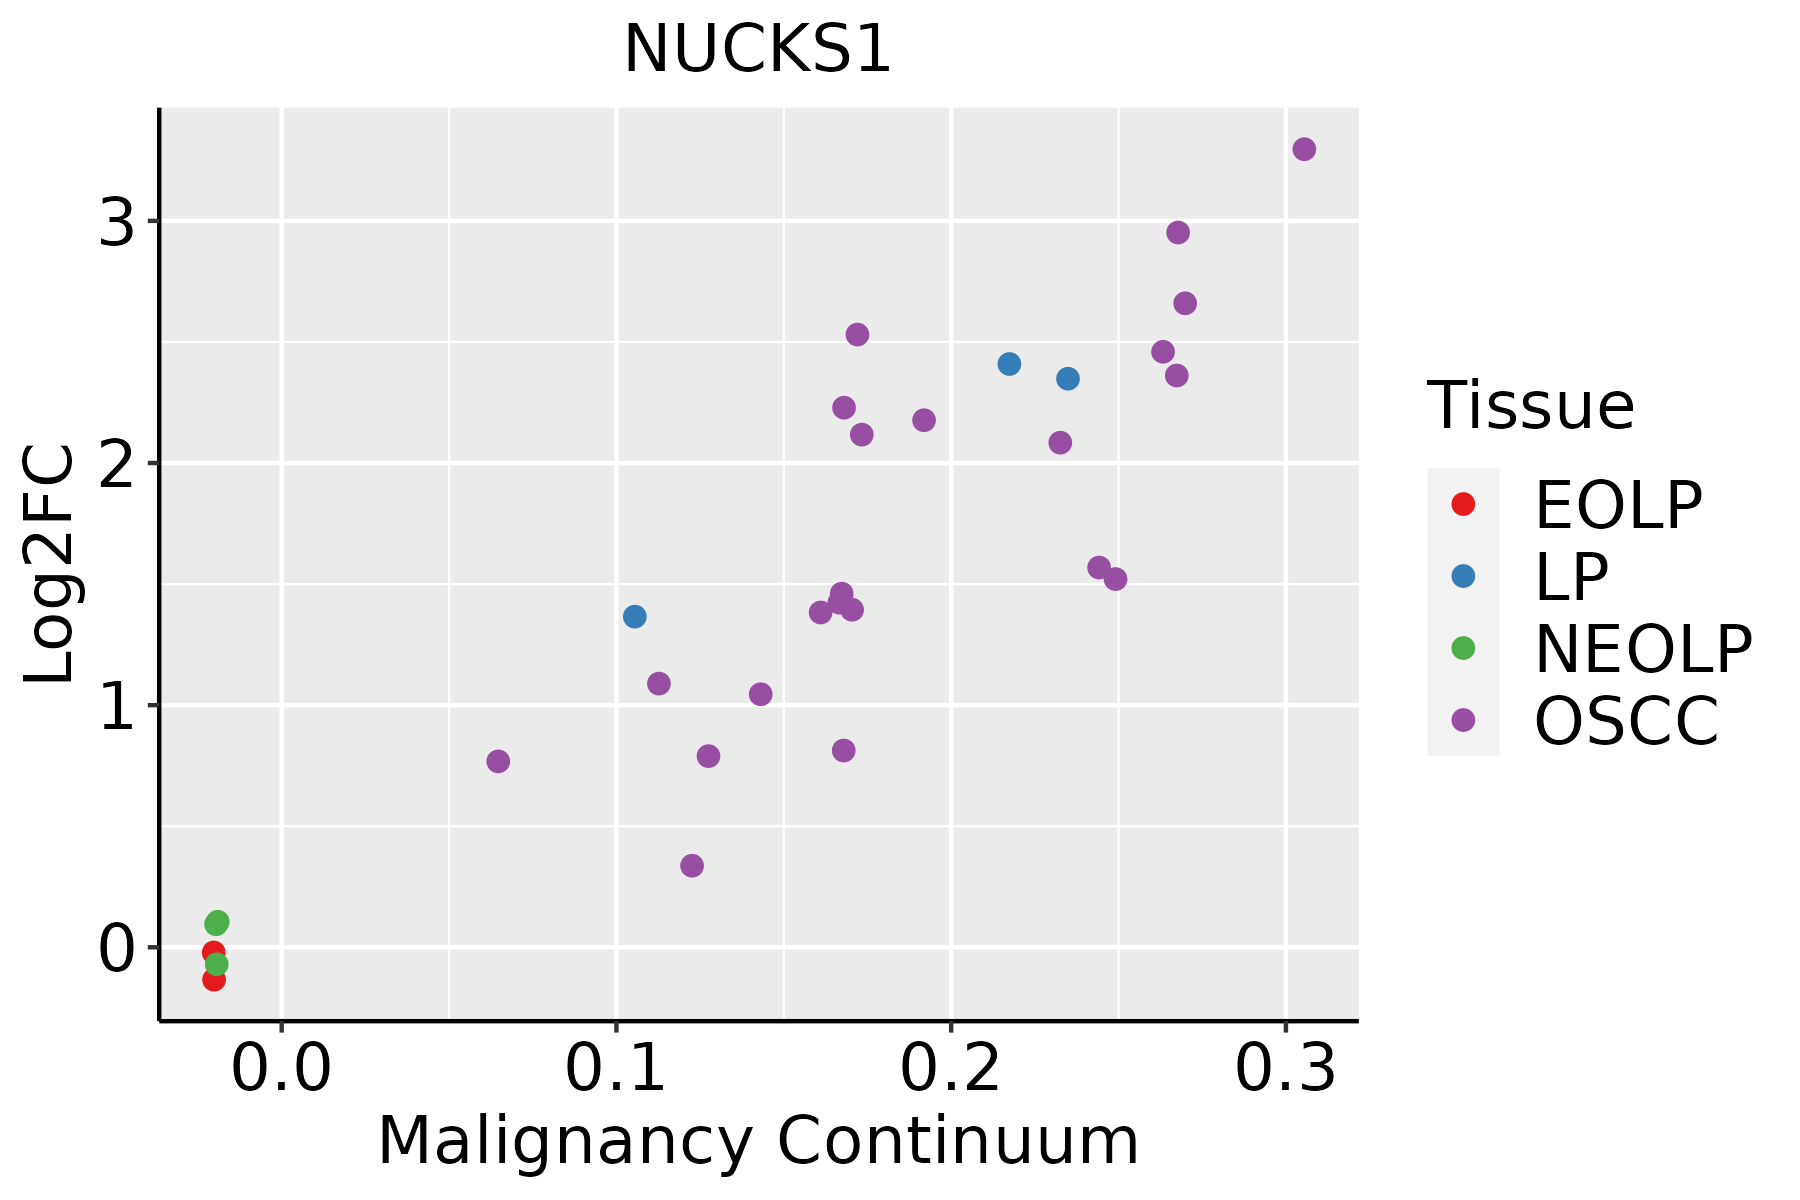 | EOLP: Erosive Oral lichen planus |
| LP: leukoplakia | ||
| NEOLP: Non-erosive oral lichen planus | ||
| OSCC: Oral squamous cell carcinoma | ||
| Prostate |  | BPH: Benign Prostatic Hyperplasia |
| Skin | 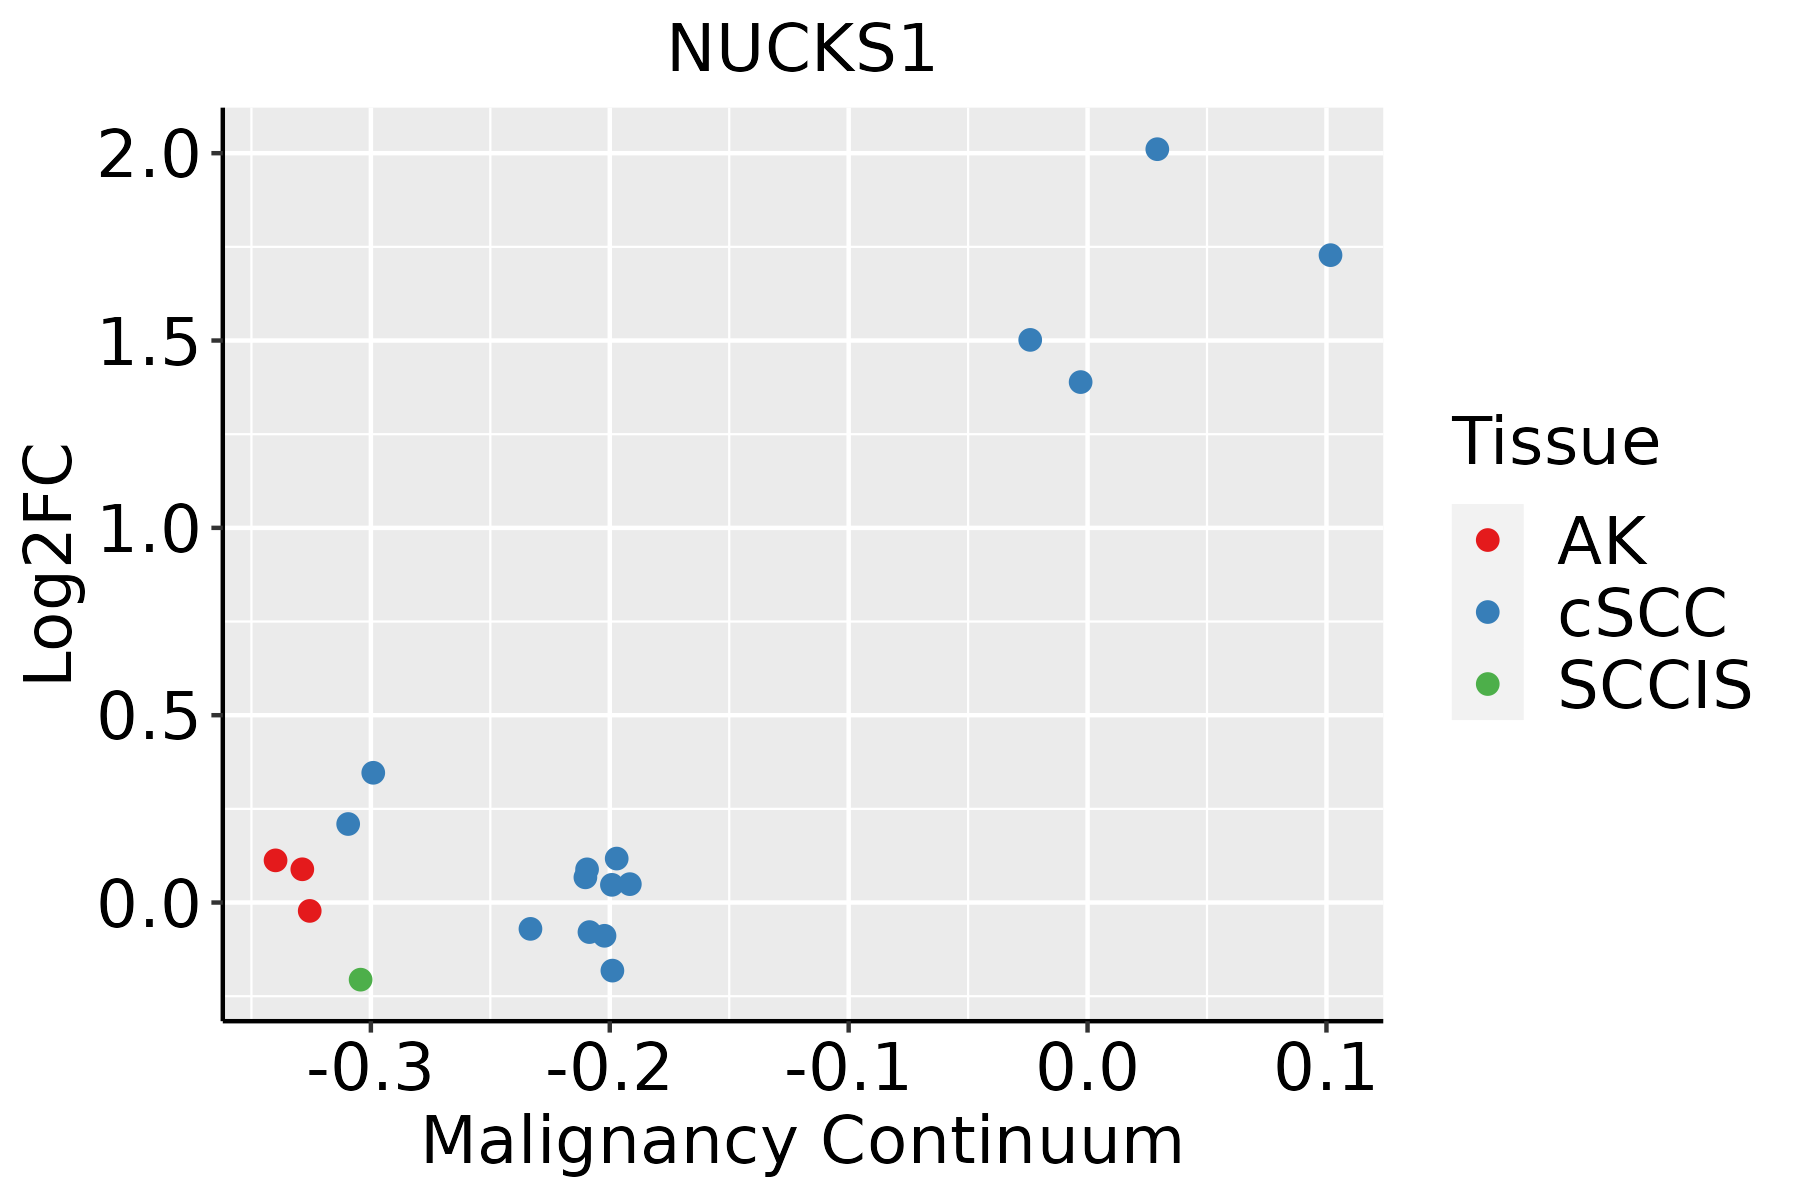 | AK: Actinic keratosis |
| cSCC: Cutaneous squamous cell carcinoma | ||
| SCCIS:squamous cell carcinoma in situ | ||
| Thyroid | 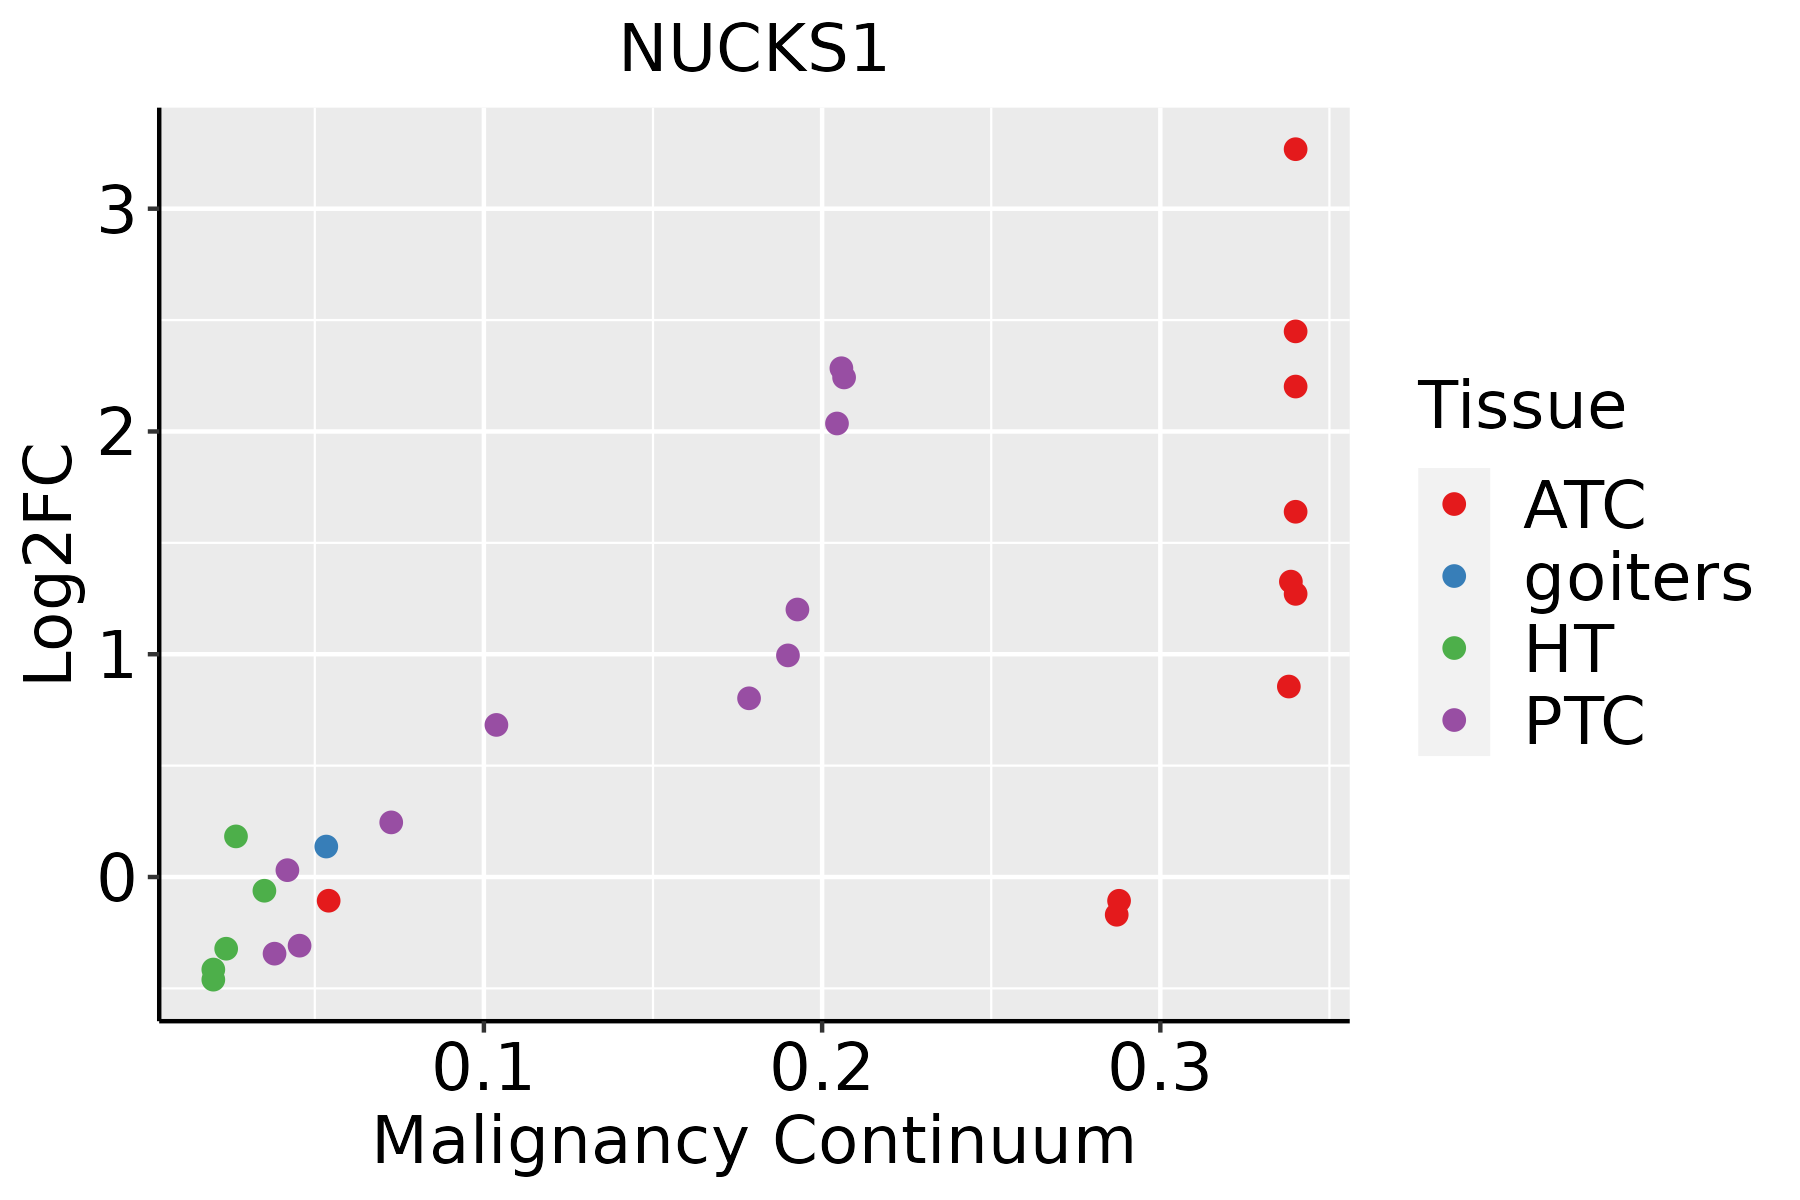 | ATC: Anaplastic thyroid cancer |
| HT: Hashimoto's thyroiditis | ||
| PTC: Papillary thyroid cancer |
| ∗log2FC in expression of this searched gene in stem-like cells from each diseased tissue sample relative to stem-like cells in normal samples in each tissue plotted against the malignancy continuum. Samples are colored based on if they are from different disease stage. |
Top |
Malignant transformation related pathway analysis |
| Find out the enriched GO biological processes and KEGG pathways involved in transition from healthy to precancer to cancer |
| Tissue | Disease Stage | Enriched GO biological Processes |
| Colorectum | AD |  |
| Colorectum | SER |  |
| Colorectum | MSS |  |
| Colorectum | MSI-H |  |
| Colorectum | FAP |  |
| ∗Top 15 enriched GO BP terms are showed in the bar plot of each disease state in each tissue. Each row represents a significant GO biological process which is colored according to the -log10(p.adjust). |
| Page: 1 2 3 4 5 6 7 8 9 |
| GO ID | Tissue | Disease Stage | Description | Gene Ratio | Bg Ratio | pvalue | p.adjust | Count |
| GO:001603214 | Breast | IDC | viral process | 75/1434 | 415/18723 | 1.98e-12 | 4.02e-10 | 75 |
| GO:001905814 | Breast | IDC | viral life cycle | 61/1434 | 317/18723 | 1.61e-11 | 2.77e-09 | 61 |
| GO:001907914 | Breast | IDC | viral genome replication | 32/1434 | 131/18723 | 2.82e-09 | 2.46e-07 | 32 |
| GO:004440314 | Breast | IDC | biological process involved in symbiotic interaction | 52/1434 | 290/18723 | 6.55e-09 | 5.03e-07 | 52 |
| GO:005109814 | Breast | IDC | regulation of binding | 57/1434 | 363/18723 | 1.59e-07 | 8.76e-06 | 57 |
| GO:007147913 | Breast | IDC | cellular response to ionizing radiation | 18/1434 | 72/18723 | 5.67e-06 | 1.85e-04 | 18 |
| GO:001021213 | Breast | IDC | response to ionizing radiation | 28/1434 | 148/18723 | 6.85e-06 | 2.09e-04 | 28 |
| GO:000931412 | Breast | IDC | response to radiation | 62/1434 | 456/18723 | 6.91e-06 | 2.10e-04 | 62 |
| GO:007121413 | Breast | IDC | cellular response to abiotic stimulus | 48/1434 | 331/18723 | 1.37e-05 | 3.53e-04 | 48 |
| GO:010400413 | Breast | IDC | cellular response to environmental stimulus | 48/1434 | 331/18723 | 1.37e-05 | 3.53e-04 | 48 |
| GO:00434348 | Breast | IDC | response to peptide hormone | 54/1434 | 414/18723 | 8.25e-05 | 1.61e-03 | 54 |
| GO:007147813 | Breast | IDC | cellular response to radiation | 29/1434 | 186/18723 | 1.91e-04 | 3.15e-03 | 29 |
| GO:00517025 | Breast | IDC | biological process involved in interaction with symbiont | 18/1434 | 94/18723 | 2.46e-04 | 3.85e-03 | 18 |
| GO:004259313 | Breast | IDC | glucose homeostasis | 34/1434 | 258/18723 | 1.34e-03 | 1.39e-02 | 34 |
| GO:003350013 | Breast | IDC | carbohydrate homeostasis | 34/1434 | 259/18723 | 1.43e-03 | 1.46e-02 | 34 |
| GO:00447883 | Breast | IDC | modulation by host of viral process | 8/1434 | 30/18723 | 1.48e-03 | 1.50e-02 | 8 |
| GO:00518513 | Breast | IDC | modulation by host of symbiont process | 12/1434 | 60/18723 | 1.73e-03 | 1.69e-02 | 12 |
| GO:00447943 | Breast | IDC | positive regulation by host of viral process | 5/1434 | 13/18723 | 2.00e-03 | 1.90e-02 | 5 |
| GO:00439221 | Breast | IDC | negative regulation by host of viral transcription | 5/1434 | 14/18723 | 2.92e-03 | 2.53e-02 | 5 |
| GO:000167813 | Breast | IDC | cellular glucose homeostasis | 24/1434 | 172/18723 | 3.07e-03 | 2.60e-02 | 24 |
| Page: 1 2 3 4 5 6 7 8 9 10 11 12 13 14 15 16 17 18 19 20 21 22 23 24 25 26 27 28 29 30 31 32 33 34 35 36 |
| Pathway ID | Tissue | Disease Stage | Description | Gene Ratio | Bg Ratio | pvalue | p.adjust | qvalue | Count |
| Page: 1 |
Top |
Cell-cell communication analysis |
| Identification of potential cell-cell interactions between two cell types and their ligand-receptor pairs for different disease states |
| Ligand | Receptor | LRpair | Pathway | Tissue | Disease Stage |
| Page: 1 |
Top |
Single-cell gene regulatory network inference analysis |
| Find out the significant the regulons (TFs) and the target genes of each regulon across cell types for different disease states |
| TF | Cell Type | Tissue | Disease Stage | Target Gene | RSS | Regulon Activity |
| ∗The dot plots of a searched regulon are shown for all cell subpopulations in each disease state of each tissue based on the regulon specific score inferred using pySCENIC and by calculating the average expression. |
| Page: 1 |
Top |
Somatic mutation of malignant transformation related genes |
| Annotation of somatic variants for genes involved in malignant transformation |
| Hugo Symbol | Variant Class | Variant Classification | dbSNP RS | HGVSc | HGVSp | HGVSp Short | SWISSPROT | BIOTYPE | SIFT | PolyPhen | Tumor Sample Barcode | Tissue | Histology | Sex | Age | Stage | Therapy Types | Drugs | Outcome |
| NUCKS1 | SNV | Missense_Mutation | c.256C>T | p.His86Tyr | p.H86Y | Q9H1E3 | protein_coding | tolerated(0.46) | benign(0.091) | TCGA-BH-A0DX-01 | Breast | breast invasive carcinoma | Female | <65 | I/II | Chemotherapy | taxotere | CR | |
| NUCKS1 | SNV | Missense_Mutation | rs771629435 | c.635C>T | p.Pro212Leu | p.P212L | Q9H1E3 | protein_coding | tolerated(0.29) | benign(0.061) | TCGA-GM-A2DD-01 | Breast | breast invasive carcinoma | Female | <65 | I/II | Chemotherapy | fluorouracil | CR |
| NUCKS1 | SNV | Missense_Mutation | rs754971187 | c.274N>A | p.Gln92Lys | p.Q92K | Q9H1E3 | protein_coding | tolerated(1) | benign(0.444) | TCGA-AA-3663-01 | Colorectum | colon adenocarcinoma | Male | <65 | I/II | Unknown | Unknown | SD |
| NUCKS1 | SNV | Missense_Mutation | novel | c.218C>A | p.Ser73Tyr | p.S73Y | Q9H1E3 | protein_coding | deleterious(0.02) | probably_damaging(0.983) | TCGA-AZ-4315-01 | Colorectum | colon adenocarcinoma | Male | <65 | I/II | Unknown | Unknown | SD |
| NUCKS1 | SNV | Missense_Mutation | rs762593780 | c.89N>T | p.Ser30Leu | p.S30L | Q9H1E3 | protein_coding | tolerated(0.15) | possibly_damaging(0.572) | TCGA-CA-6717-01 | Colorectum | colon adenocarcinoma | Male | <65 | I/II | Chemotherapy | oxaliplatin | CR |
| NUCKS1 | SNV | Missense_Mutation | rs551812416 | c.572N>A | p.Arg191His | p.R191H | Q9H1E3 | protein_coding | deleterious(0.05) | benign(0.001) | TCGA-A5-A0G1-01 | Endometrium | uterine corpus endometrioid carcinoma | Female | >=65 | I/II | Unknown | Unknown | SD |
| NUCKS1 | SNV | Missense_Mutation | novel | c.295N>A | p.Ala99Thr | p.A99T | Q9H1E3 | protein_coding | deleterious(0) | probably_damaging(0.981) | TCGA-A5-A0G2-01 | Endometrium | uterine corpus endometrioid carcinoma | Female | <65 | III/IV | Unknown | Unknown | SD |
| NUCKS1 | SNV | Missense_Mutation | c.98N>T | p.Pro33Leu | p.P33L | Q9H1E3 | protein_coding | deleterious(0) | possibly_damaging(0.535) | TCGA-AP-A0LG-01 | Endometrium | uterine corpus endometrioid carcinoma | Female | <65 | I/II | Unknown | Unknown | SD | |
| NUCKS1 | SNV | Missense_Mutation | rs758268939 | c.446N>T | p.Ser149Leu | p.S149L | Q9H1E3 | protein_coding | deleterious(0) | probably_damaging(0.947) | TCGA-B5-A0JR-01 | Endometrium | uterine corpus endometrioid carcinoma | Female | >=65 | I/II | Unknown | Unknown | SD |
| NUCKS1 | SNV | Missense_Mutation | novel | c.343N>A | p.Glu115Lys | p.E115K | Q9H1E3 | protein_coding | tolerated(0.1) | possibly_damaging(0.452) | TCGA-B5-A3FA-01 | Endometrium | uterine corpus endometrioid carcinoma | Female | >=65 | I/II | Unknown | Unknown | SD |
| Page: 1 2 3 |
Top |
Related drugs of malignant transformation related genes |
| Identification of chemicals and drugs interact with genes involved in malignant transfromation |
| (DGIdb 4.0) |
| Entrez ID | Symbol | Category | Interaction Types | Drug Claim Name | Drug Name | PMIDs |
| Page: 1 |

Copyright 2023-Present -The University of Texas Health Science Center at Houston |