| Tissue | Expression Dynamics | Abbreviation |
| Colorectum (GSE201348) |  | FAP: Familial adenomatous polyposis |
| CRC: Colorectal cancer |
| Colorectum (HTA11) | 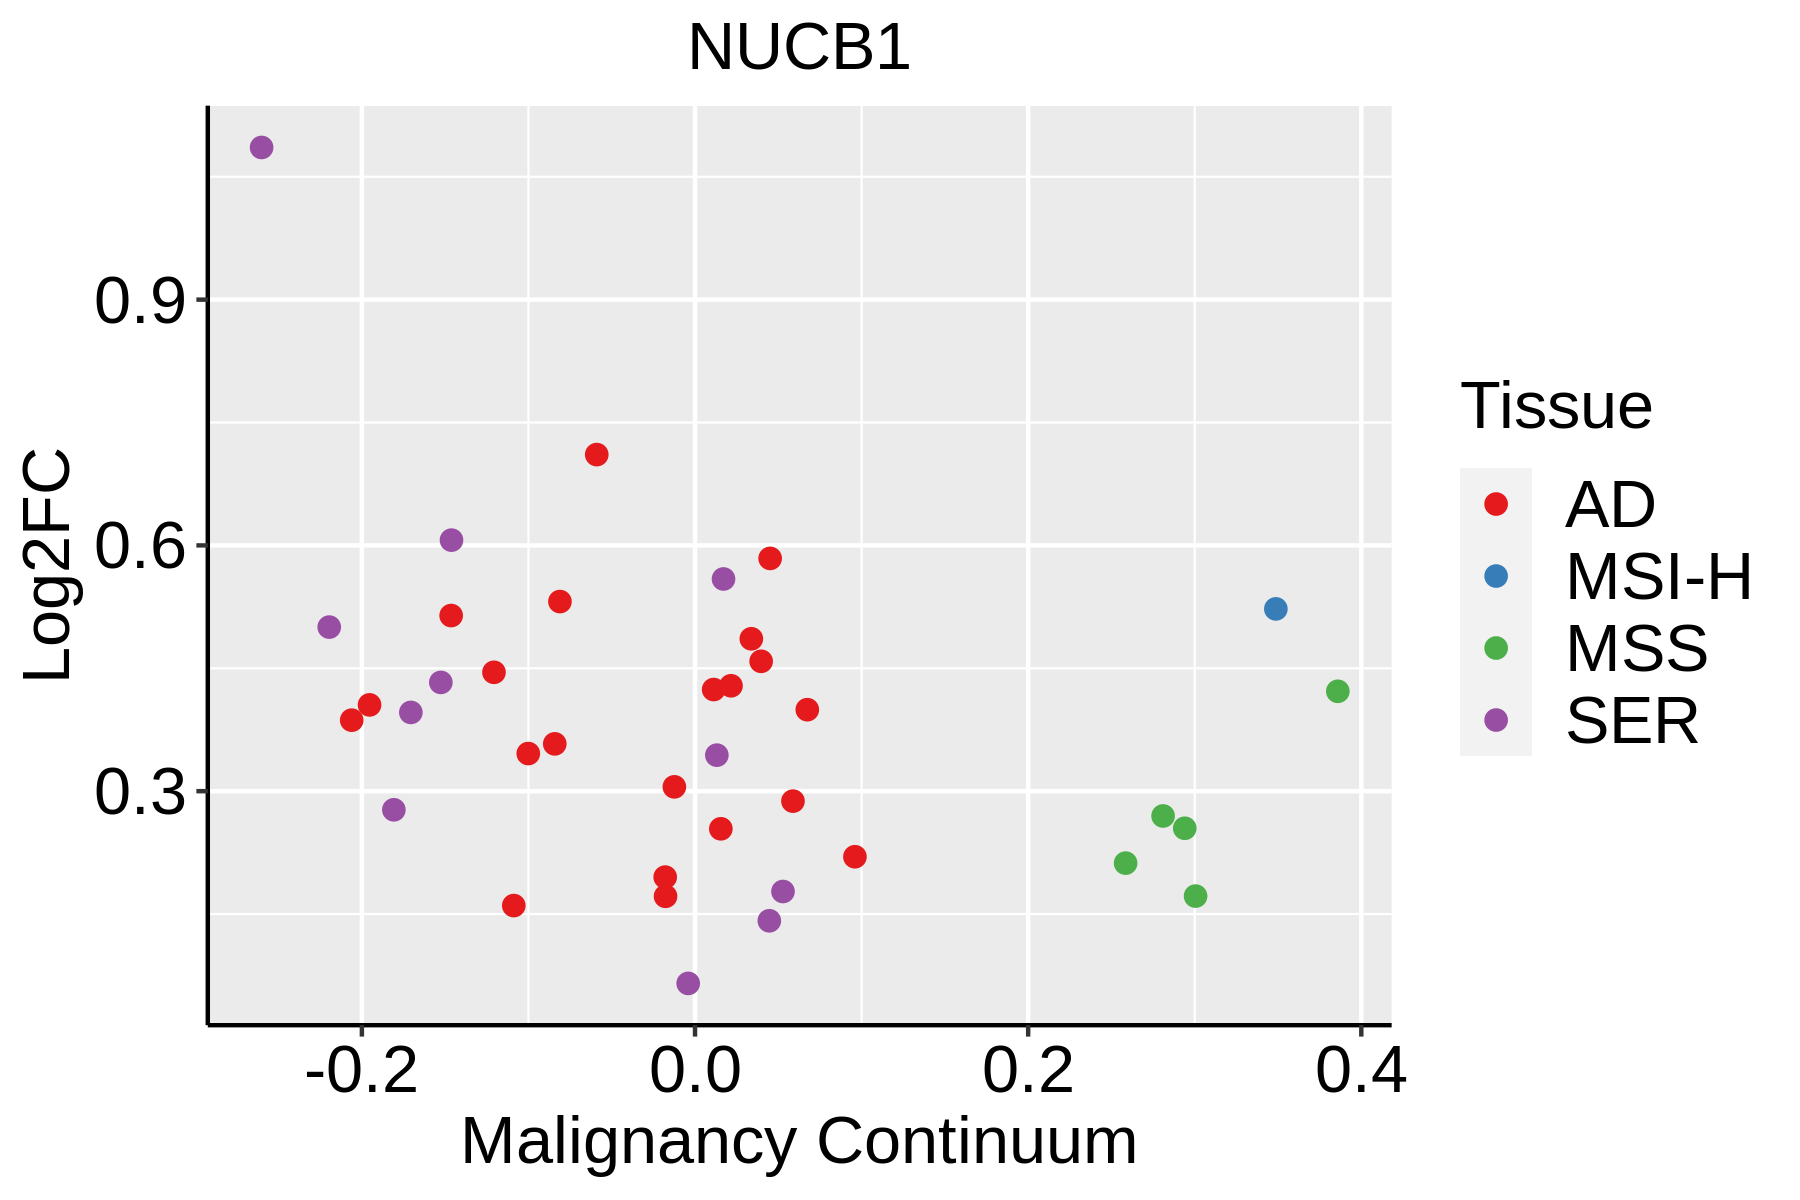 | AD: Adenomas |
| SER: Sessile serrated lesions |
| MSI-H: Microsatellite-high colorectal cancer |
| MSS: Microsatellite stable colorectal cancer |
| Esophagus |  | ESCC: Esophageal squamous cell carcinoma |
| HGIN: High-grade intraepithelial neoplasias |
| LGIN: Low-grade intraepithelial neoplasias |
| Liver | 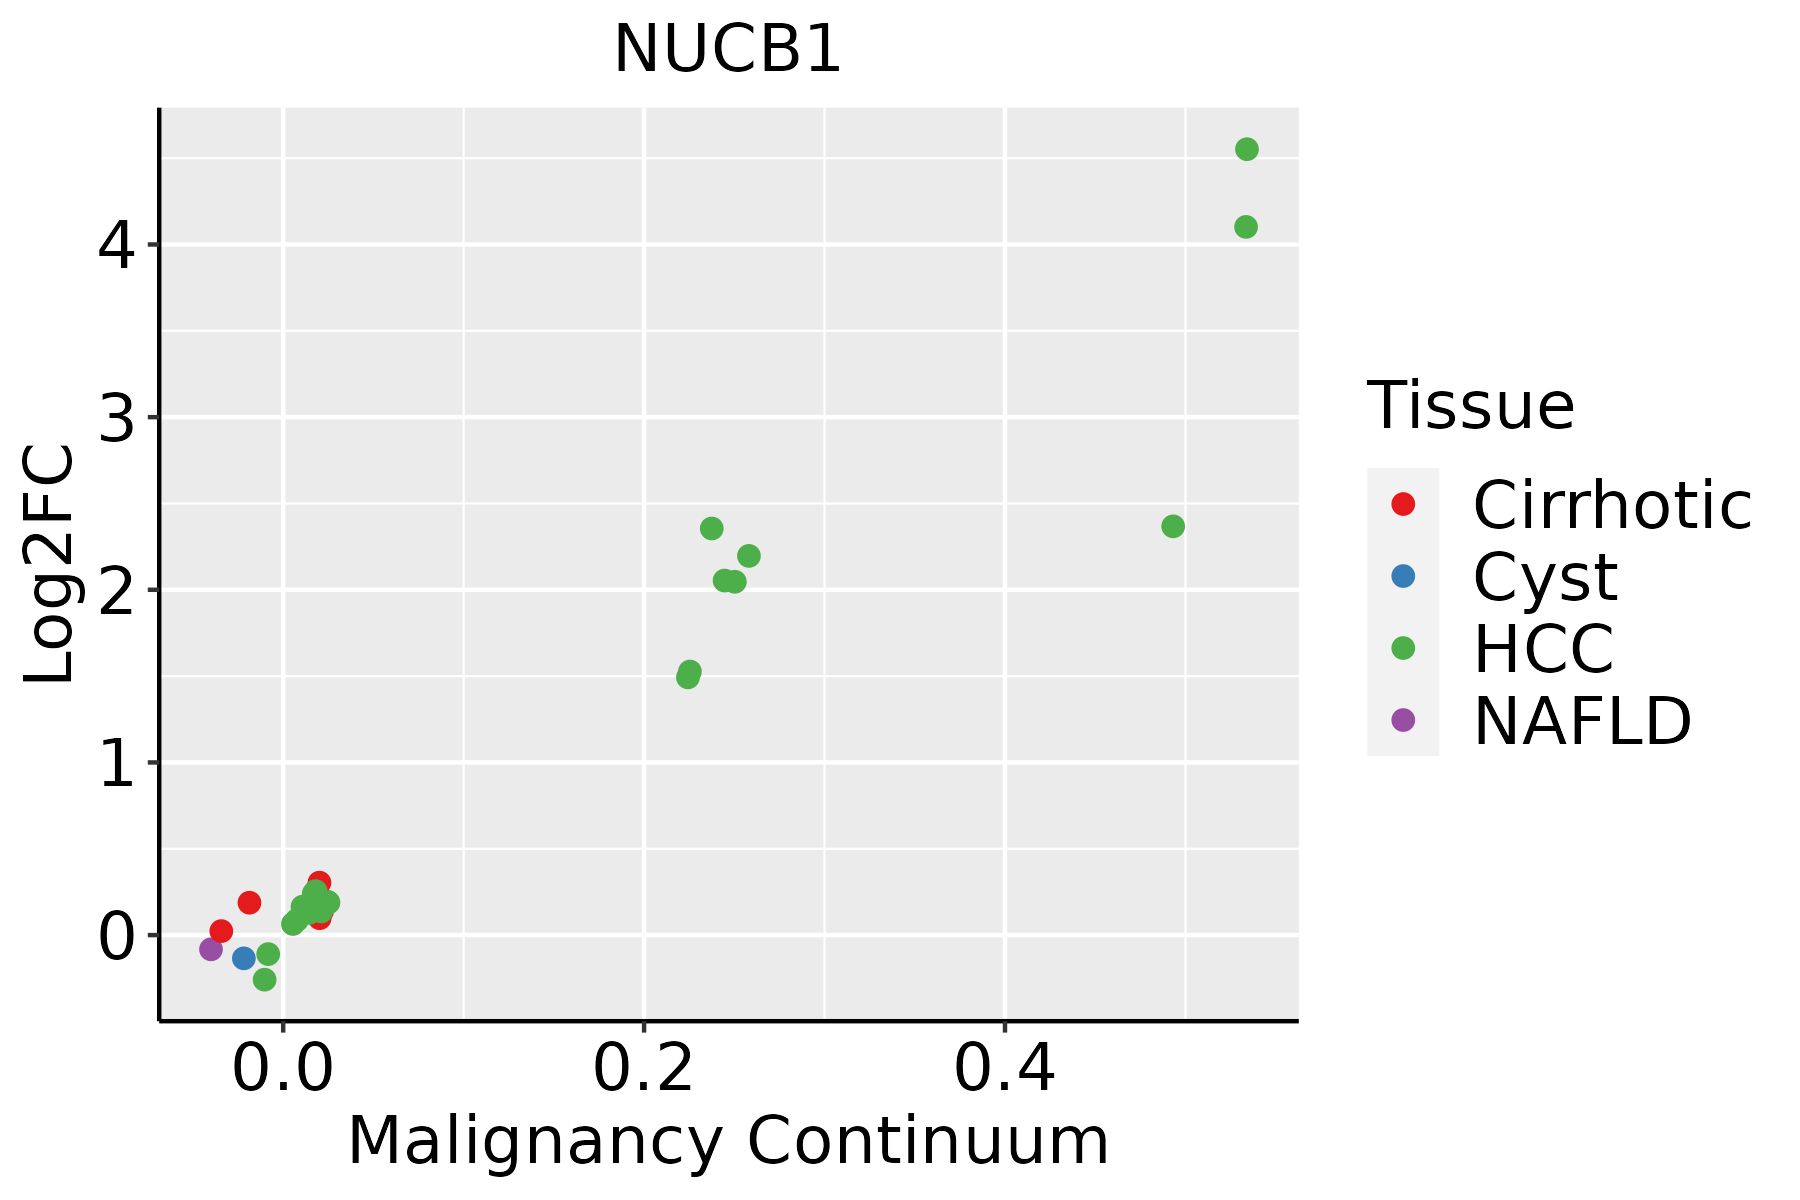 | HCC: Hepatocellular carcinoma |
| NAFLD: Non-alcoholic fatty liver disease |
| Oral Cavity | 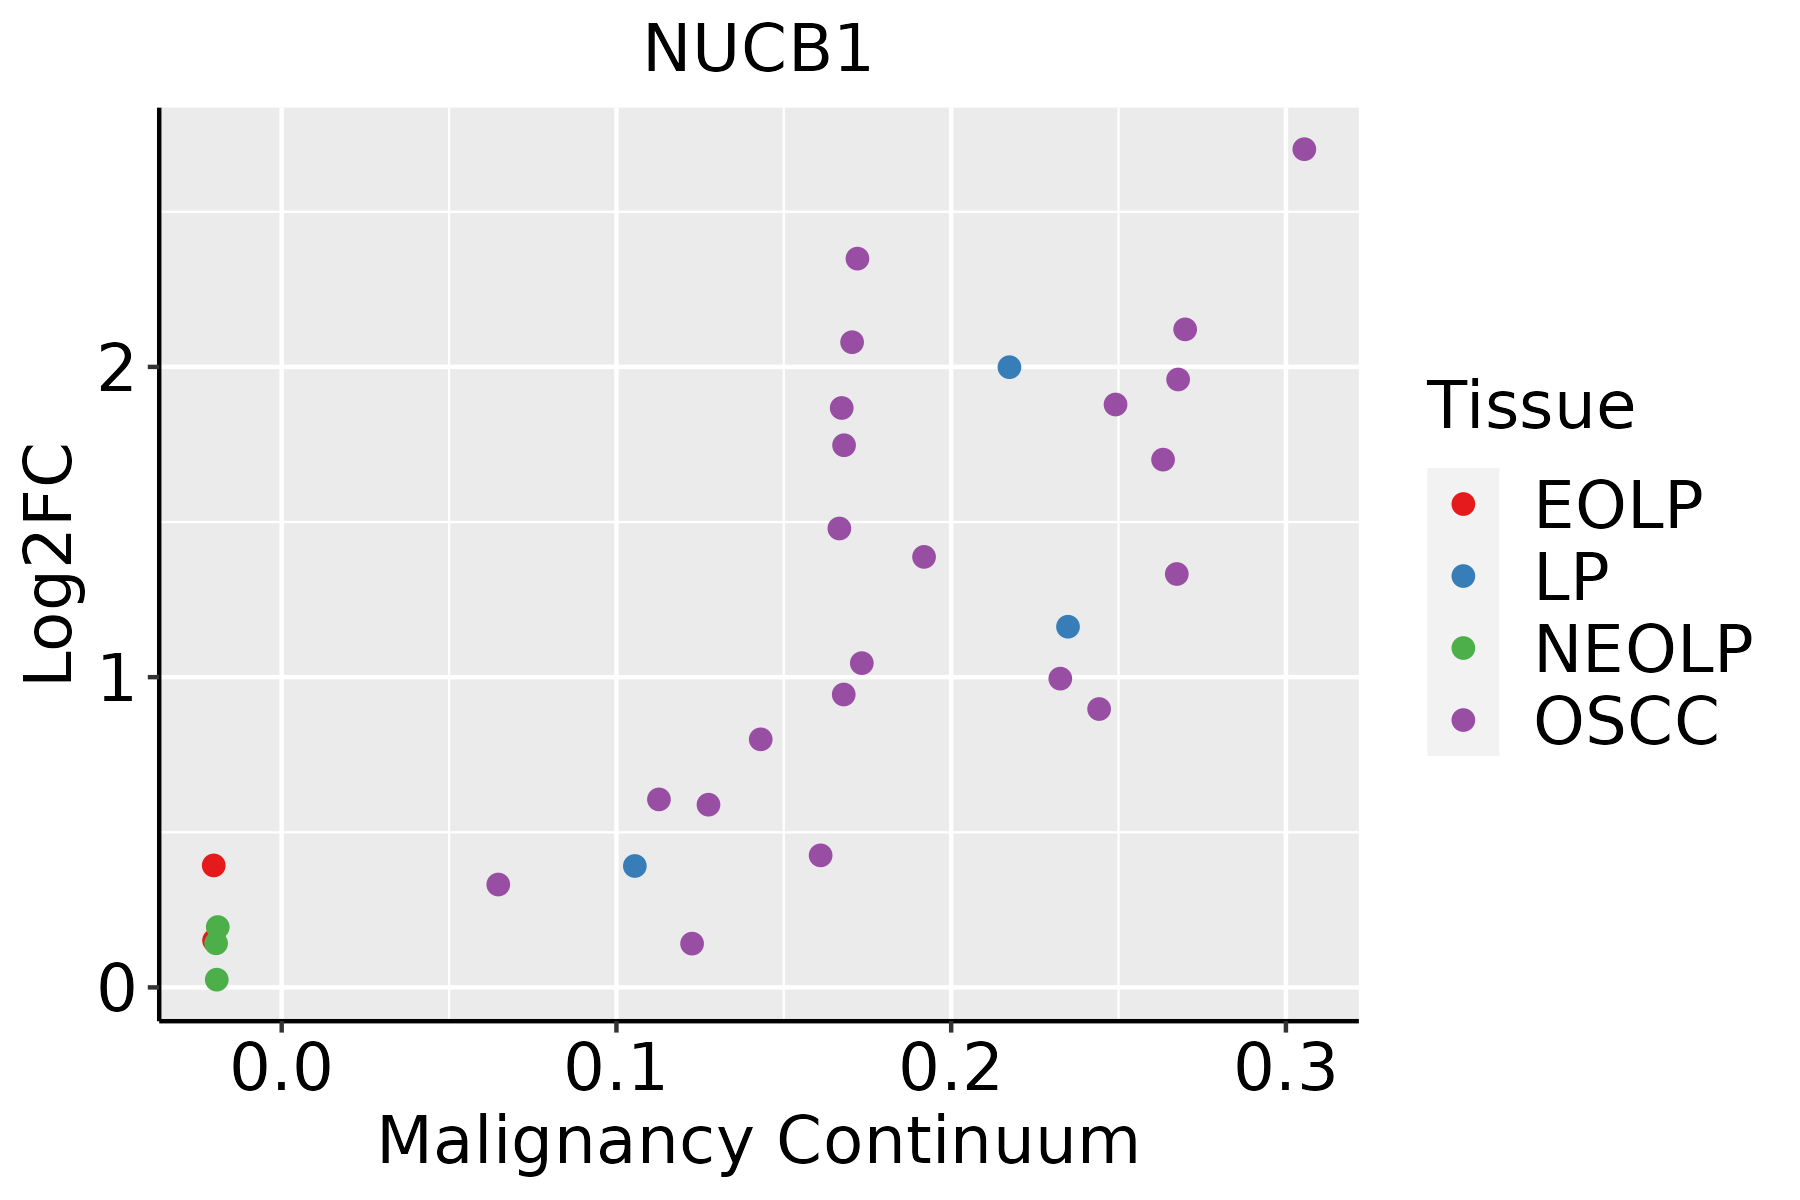 | EOLP: Erosive Oral lichen planus |
| LP: leukoplakia |
| NEOLP: Non-erosive oral lichen planus |
| OSCC: Oral squamous cell carcinoma |
| Prostate | 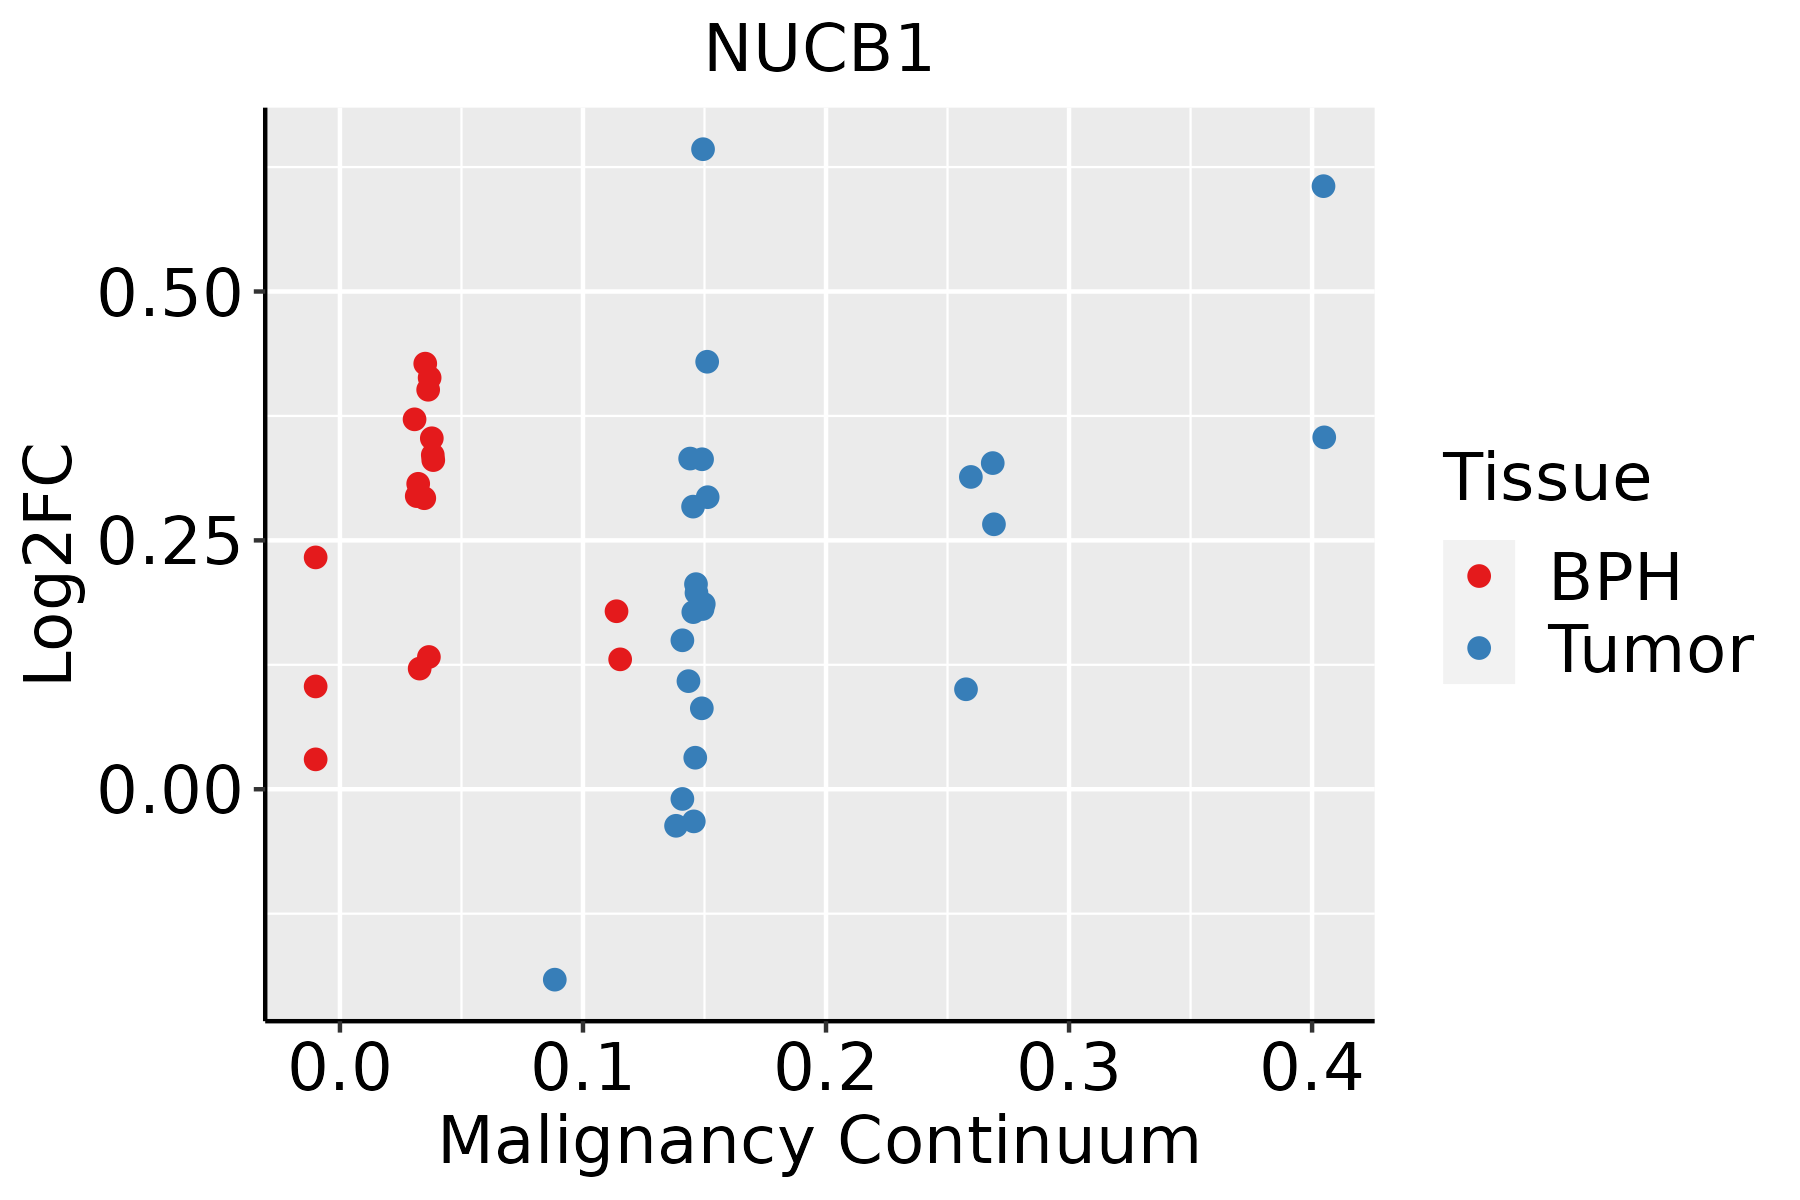 | BPH: Benign Prostatic Hyperplasia |
| Skin | 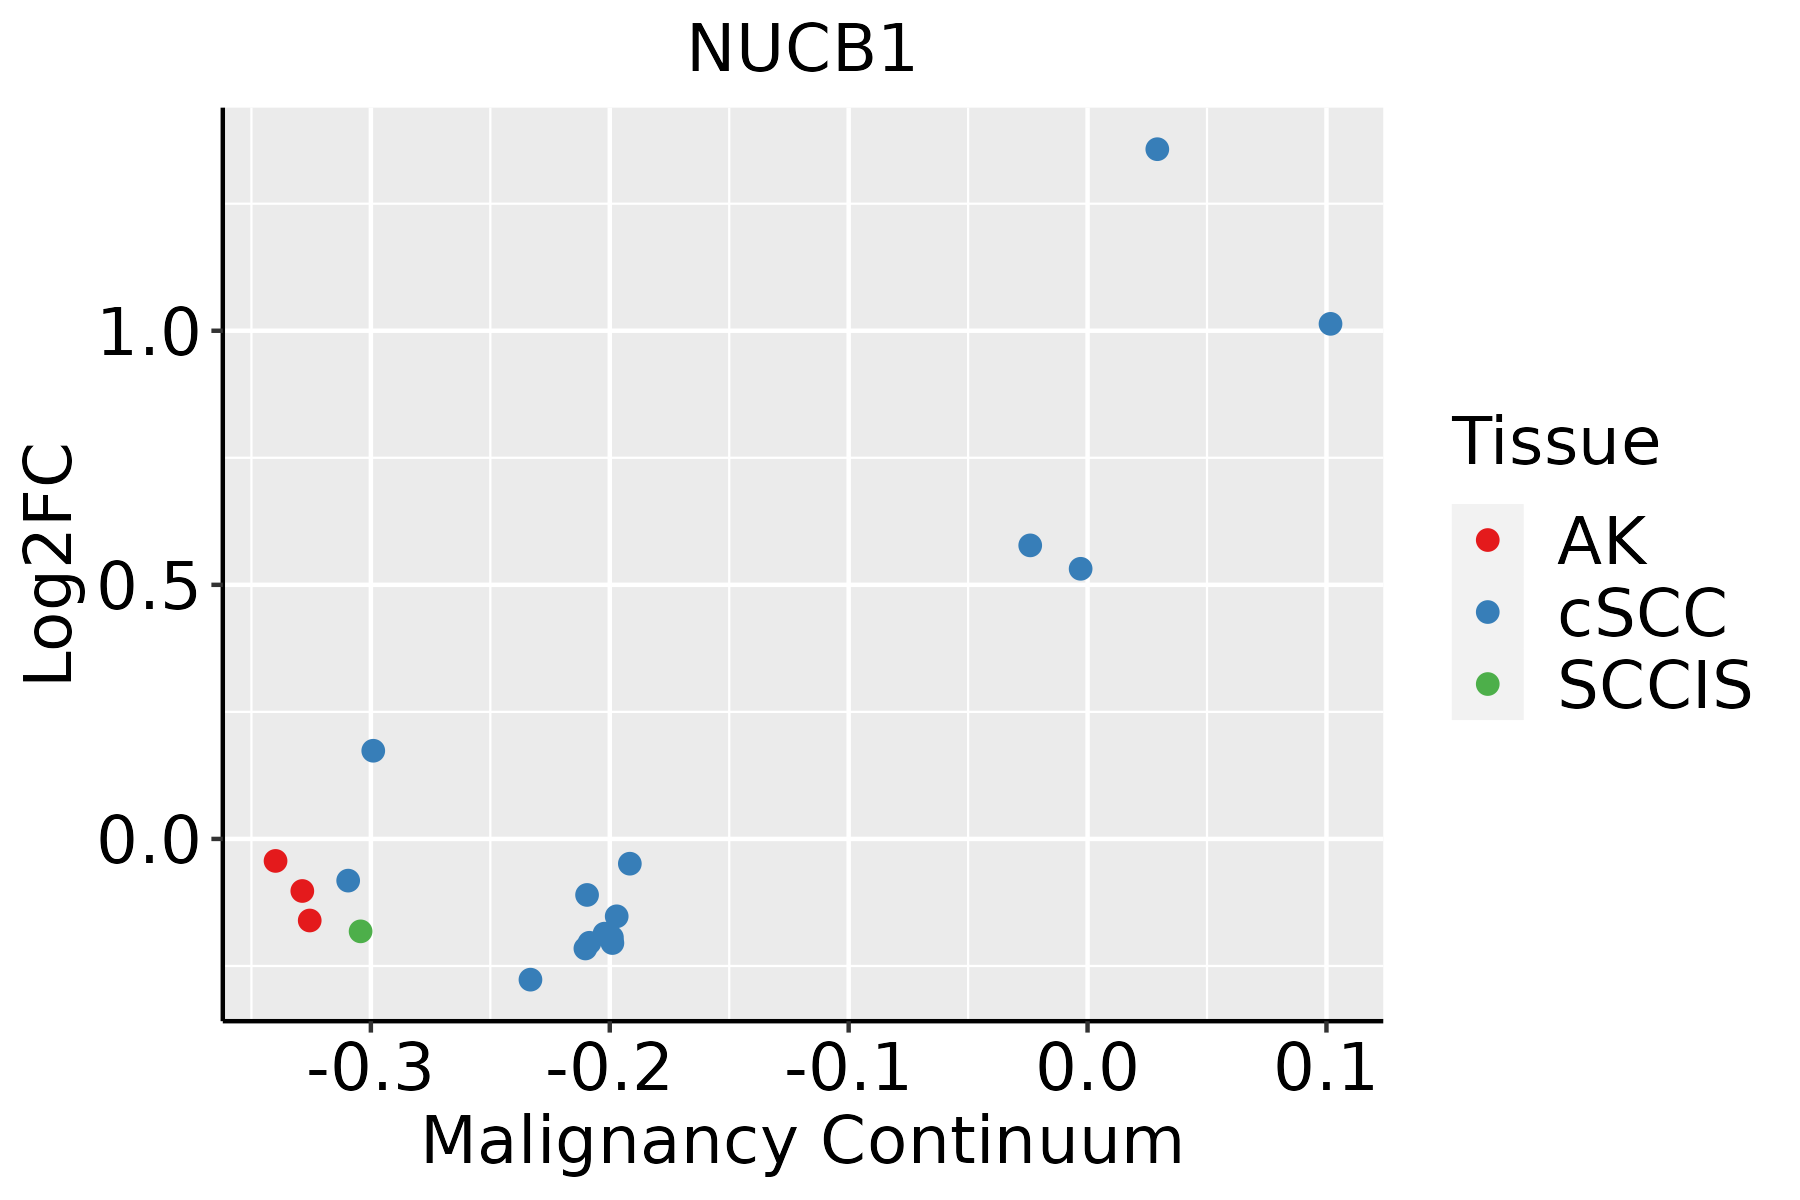 | AK: Actinic keratosis |
| cSCC: Cutaneous squamous cell carcinoma |
| SCCIS:squamous cell carcinoma in situ |
| Thyroid | 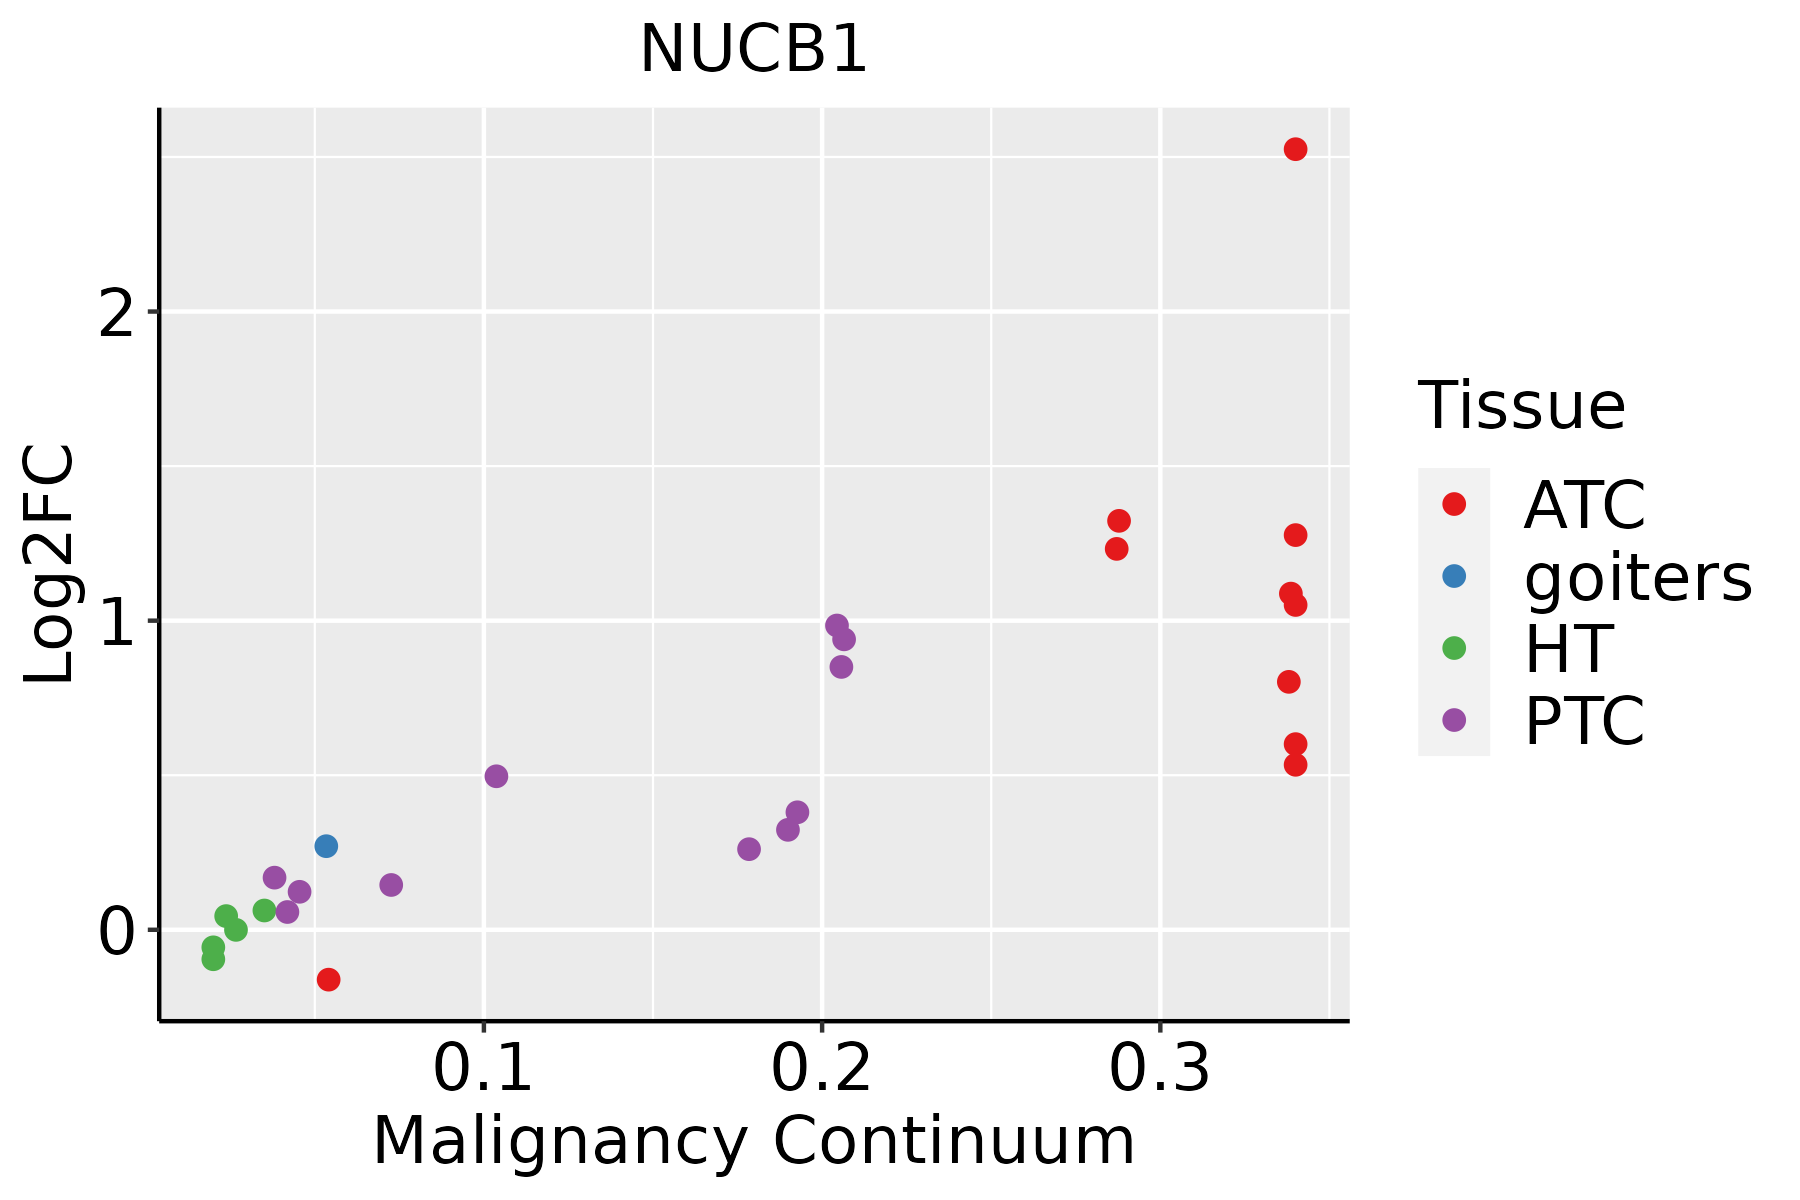 | ATC: Anaplastic thyroid cancer |
| HT: Hashimoto's thyroiditis |
| PTC: Papillary thyroid cancer |
| GO ID | Tissue | Disease Stage | Description | Gene Ratio | Bg Ratio | pvalue | p.adjust | Count |
| GO:0006605 | Colorectum | AD | protein targeting | 105/3918 | 314/18723 | 1.39e-07 | 6.44e-06 | 105 |
| GO:0032386 | Colorectum | AD | regulation of intracellular transport | 109/3918 | 337/18723 | 5.33e-07 | 1.95e-05 | 109 |
| GO:0033157 | Colorectum | AD | regulation of intracellular protein transport | 80/3918 | 229/18723 | 5.81e-07 | 2.09e-05 | 80 |
| GO:1903533 | Colorectum | AD | regulation of protein targeting | 31/3918 | 81/18723 | 2.61e-04 | 3.25e-03 | 31 |
| GO:00331571 | Colorectum | SER | regulation of intracellular protein transport | 68/2897 | 229/18723 | 3.41e-08 | 2.30e-06 | 68 |
| GO:00323861 | Colorectum | SER | regulation of intracellular transport | 89/2897 | 337/18723 | 1.34e-07 | 7.96e-06 | 89 |
| GO:00066051 | Colorectum | SER | protein targeting | 76/2897 | 314/18723 | 3.19e-05 | 8.47e-04 | 76 |
| GO:19035331 | Colorectum | SER | regulation of protein targeting | 24/2897 | 81/18723 | 9.20e-04 | 1.11e-02 | 24 |
| GO:00066052 | Colorectum | MSS | protein targeting | 97/3467 | 314/18723 | 6.76e-08 | 3.46e-06 | 97 |
| GO:00331572 | Colorectum | MSS | regulation of intracellular protein transport | 76/3467 | 229/18723 | 7.03e-08 | 3.56e-06 | 76 |
| GO:00323862 | Colorectum | MSS | regulation of intracellular transport | 102/3467 | 337/18723 | 9.73e-08 | 4.71e-06 | 102 |
| GO:19035332 | Colorectum | MSS | regulation of protein targeting | 28/3467 | 81/18723 | 4.34e-04 | 5.23e-03 | 28 |
| GO:00066053 | Colorectum | MSI-H | protein targeting | 44/1319 | 314/18723 | 9.50e-06 | 4.55e-04 | 44 |
| GO:00323863 | Colorectum | MSI-H | regulation of intracellular transport | 46/1319 | 337/18723 | 1.20e-05 | 5.48e-04 | 46 |
| GO:00331573 | Colorectum | MSI-H | regulation of intracellular protein transport | 33/1319 | 229/18723 | 6.86e-05 | 2.29e-03 | 33 |
| GO:00323865 | Colorectum | CRC | regulation of intracellular transport | 61/2078 | 337/18723 | 7.94e-05 | 1.65e-03 | 61 |
| GO:00331575 | Colorectum | CRC | regulation of intracellular protein transport | 45/2078 | 229/18723 | 9.62e-05 | 1.95e-03 | 45 |
| GO:00066055 | Colorectum | CRC | protein targeting | 54/2078 | 314/18723 | 7.17e-04 | 9.28e-03 | 54 |
| GO:000660525 | Esophagus | HGIN | protein targeting | 78/2587 | 314/18723 | 1.08e-07 | 5.47e-06 | 78 |
| GO:003238617 | Esophagus | HGIN | regulation of intracellular transport | 79/2587 | 337/18723 | 1.11e-06 | 4.36e-05 | 79 |
| Hugo Symbol | Variant Class | Variant Classification | dbSNP RS | HGVSc | HGVSp | HGVSp Short | SWISSPROT | BIOTYPE | SIFT | PolyPhen | Tumor Sample Barcode | Tissue | Histology | Sex | Age | Stage | Therapy Types | Drugs | Outcome |
| NUCB1 | SNV | Missense_Mutation | | c.822N>C | p.Glu274Asp | p.E274D | Q02818 | protein_coding | tolerated(0.21) | probably_damaging(0.936) | TCGA-AC-A23H-01 | Breast | breast invasive carcinoma | Female | >=65 | I/II | Unknown | Unknown | PD |
| NUCB1 | SNV | Missense_Mutation | | c.1249N>C | p.Glu417Gln | p.E417Q | Q02818 | protein_coding | tolerated(0.27) | benign(0) | TCGA-AC-A23H-01 | Breast | breast invasive carcinoma | Female | >=65 | I/II | Unknown | Unknown | PD |
| NUCB1 | insertion | Frame_Shift_Ins | novel | c.879_880insGAAATTAACCACTGGATTTGCAAGATGAGGGTTC | p.Leu294GlufsTer69 | p.L294Efs*69 | Q02818 | protein_coding | | | TCGA-AN-A0FN-01 | Breast | breast invasive carcinoma | Female | <65 | I/II | Unknown | Unknown | SD |
| NUCB1 | SNV | Missense_Mutation | | c.1078N>C | p.Glu360Gln | p.E360Q | Q02818 | protein_coding | deleterious(0.04) | possibly_damaging(0.844) | TCGA-C5-A1ME-01 | Cervix | cervical & endocervical cancer | Female | <65 | I/II | Unknown | Unknown | SD |
| NUCB1 | SNV | Missense_Mutation | | c.1314N>C | p.Gln438His | p.Q438H | Q02818 | protein_coding | deleterious(0.03) | benign(0.005) | TCGA-DR-A0ZM-01 | Cervix | cervical & endocervical cancer | Female | <65 | III/IV | Unspecific | Cisplatin | SD |
| NUCB1 | SNV | Missense_Mutation | rs749759537 | c.64N>T | p.Arg22Cys | p.R22C | Q02818 | protein_coding | tolerated(0.15) | benign(0.129) | TCGA-EX-A69L-01 | Cervix | cervical & endocervical cancer | Female | <65 | I/II | Unknown | Unknown | SD |
| NUCB1 | SNV | Missense_Mutation | novel | c.421C>A | p.Leu141Met | p.L141M | Q02818 | protein_coding | deleterious(0.01) | probably_damaging(0.921) | TCGA-A5-A0G2-01 | Endometrium | uterine corpus endometrioid carcinoma | Female | <65 | III/IV | Unknown | Unknown | SD |
| NUCB1 | SNV | Missense_Mutation | novel | c.937N>G | p.Thr313Ala | p.T313A | Q02818 | protein_coding | deleterious(0.01) | possibly_damaging(0.715) | TCGA-A5-A2K3-01 | Endometrium | uterine corpus endometrioid carcinoma | Female | >=65 | I/II | Chemotherapy | carboplatin | SD |
| NUCB1 | SNV | Missense_Mutation | rs375589971 | c.457G>A | p.Asp153Asn | p.D153N | Q02818 | protein_coding | deleterious(0) | probably_damaging(0.998) | TCGA-AJ-A3OK-01 | Endometrium | uterine corpus endometrioid carcinoma | Female | >=65 | I/II | Chemotherapy | carboplatin | CR |
| NUCB1 | SNV | Missense_Mutation | novel | c.986C>T | p.Thr329Ile | p.T329I | Q02818 | protein_coding | deleterious(0.04) | benign(0.007) | TCGA-AP-A1DP-01 | Endometrium | uterine corpus endometrioid carcinoma | Female | >=65 | I/II | Chemotherapy | paclitaxel | PD |


