Schematic overview of the cellular and molecular mechanisms involved in the cancer progression, including the proposed cellular and molecular mechanisms in cancer cells trajectory. AT1: alveolar type 1 cells; AT2: alveolar type 2 cells; AAH: atypical adenomatous hyperplasia; AIS: adenocarcinoma in situ; MIA: minimally invasive adenocarcinoma; IA: invasive adenocarcinoma; EMT: epithelial-mesenchymal transition

Home

Download

Statistics

Help

Contact

Center for Computational Systems Medicine
leaf

Gene summary

leaf

Malignant transformation analysis

leaf

Malignant transformation related pathway analysis

leaf

Cell-cell communication analysis

leaf

Single-cell gene regulatory network inference analysis

leaf

Somatic mutation of malignant transformation related genes

leaf

Related drugs of malignant transformation related genes

Gene: NUBPL

Gene summary for NUBPL

check button Gene summary.

Gene informationSpeciesHuman
Gene symbol

NUBPL

Gene ID

80224

Gene namenucleotide binding protein like
Gene AliasC14orf127
Cytomap14q12
Gene Typeprotein-coding
GO ID

GO:0006790

UniProtAcc

B4DWB0


Top

Malignant transformation analysis

check button Identification of the aberrant gene expression in precancerous and cancerous lesions by comparing the gene expression of stem-like cells in diseased tissues with normal stem cells
check button Malignant transformation involving gene list.
Entrez IDSymbolReplicatesSpeciesOrganTissueAdj P-valueLog2FCMalignancy
80224NUBPLHTA11_3410_2000001011HumanColorectumAD1.18e-08-4.61e-010.0155
80224NUBPLHTA11_696_2000001011HumanColorectumAD1.71e-04-3.68e-01-0.1464
80224NUBPLHTA11_5212_2000001011HumanColorectumAD2.36e-03-6.33e-01-0.2061
80224NUBPLHTA11_866_3004761011HumanColorectumAD4.80e-03-3.80e-010.096
80224NUBPLHTA11_99999974143_84620HumanColorectumMSS1.54e-04-3.40e-010.3005
80224NUBPLA002-C-010HumanColorectumFAP3.61e-026.87e-020.242
80224NUBPLA015-C-203HumanColorectumFAP1.12e-17-1.41e-01-0.1294
80224NUBPLA015-C-204HumanColorectumFAP1.23e-03-1.23e-01-0.0228
80224NUBPLA014-C-040HumanColorectumFAP2.54e-03-7.82e-02-0.1184
80224NUBPLA002-C-201HumanColorectumFAP7.49e-13-3.27e-010.0324
80224NUBPLA002-C-203HumanColorectumFAP1.21e-028.64e-020.2786
80224NUBPLA001-C-119HumanColorectumFAP2.59e-08-3.81e-01-0.1557
80224NUBPLA001-C-108HumanColorectumFAP2.02e-08-1.51e-01-0.0272
80224NUBPLA002-C-205HumanColorectumFAP4.39e-22-4.62e-01-0.1236
80224NUBPLA015-C-005HumanColorectumFAP6.30e-03-1.60e-01-0.0336
80224NUBPLA015-C-006HumanColorectumFAP4.62e-13-7.57e-02-0.0994
80224NUBPLA015-C-106HumanColorectumFAP4.86e-08-7.27e-02-0.0511
80224NUBPLA002-C-114HumanColorectumFAP3.46e-15-1.97e-01-0.1561
80224NUBPLA015-C-104HumanColorectumFAP8.45e-19-2.60e-01-0.1899
80224NUBPLA001-C-014HumanColorectumFAP4.07e-08-1.27e-010.0135
Page: 1 2 3 4 5 

check button Transcriptomic changes along malignancy continuum.
TissueExpression DynamicsAbbreviation
Colorectum (GSE201348)The image shows the transcriptomic changes along malignancy continuum.log2FC in expression of this searched gene in stem-like cells from each diseased tissue sample relative to stem-like cells in normal samples in each tissue plotted against the malignancy continuum. Samples are colored based on if they are from different disease stage.FAP: Familial adenomatous polyposis
CRC: Colorectal cancer
Colorectum (HTA11)The image shows the transcriptomic changes along malignancy continuum.log2FC in expression of this searched gene in stem-like cells from each diseased tissue sample relative to stem-like cells in normal samples in each tissue plotted against the malignancy continuum. Samples are colored based on if they are from different disease stage.AD: Adenomas
SER: Sessile serrated lesions
MSI-H: Microsatellite-high colorectal cancer
MSS: Microsatellite stable colorectal cancer
EsophagusThe image shows the transcriptomic changes along malignancy continuum.log2FC in expression of this searched gene in stem-like cells from each diseased tissue sample relative to stem-like cells in normal samples in each tissue plotted against the malignancy continuum. Samples are colored based on if they are from different disease stage.ESCC: Esophageal squamous cell carcinoma
HGIN: High-grade intraepithelial neoplasias
LGIN: Low-grade intraepithelial neoplasias
LiverThe image shows the transcriptomic changes along malignancy continuum.log2FC in expression of this searched gene in stem-like cells from each diseased tissue sample relative to stem-like cells in normal samples in each tissue plotted against the malignancy continuum. Samples are colored based on if they are from different disease stage.
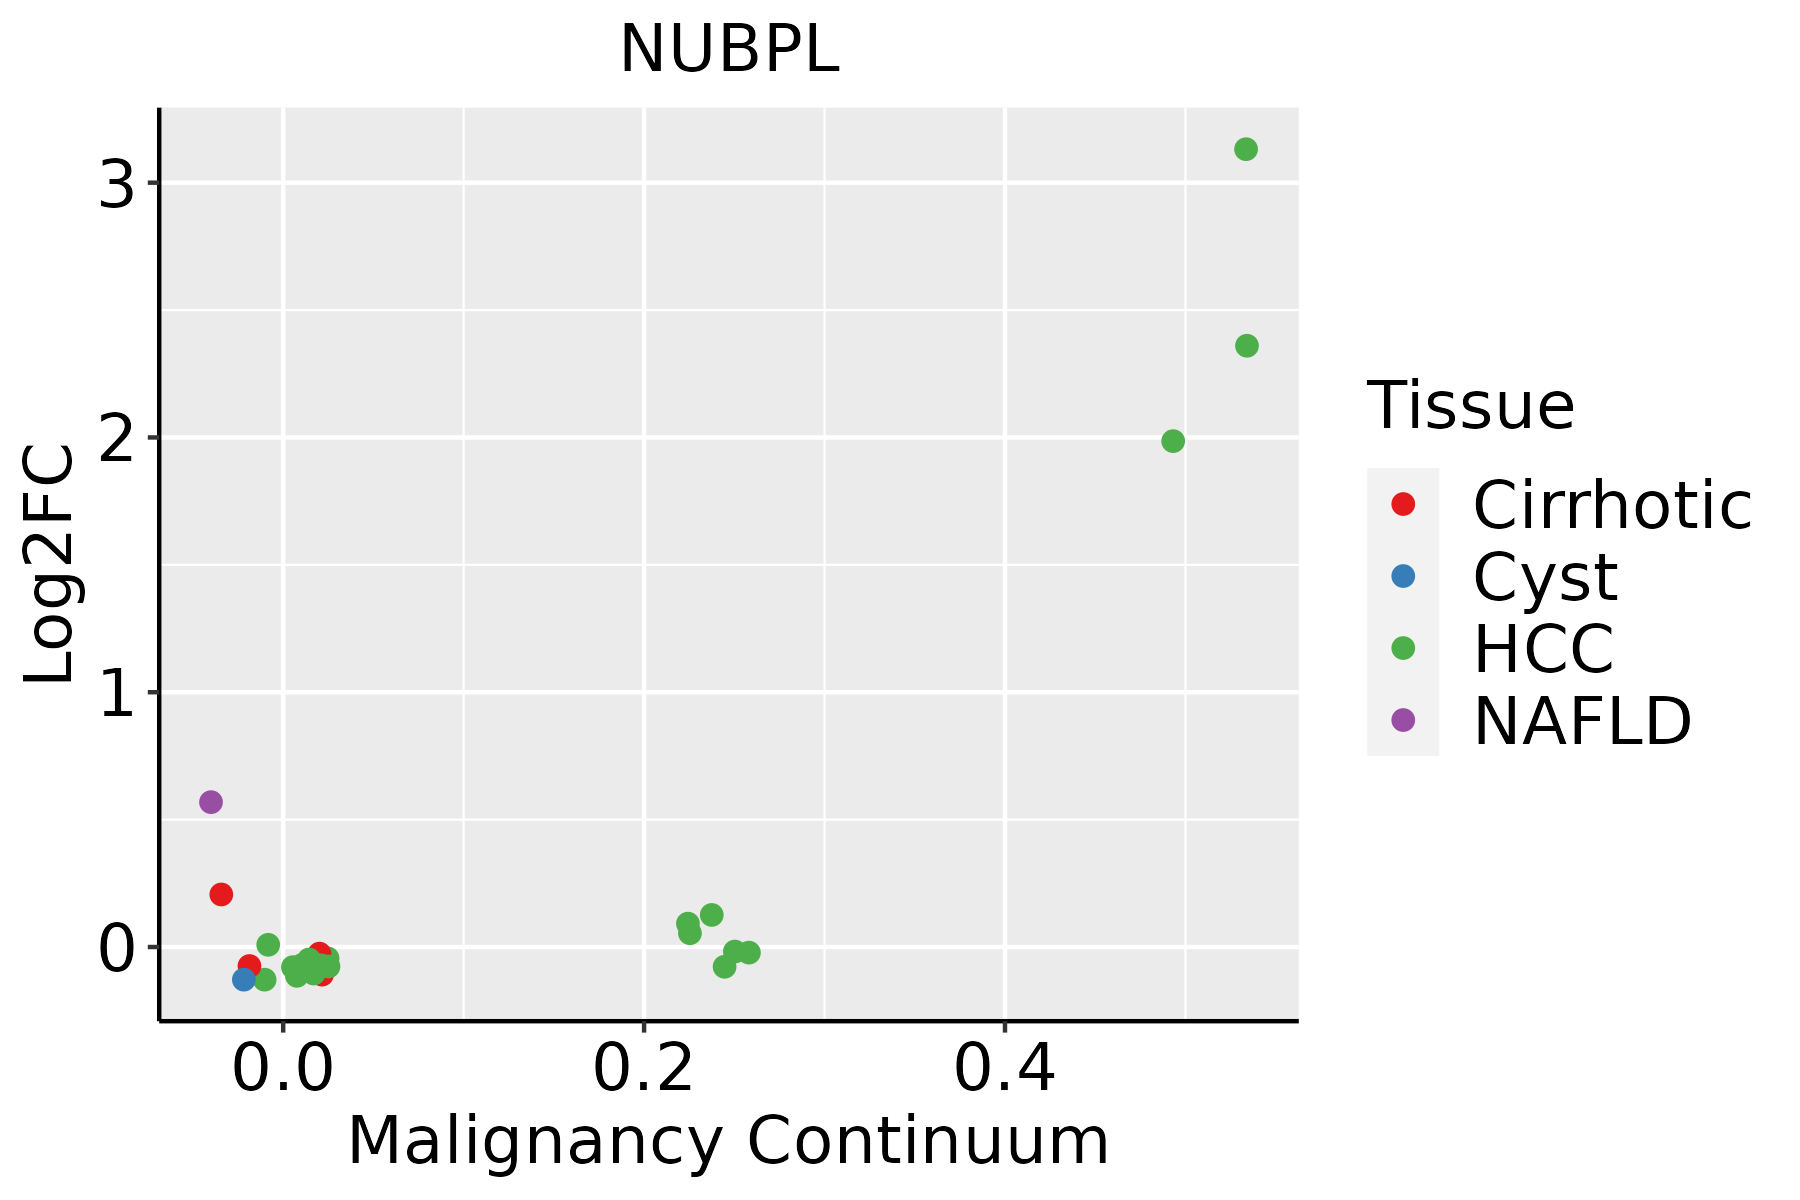
HCC: Hepatocellular carcinoma
NAFLD: Non-alcoholic fatty liver disease
LungThe image shows the transcriptomic changes along malignancy continuum.log2FC in expression of this searched gene in stem-like cells from each diseased tissue sample relative to stem-like cells in normal samples in each tissue plotted against the malignancy continuum. Samples are colored based on if they are from different disease stage.
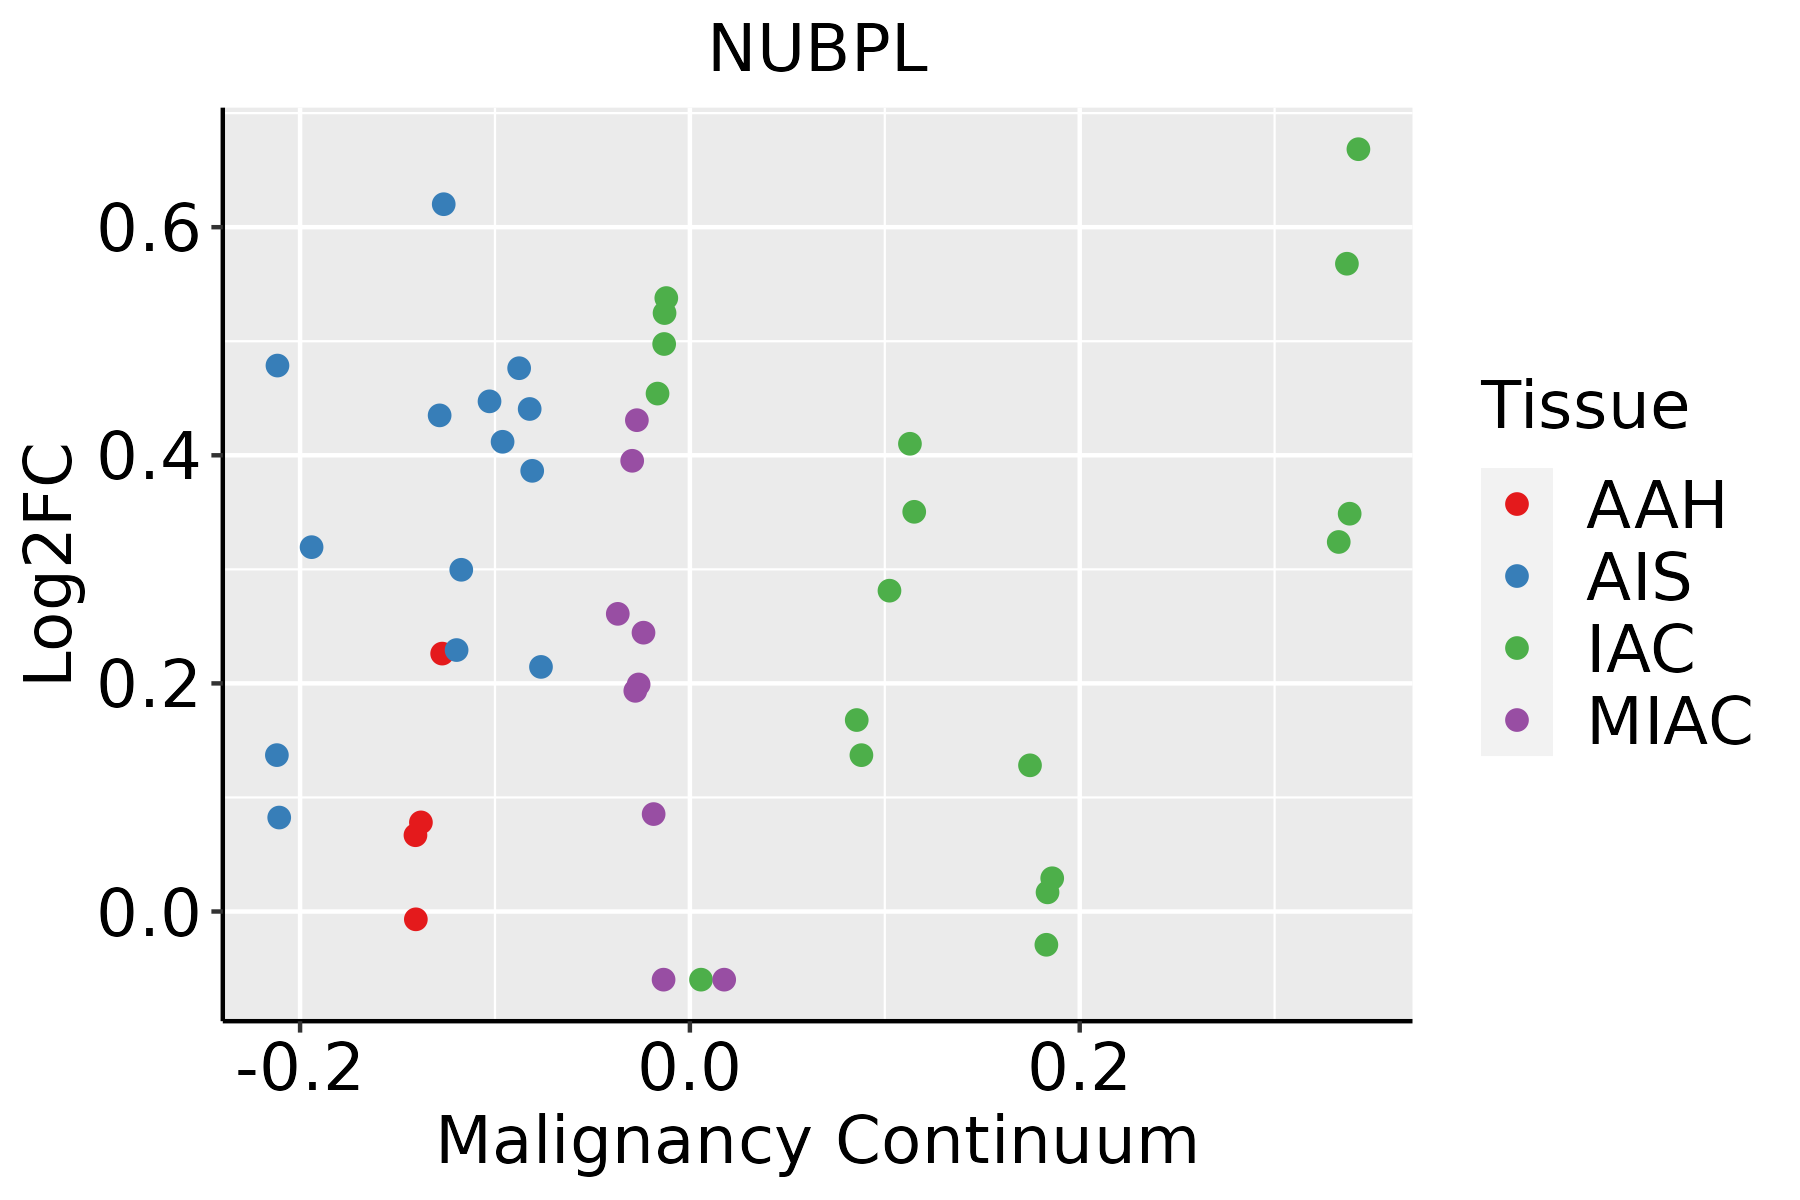
AAH: Atypical adenomatous hyperplasia
AIS: Adenocarcinoma in situ
IAC: Invasive lung adenocarcinoma
MIA: Minimally invasive adenocarcinoma
∗log2FC in expression of this searched gene in stem-like cells from each diseased tissue sample relative to stem-like cells in normal samples in each tissue plotted against the malignancy continuum. Samples are colored based on if they are from different disease stage.

Top

Malignant transformation related pathway analysis

check buttonFind out the enriched GO biological processes and KEGG pathways involved in transition from healthy to precancer to cancer
check button Figure of enriched GO biological processes.
TissueDisease StageEnriched GO biological Processes
ColorectumADGO analysis - Figure of enriched GO biological processes: Top 15 enriched GO BP terms are showed in the bar plot of each disease state in each tissue. Each row represents a significant GO biological process which is colored according to the -log10(p.adjust).
ColorectumSERGO analysis - Figure of enriched GO biological processes: Top 15 enriched GO BP terms are showed in the bar plot of each disease state in each tissue. Each row represents a significant GO biological process which is colored according to the -log10(p.adjust).
ColorectumMSSGO analysis - Figure of enriched GO biological processes: Top 15 enriched GO BP terms are showed in the bar plot of each disease state in each tissue. Each row represents a significant GO biological process which is colored according to the -log10(p.adjust).
ColorectumMSI-HGO analysis - Figure of enriched GO biological processes: Top 15 enriched GO BP terms are showed in the bar plot of each disease state in each tissue. Each row represents a significant GO biological process which is colored according to the -log10(p.adjust).
ColorectumFAPGO analysis - Figure of enriched GO biological processes: Top 15 enriched GO BP terms are showed in the bar plot of each disease state in each tissue. Each row represents a significant GO biological process which is colored according to the -log10(p.adjust).
∗Top 15 enriched GO BP terms are showed in the bar plot of each disease state in each tissue. Each row represents a significant GO biological process which is colored according to the -log10(p.adjust).
Page: 1 2 3 4 5 6 7 8 9 

check button Enriched GO biological processes.
GO IDTissueDisease StageDescriptionGene RatioBg Ratiopvaluep.adjustCount
GO:0010257ColorectumADNADH dehydrogenase complex assembly34/391857/187232.15e-101.89e-0834
GO:0032981ColorectumADmitochondrial respiratory chain complex I assembly34/391857/187232.15e-101.89e-0834
GO:0033108ColorectumADmitochondrial respiratory chain complex assembly46/391893/187238.95e-106.91e-0846
GO:0006790ColorectumADsulfur compound metabolic process101/3918339/187236.46e-051.07e-03101
GO:0070584ColorectumADmitochondrion morphogenesis12/391821/187233.02e-043.62e-0312
GO:00102572ColorectumMSSNADH dehydrogenase complex assembly33/346757/187234.07e-114.86e-0933
GO:00329812ColorectumMSSmitochondrial respiratory chain complex I assembly33/346757/187234.07e-114.86e-0933
GO:00331082ColorectumMSSmitochondrial respiratory chain complex assembly44/346793/187232.17e-102.09e-0844
GO:00705842ColorectumMSSmitochondrion morphogenesis12/346721/187238.83e-051.41e-0312
GO:00067902ColorectumMSSsulfur compound metabolic process85/3467339/187231.52e-031.39e-0285
GO:00705843ColorectumFAPmitochondrion morphogenesis9/262221/187231.22e-031.14e-029
GO:00705844ColorectumCRCmitochondrion morphogenesis8/207821/187231.22e-031.38e-028
GO:0033108110EsophagusESCCmitochondrial respiratory chain complex assembly83/855293/187239.56e-191.05e-1683
GO:0010257110EsophagusESCCNADH dehydrogenase complex assembly50/855257/187233.78e-111.24e-0950
GO:0032981110EsophagusESCCmitochondrial respiratory chain complex I assembly50/855257/187233.78e-111.24e-0950
GO:00067906EsophagusESCCsulfur compound metabolic process201/8552339/187232.64e-073.94e-06201
GO:00705848EsophagusESCCmitochondrion morphogenesis18/855221/187231.81e-041.16e-0318
GO:001622611EsophagusESCCiron-sulfur cluster assembly21/855226/187232.69e-041.63e-0321
GO:003116311EsophagusESCCmetallo-sulfur cluster assembly21/855226/187232.69e-041.63e-0321
GO:00067904LiverNAFLDsulfur compound metabolic process58/1882339/187233.79e-059.38e-0458
Page: 1 2 

check button Enriched KEGG pathways.
Pathway IDTissueDisease StageDescriptionGene RatioBg Ratiopvaluep.adjustqvalueCount
Page: 1 

Top

Cell-cell communication analysis

check buttonIdentification of potential cell-cell interactions between two cell types and their ligand-receptor pairs for different disease states
LigandReceptorLRpairPathwayTissueDisease Stage
Page: 1 

Top

Single-cell gene regulatory network inference analysis

check buttonFind out the significant the regulons (TFs) and the target genes of each regulon across cell types for different disease states
TFCell TypeTissueDisease StageTarget GeneRSSRegulon Activity
∗The dot plots of a searched regulon are shown for all cell subpopulations in each disease state of each tissue based on the regulon specific score inferred using pySCENIC and by calculating the average expression.
Page: 1 

Top

Somatic mutation of malignant transformation related genes

check buttonAnnotation of somatic variants for genes involved in malignant transformation
Hugo SymbolVariant ClassVariant ClassificationdbSNP RSHGVScHGVSpHGVSp ShortSWISSPROTBIOTYPESIFTPolyPhenTumor Sample BarcodeTissueHistologySexAgeStageTherapy TypesDrugsOutcome
NUBPLinsertionIn_Frame_Insnovelc.676_677insACCATGTTAp.Arg226delinsHisHisValSerp.R226delinsHHVSQ8TB37protein_codingTCGA-A7-A0CJ-01Breastbreast invasive carcinomaFemale<65I/IIChemotherapycytoxanSD
NUBPLinsertionIn_Frame_Insnovelc.678_679insCAGGCTGGTCTTGAACTCCTGACCCCAp.Arg226_Arg227insGlnAlaGlyLeuGluLeuLeuThrProp.R226_R227insQAGLELLTPQ8TB37protein_codingTCGA-A7-A0CJ-01Breastbreast invasive carcinomaFemale<65I/IIChemotherapycytoxanSD
NUBPLSNVMissense_Mutationrs781341998c.488C>Tp.Ser163Leup.S163LQ8TB37protein_codingdeleterious(0)benign(0.232)TCGA-C5-A1BL-01Cervixcervical & endocervical cancerFemale<65I/IIUnknownUnknownSD
NUBPLSNVMissense_Mutationc.316N>Ap.Val106Metp.V106MQ8TB37protein_codingdeleterious(0)possibly_damaging(0.549)TCGA-C5-A7UC-01Cervixcervical & endocervical cancerFemale<65I/IIUnknownUnknownSD
NUBPLSNVMissense_Mutationnovelc.717N>Cp.Met239Ilep.M239IQ8TB37protein_codingdeleterious(0)probably_damaging(0.999)TCGA-JW-A5VL-01Cervixcervical & endocervical cancerFemale<65I/IIUnknownUnknownSD
NUBPLSNVMissense_Mutationc.613N>Ap.Val205Metp.V205MQ8TB37protein_codingdeleterious(0.01)probably_damaging(0.973)TCGA-LP-A4AV-01Cervixcervical & endocervical cancerFemale<65I/IIUnknownUnknownSD
NUBPLSNVMissense_Mutationc.805N>Cp.Glu269Glnp.E269QQ8TB37protein_codingtolerated(0.15)benign(0.003)TCGA-Q1-A5R2-01Cervixcervical & endocervical cancerFemale<65I/IIChemotherapycisplatinPR
NUBPLSNVMissense_Mutationnovelc.680G>Cp.Arg227Thrp.R227TQ8TB37protein_codingdeleterious(0)benign(0.003)TCGA-UC-A7PI-01Cervixcervical & endocervical cancerFemale<65I/IIUnknownUnknownPD
NUBPLSNVMissense_Mutationrs749762773c.640N>Ap.Ala214Thrp.A214TQ8TB37protein_codingdeleterious(0)probably_damaging(0.992)TCGA-A6-2680-01Colorectumcolon adenocarcinomaFemale>=65I/IIUnknownUnknownSD
NUBPLSNVMissense_Mutationrs776389264c.281C>Tp.Ala94Valp.A94VQ8TB37protein_codingtolerated(0.06)benign(0.391)TCGA-AZ-4313-01Colorectumcolon adenocarcinomaFemale<65I/IIUnknownUnknownSD
Page: 1 2 3 

Top

Related drugs of malignant transformation related genes

check buttonIdentification of chemicals and drugs interact with genes involved in malignant transfromation
(DGIdb 4.0)
Entrez IDSymbolCategoryInteraction TypesDrug Claim NameDrug NamePMIDs
80224NUBPLNAiloperidoneILOPERIDONE18521091
Page: 1