
|
|||||
|
 | |
| |
| |
| |
| |
| |
|
Gene: NUBP2 |
Gene summary for NUBP2 |
| Gene information | Species | Human | Gene symbol | NUBP2 | Gene ID | 10101 |
| Gene name | nucleotide binding protein 2 | |
| Gene Alias | CFD1 | |
| Cytomap | 16p13.3 | |
| Gene Type | protein-coding | GO ID | GO:0006790 | UniProtAcc | B7Z6P0 |
Top |
Malignant transformation analysis |
| Identification of the aberrant gene expression in precancerous and cancerous lesions by comparing the gene expression of stem-like cells in diseased tissues with normal stem cells |
| Entrez ID | Symbol | Replicates | Species | Organ | Tissue | Adj P-value | Log2FC | Malignancy |
| 10101 | NUBP2 | LZE4T | Human | Esophagus | ESCC | 8.61e-13 | 2.95e-01 | 0.0811 |
| 10101 | NUBP2 | LZE7T | Human | Esophagus | ESCC | 1.60e-13 | 8.00e-01 | 0.0667 |
| 10101 | NUBP2 | LZE8T | Human | Esophagus | ESCC | 4.18e-09 | 3.95e-01 | 0.067 |
| 10101 | NUBP2 | LZE20T | Human | Esophagus | ESCC | 5.09e-13 | 3.61e-01 | 0.0662 |
| 10101 | NUBP2 | LZE22D1 | Human | Esophagus | HGIN | 3.92e-03 | 2.24e-01 | 0.0595 |
| 10101 | NUBP2 | LZE24T | Human | Esophagus | ESCC | 2.80e-18 | 5.71e-01 | 0.0596 |
| 10101 | NUBP2 | LZE21T | Human | Esophagus | ESCC | 1.48e-05 | 3.26e-01 | 0.0655 |
| 10101 | NUBP2 | LZE6T | Human | Esophagus | ESCC | 1.58e-08 | 4.26e-01 | 0.0845 |
| 10101 | NUBP2 | P1T-E | Human | Esophagus | ESCC | 8.47e-17 | 9.82e-01 | 0.0875 |
| 10101 | NUBP2 | P2T-E | Human | Esophagus | ESCC | 3.42e-66 | 1.17e+00 | 0.1177 |
| 10101 | NUBP2 | P4T-E | Human | Esophagus | ESCC | 5.32e-49 | 1.19e+00 | 0.1323 |
| 10101 | NUBP2 | P5T-E | Human | Esophagus | ESCC | 2.44e-27 | 5.49e-01 | 0.1327 |
| 10101 | NUBP2 | P8T-E | Human | Esophagus | ESCC | 3.48e-36 | 6.88e-01 | 0.0889 |
| 10101 | NUBP2 | P9T-E | Human | Esophagus | ESCC | 2.08e-16 | 4.08e-01 | 0.1131 |
| 10101 | NUBP2 | P10T-E | Human | Esophagus | ESCC | 1.65e-29 | 5.73e-01 | 0.116 |
| 10101 | NUBP2 | P11T-E | Human | Esophagus | ESCC | 2.25e-22 | 1.00e+00 | 0.1426 |
| 10101 | NUBP2 | P12T-E | Human | Esophagus | ESCC | 5.97e-60 | 1.07e+00 | 0.1122 |
| 10101 | NUBP2 | P15T-E | Human | Esophagus | ESCC | 1.39e-37 | 8.81e-01 | 0.1149 |
| 10101 | NUBP2 | P16T-E | Human | Esophagus | ESCC | 6.99e-38 | 6.30e-01 | 0.1153 |
| 10101 | NUBP2 | P17T-E | Human | Esophagus | ESCC | 2.02e-13 | 7.10e-01 | 0.1278 |
| Page: 1 2 3 4 5 6 7 |
| Tissue | Expression Dynamics | Abbreviation |
| Esophagus | 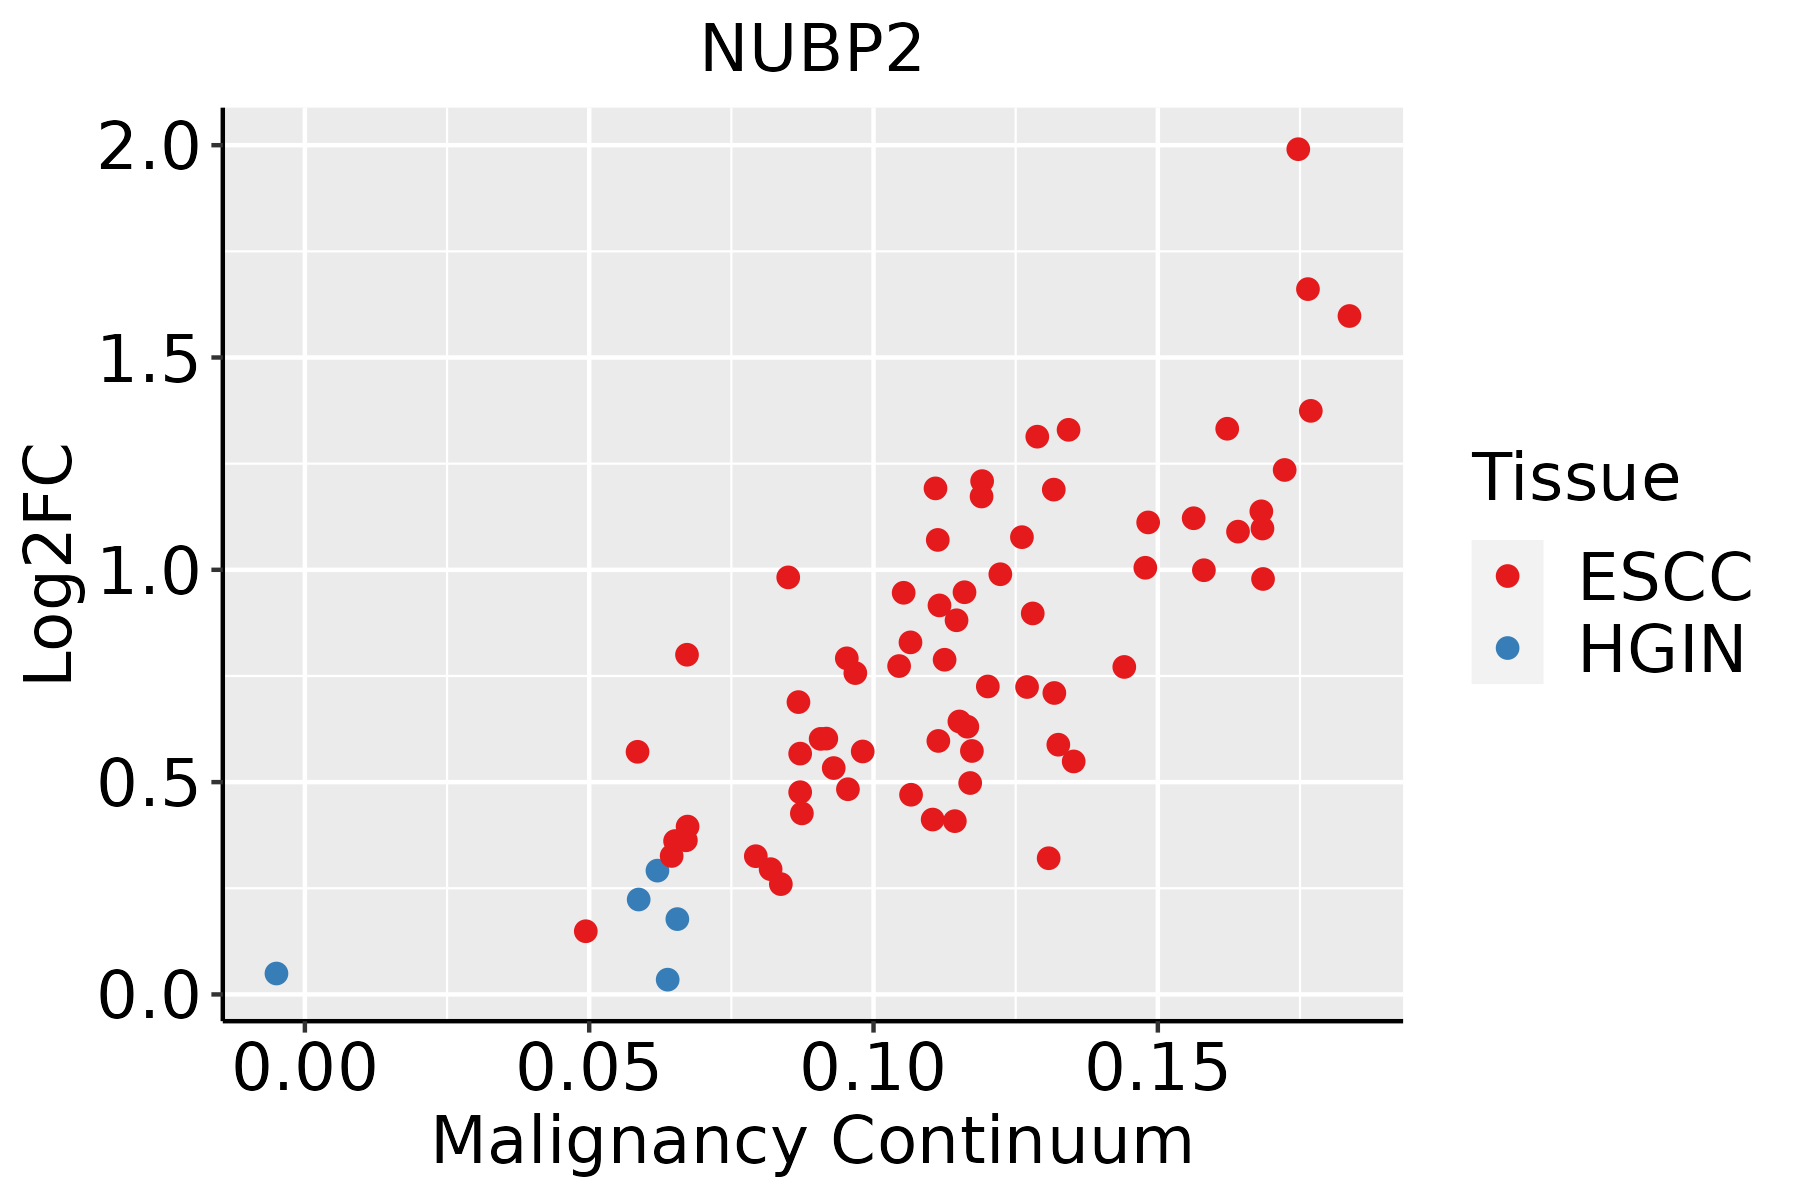 | ESCC: Esophageal squamous cell carcinoma |
| HGIN: High-grade intraepithelial neoplasias | ||
| LGIN: Low-grade intraepithelial neoplasias | ||
| Liver |  | HCC: Hepatocellular carcinoma |
| NAFLD: Non-alcoholic fatty liver disease | ||
| Oral Cavity | 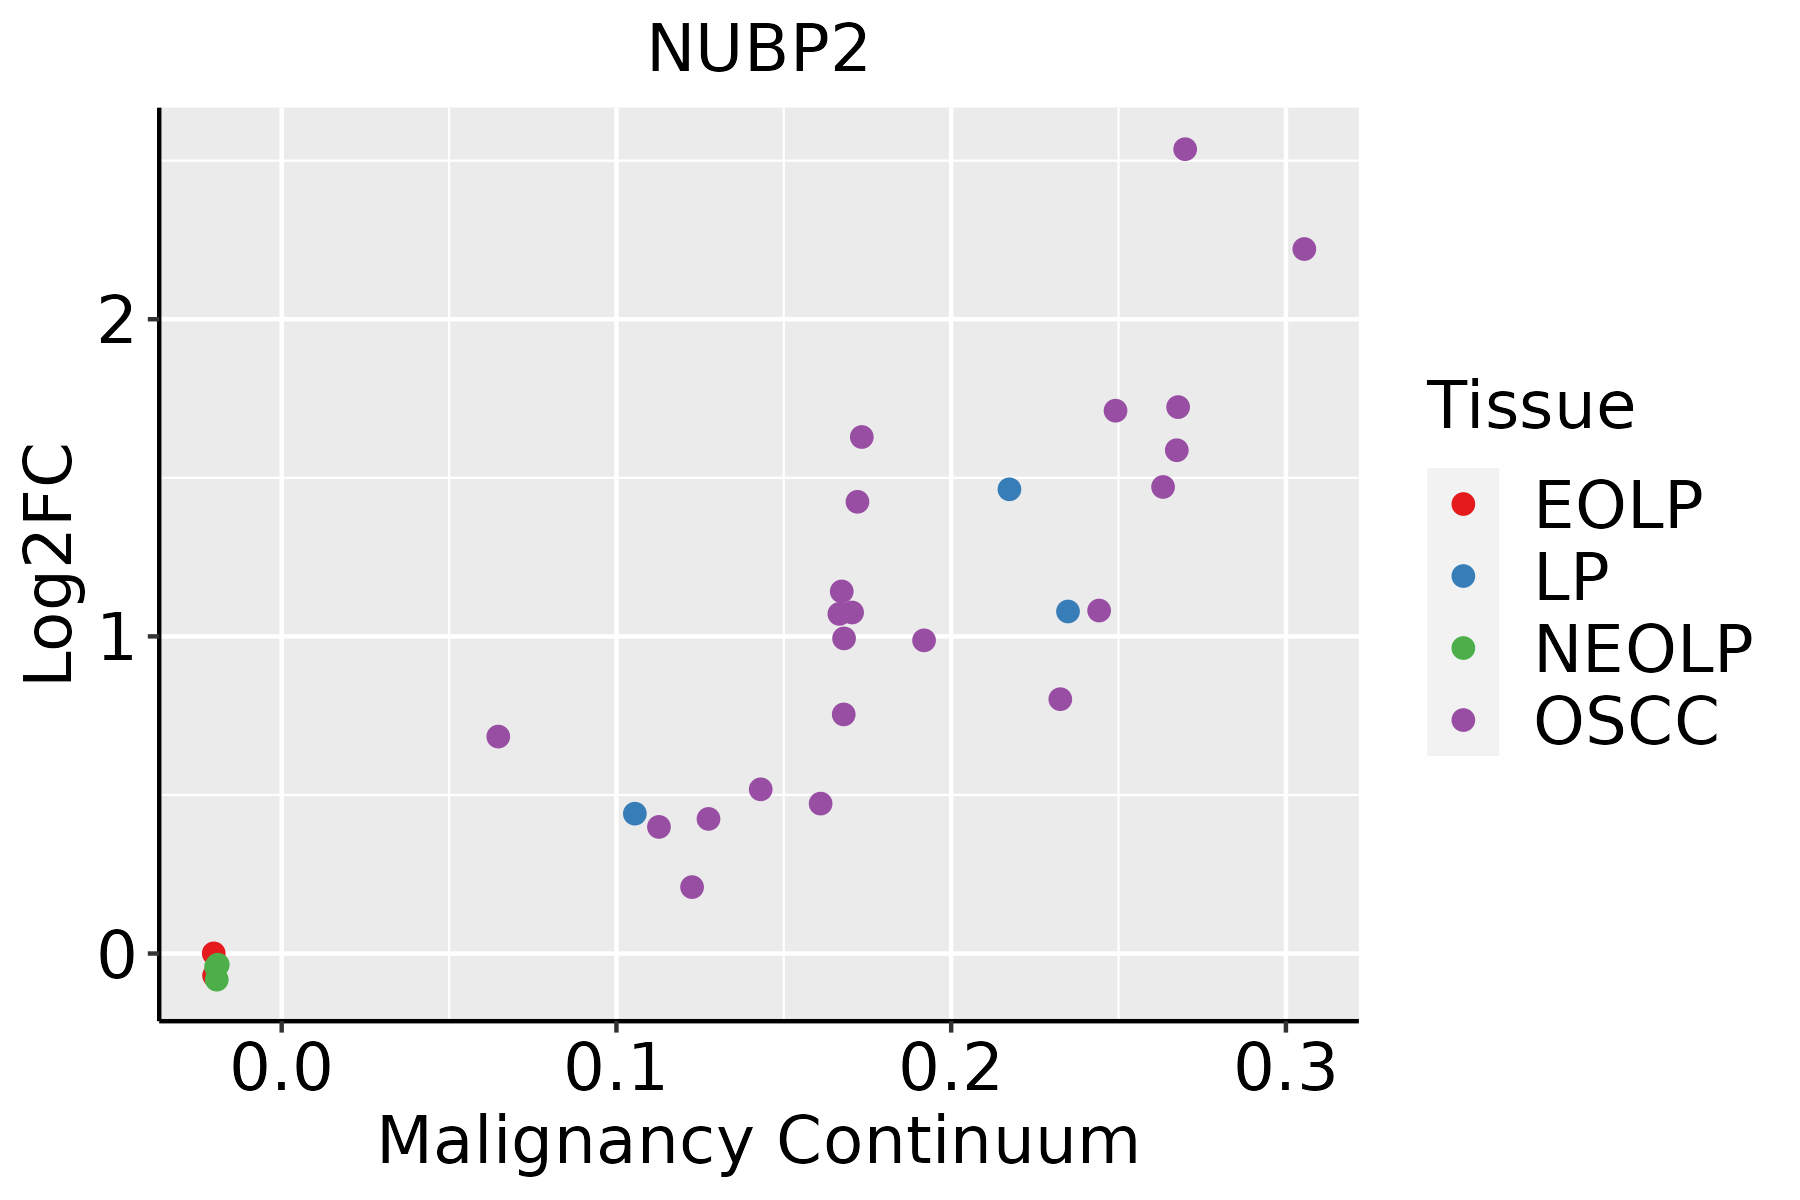 | EOLP: Erosive Oral lichen planus |
| LP: leukoplakia | ||
| NEOLP: Non-erosive oral lichen planus | ||
| OSCC: Oral squamous cell carcinoma | ||
| Skin | 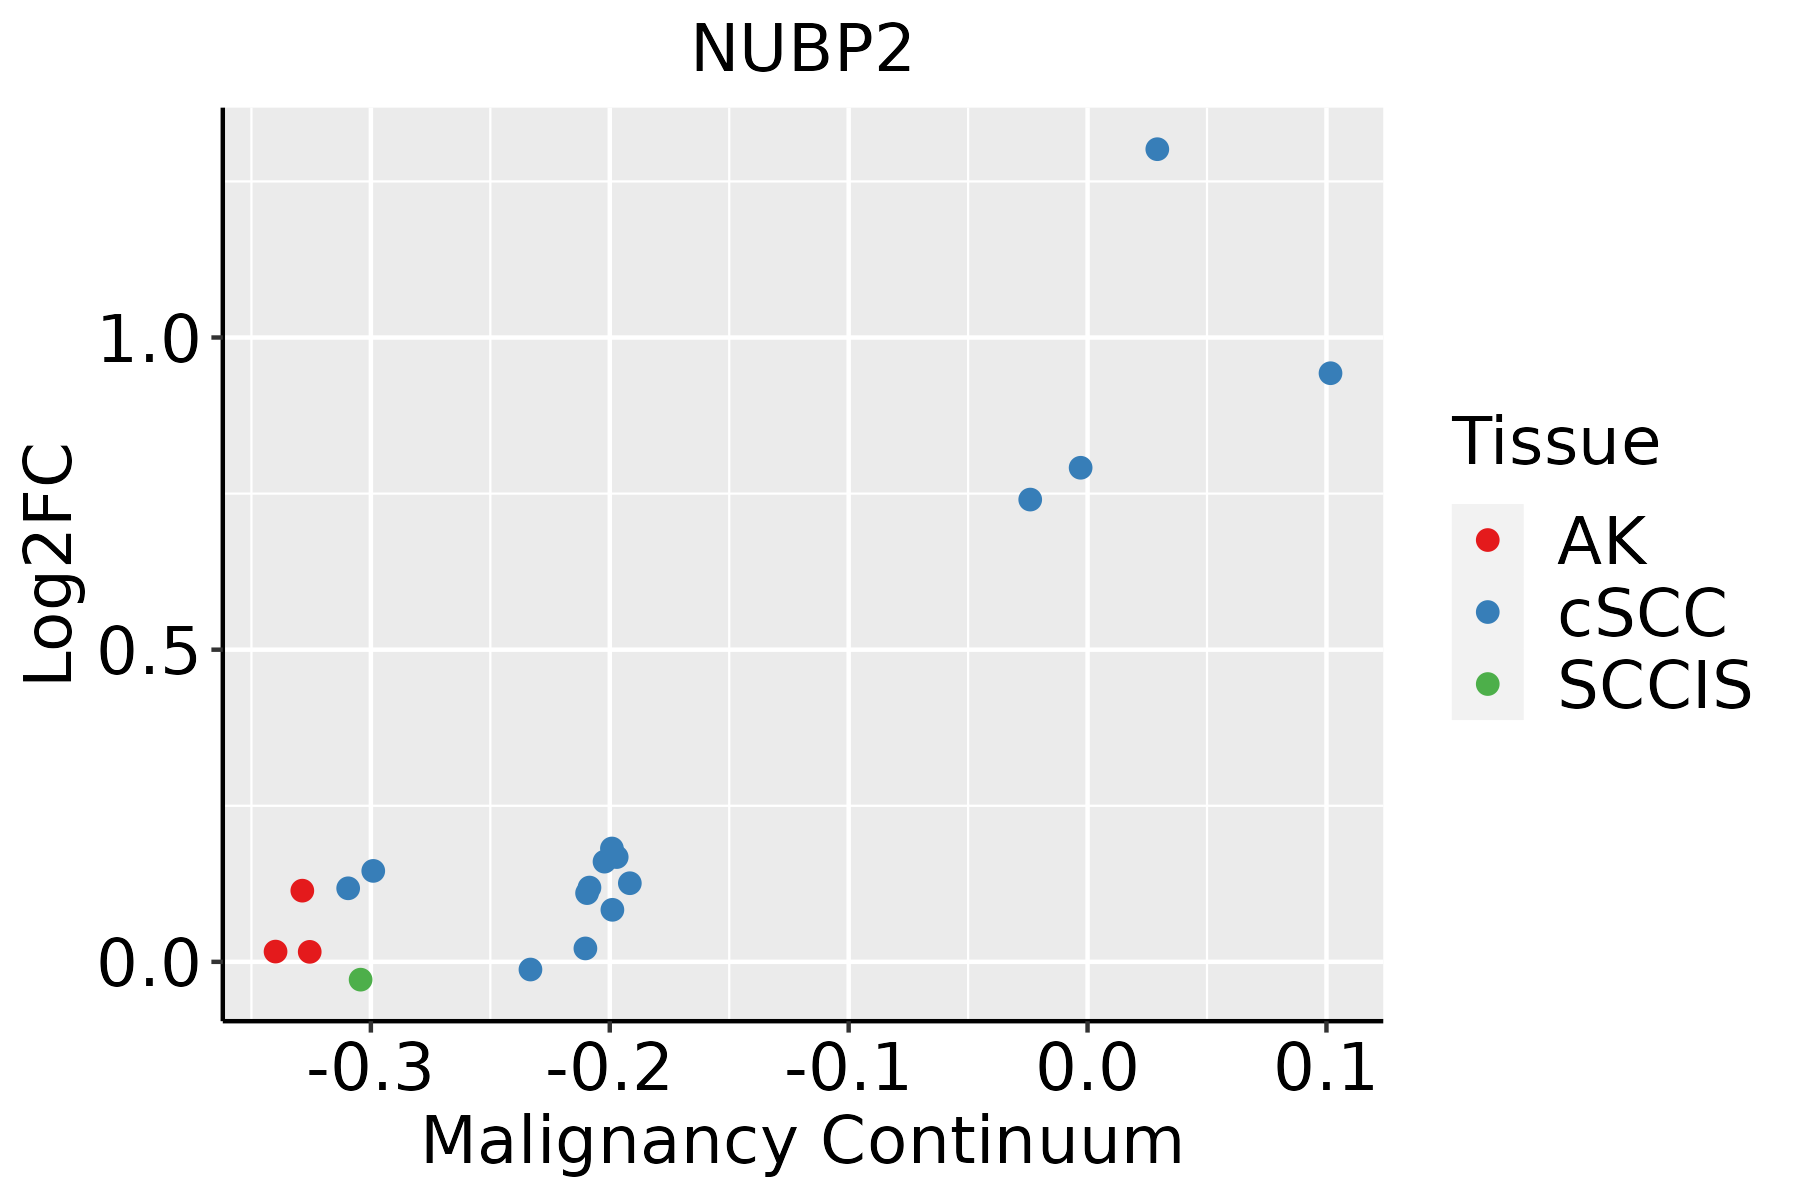 | AK: Actinic keratosis |
| cSCC: Cutaneous squamous cell carcinoma | ||
| SCCIS:squamous cell carcinoma in situ | ||
| Thyroid |  | ATC: Anaplastic thyroid cancer |
| HT: Hashimoto's thyroiditis | ||
| PTC: Papillary thyroid cancer |
| ∗log2FC in expression of this searched gene in stem-like cells from each diseased tissue sample relative to stem-like cells in normal samples in each tissue plotted against the malignancy continuum. Samples are colored based on if they are from different disease stage. |
Top |
Malignant transformation related pathway analysis |
| Find out the enriched GO biological processes and KEGG pathways involved in transition from healthy to precancer to cancer |
| Tissue | Disease Stage | Enriched GO biological Processes |
| Colorectum | AD |  |
| Colorectum | SER |  |
| Colorectum | MSS |  |
| Colorectum | MSI-H |  |
| Colorectum | FAP |  |
| ∗Top 15 enriched GO BP terms are showed in the bar plot of each disease state in each tissue. Each row represents a significant GO biological process which is colored according to the -log10(p.adjust). |
| Page: 1 2 3 4 5 6 7 8 9 |
| GO ID | Tissue | Disease Stage | Description | Gene Ratio | Bg Ratio | pvalue | p.adjust | Count |
| GO:00162263 | Esophagus | HGIN | iron-sulfur cluster assembly | 10/2587 | 26/18723 | 1.60e-03 | 1.79e-02 | 10 |
| GO:00311633 | Esophagus | HGIN | metallo-sulfur cluster assembly | 10/2587 | 26/18723 | 1.60e-03 | 1.79e-02 | 10 |
| GO:00067906 | Esophagus | ESCC | sulfur compound metabolic process | 201/8552 | 339/18723 | 2.64e-07 | 3.94e-06 | 201 |
| GO:001622611 | Esophagus | ESCC | iron-sulfur cluster assembly | 21/8552 | 26/18723 | 2.69e-04 | 1.63e-03 | 21 |
| GO:003116311 | Esophagus | ESCC | metallo-sulfur cluster assembly | 21/8552 | 26/18723 | 2.69e-04 | 1.63e-03 | 21 |
| GO:000679011 | Liver | Cirrhotic | sulfur compound metabolic process | 129/4634 | 339/18723 | 3.06e-08 | 1.04e-06 | 129 |
| GO:000679021 | Liver | HCC | sulfur compound metabolic process | 212/7958 | 339/18723 | 5.60e-14 | 3.39e-12 | 212 |
| GO:0016226 | Liver | HCC | iron-sulfur cluster assembly | 18/7958 | 26/18723 | 5.37e-03 | 2.24e-02 | 18 |
| GO:0031163 | Liver | HCC | metallo-sulfur cluster assembly | 18/7958 | 26/18723 | 5.37e-03 | 2.24e-02 | 18 |
| GO:00067905 | Oral cavity | OSCC | sulfur compound metabolic process | 168/7305 | 339/18723 | 4.50e-05 | 3.84e-04 | 168 |
| GO:00162262 | Oral cavity | OSCC | iron-sulfur cluster assembly | 19/7305 | 26/18723 | 4.46e-04 | 2.70e-03 | 19 |
| GO:00311632 | Oral cavity | OSCC | metallo-sulfur cluster assembly | 19/7305 | 26/18723 | 4.46e-04 | 2.70e-03 | 19 |
| GO:00162261 | Oral cavity | LP | iron-sulfur cluster assembly | 15/4623 | 26/18723 | 3.34e-04 | 3.34e-03 | 15 |
| GO:00311631 | Oral cavity | LP | metallo-sulfur cluster assembly | 15/4623 | 26/18723 | 3.34e-04 | 3.34e-03 | 15 |
| GO:000679012 | Oral cavity | LP | sulfur compound metabolic process | 106/4623 | 339/18723 | 3.36e-03 | 2.25e-02 | 106 |
| GO:00162264 | Skin | cSCC | iron-sulfur cluster assembly | 14/4864 | 26/18723 | 2.26e-03 | 1.32e-02 | 14 |
| GO:00311634 | Skin | cSCC | metallo-sulfur cluster assembly | 14/4864 | 26/18723 | 2.26e-03 | 1.32e-02 | 14 |
| Page: 1 |
| Pathway ID | Tissue | Disease Stage | Description | Gene Ratio | Bg Ratio | pvalue | p.adjust | qvalue | Count |
| Page: 1 |
Top |
Cell-cell communication analysis |
| Identification of potential cell-cell interactions between two cell types and their ligand-receptor pairs for different disease states |
| Ligand | Receptor | LRpair | Pathway | Tissue | Disease Stage |
| Page: 1 |
Top |
Single-cell gene regulatory network inference analysis |
| Find out the significant the regulons (TFs) and the target genes of each regulon across cell types for different disease states |
| TF | Cell Type | Tissue | Disease Stage | Target Gene | RSS | Regulon Activity |
| ∗The dot plots of a searched regulon are shown for all cell subpopulations in each disease state of each tissue based on the regulon specific score inferred using pySCENIC and by calculating the average expression. |
| Page: 1 |
Top |
Somatic mutation of malignant transformation related genes |
| Annotation of somatic variants for genes involved in malignant transformation |
| Hugo Symbol | Variant Class | Variant Classification | dbSNP RS | HGVSc | HGVSp | HGVSp Short | SWISSPROT | BIOTYPE | SIFT | PolyPhen | Tumor Sample Barcode | Tissue | Histology | Sex | Age | Stage | Therapy Types | Drugs | Outcome |
| NUBP2 | SNV | Missense_Mutation | novel | c.415G>A | p.Asp139Asn | p.D139N | Q9Y5Y2 | protein_coding | deleterious(0) | probably_damaging(0.954) | TCGA-D8-A146-01 | Breast | breast invasive carcinoma | Female | <65 | I/II | Unknown | Unknown | SD |
| NUBP2 | SNV | Missense_Mutation | novel | c.640C>A | p.Leu214Met | p.L214M | Q9Y5Y2 | protein_coding | tolerated(0.49) | probably_damaging(0.996) | TCGA-2W-A8YY-01 | Cervix | cervical & endocervical cancer | Female | <65 | I/II | Chemotherapy | cisplatin | CR |
| NUBP2 | SNV | Missense_Mutation | c.699G>A | p.Met233Ile | p.M233I | Q9Y5Y2 | protein_coding | tolerated(0.45) | benign(0) | TCGA-EK-A2RB-01 | Cervix | cervical & endocervical cancer | Female | <65 | I/II | Unknown | Unknown | SD | |
| NUBP2 | SNV | Missense_Mutation | rs199651045 | c.118C>T | p.Arg40Cys | p.R40C | Q9Y5Y2 | protein_coding | tolerated(0.15) | possibly_damaging(0.773) | TCGA-AA-3488-01 | Colorectum | colon adenocarcinoma | Male | <65 | III/IV | Unknown | Unknown | PD |
| NUBP2 | SNV | Missense_Mutation | c.398N>T | p.Thr133Met | p.T133M | Q9Y5Y2 | protein_coding | deleterious(0) | probably_damaging(1) | TCGA-AA-3492-01 | Colorectum | colon adenocarcinoma | Female | >=65 | I/II | Unknown | Unknown | SD | |
| NUBP2 | SNV | Missense_Mutation | c.71N>A | p.Gly24Glu | p.G24E | Q9Y5Y2 | protein_coding | deleterious(0) | probably_damaging(1) | TCGA-AF-4110-01 | Colorectum | rectum adenocarcinoma | Male | >=65 | I/II | Chemotherapy | oxaliplatin | SD | |
| NUBP2 | SNV | Missense_Mutation | c.448N>T | p.Pro150Ser | p.P150S | Q9Y5Y2 | protein_coding | tolerated(0.42) | benign(0.017) | TCGA-AP-A059-01 | Endometrium | uterine corpus endometrioid carcinoma | Female | >=65 | I/II | Unknown | Unknown | SD | |
| NUBP2 | SNV | Missense_Mutation | novel | c.56N>C | p.Val19Ala | p.V19A | Q9Y5Y2 | protein_coding | deleterious(0) | possibly_damaging(0.898) | TCGA-AX-A2HD-01 | Endometrium | uterine corpus endometrioid carcinoma | Female | >=65 | III/IV | Unknown | Unknown | SD |
| NUBP2 | SNV | Missense_Mutation | rs749655410 | c.592C>T | p.His198Tyr | p.H198Y | Q9Y5Y2 | protein_coding | tolerated(0.08) | possibly_damaging(0.516) | TCGA-BG-A220-01 | Endometrium | uterine corpus endometrioid carcinoma | Female | >=65 | I/II | Unknown | Unknown | SD |
| NUBP2 | SNV | Missense_Mutation | rs199651045 | c.118C>T | p.Arg40Cys | p.R40C | Q9Y5Y2 | protein_coding | tolerated(0.15) | possibly_damaging(0.773) | TCGA-BS-A0UV-01 | Endometrium | uterine corpus endometrioid carcinoma | Female | <65 | III/IV | Unknown | Unknown | SD |
| Page: 1 2 3 |
Top |
Related drugs of malignant transformation related genes |
| Identification of chemicals and drugs interact with genes involved in malignant transfromation |
| (DGIdb 4.0) |
| Entrez ID | Symbol | Category | Interaction Types | Drug Claim Name | Drug Name | PMIDs |
| Page: 1 |

Copyright 2023-Present -The University of Texas Health Science Center at Houston |