Schematic overview of the cellular and molecular mechanisms involved in the cancer progression, including the proposed cellular and molecular mechanisms in cancer cells trajectory. AT1: alveolar type 1 cells; AT2: alveolar type 2 cells; AAH: atypical adenomatous hyperplasia; AIS: adenocarcinoma in situ; MIA: minimally invasive adenocarcinoma; IA: invasive adenocarcinoma; EMT: epithelial-mesenchymal transition

Home

Download

Statistics

Help

Contact

Center for Computational Systems Medicine
leaf

Gene summary

leaf

Malignant transformation analysis

leaf

Malignant transformation related pathway analysis

leaf

Cell-cell communication analysis

leaf

Single-cell gene regulatory network inference analysis

leaf

Somatic mutation of malignant transformation related genes

leaf

Related drugs of malignant transformation related genes

Gene: NUBP1

Gene summary for NUBP1

check button Gene summary.

Gene informationSpeciesHuman
Gene symbol

NUBP1

Gene ID

4682

Gene namenucleotide binding protein 1
Gene AliasCIAO5
Cytomap16p13.13
Gene Typeprotein-coding
GO ID

GO:0000226

UniProtAcc

P53384


Top

Malignant transformation analysis

check button Identification of the aberrant gene expression in precancerous and cancerous lesions by comparing the gene expression of stem-like cells in diseased tissues with normal stem cells
check button Malignant transformation involving gene list.
Entrez IDSymbolReplicatesSpeciesOrganTissueAdj P-valueLog2FCMalignancy
4682NUBP1LZE4THumanEsophagusESCC2.14e-062.33e-010.0811
4682NUBP1LZE8THumanEsophagusESCC6.02e-073.68e-010.067
4682NUBP1LZE20THumanEsophagusESCC3.84e-021.21e-010.0662
4682NUBP1LZE24THumanEsophagusESCC8.97e-092.06e-010.0596
4682NUBP1LZE6THumanEsophagusESCC5.63e-082.89e-010.0845
4682NUBP1P1T-EHumanEsophagusESCC1.81e-022.12e-010.0875
4682NUBP1P2T-EHumanEsophagusESCC1.58e-448.56e-010.1177
4682NUBP1P4T-EHumanEsophagusESCC1.34e-092.56e-010.1323
4682NUBP1P5T-EHumanEsophagusESCC9.98e-092.25e-010.1327
4682NUBP1P8T-EHumanEsophagusESCC8.98e-315.83e-010.0889
4682NUBP1P9T-EHumanEsophagusESCC1.99e-091.23e-010.1131
4682NUBP1P10T-EHumanEsophagusESCC2.66e-091.44e-010.116
4682NUBP1P11T-EHumanEsophagusESCC1.72e-185.97e-010.1426
4682NUBP1P12T-EHumanEsophagusESCC6.18e-284.97e-010.1122
4682NUBP1P15T-EHumanEsophagusESCC1.30e-153.00e-010.1149
4682NUBP1P16T-EHumanEsophagusESCC4.88e-203.23e-010.1153
4682NUBP1P17T-EHumanEsophagusESCC4.56e-124.17e-010.1278
4682NUBP1P19T-EHumanEsophagusESCC2.80e-074.53e-010.1662
4682NUBP1P20T-EHumanEsophagusESCC1.06e-143.40e-010.1124
4682NUBP1P21T-EHumanEsophagusESCC1.75e-274.81e-010.1617
Page: 1 2 3 4 5 

check button Transcriptomic changes along malignancy continuum.
TissueExpression DynamicsAbbreviation
EsophagusThe image shows the transcriptomic changes along malignancy continuum.log2FC in expression of this searched gene in stem-like cells from each diseased tissue sample relative to stem-like cells in normal samples in each tissue plotted against the malignancy continuum. Samples are colored based on if they are from different disease stage.
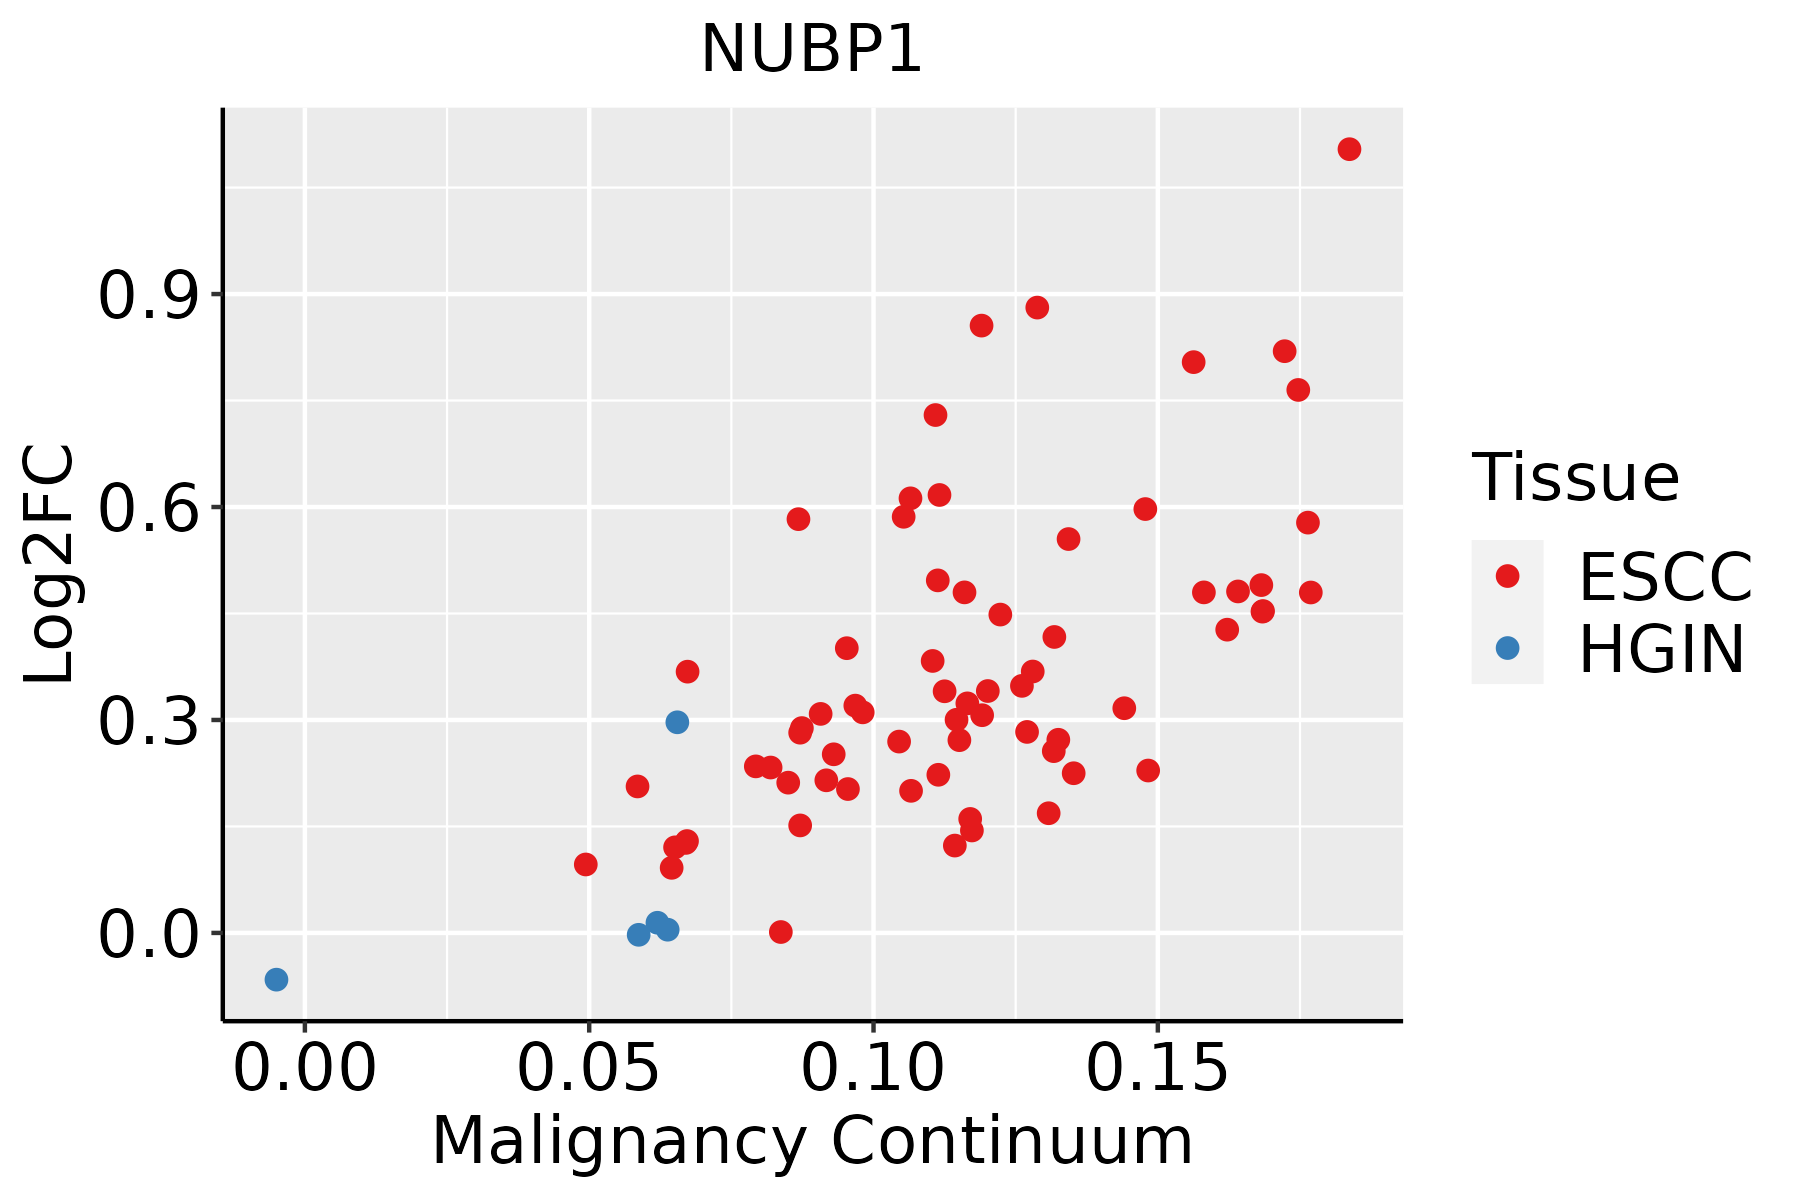
ESCC: Esophageal squamous cell carcinoma
HGIN: High-grade intraepithelial neoplasias
LGIN: Low-grade intraepithelial neoplasias
Oral CavityThe image shows the transcriptomic changes along malignancy continuum.log2FC in expression of this searched gene in stem-like cells from each diseased tissue sample relative to stem-like cells in normal samples in each tissue plotted against the malignancy continuum. Samples are colored based on if they are from different disease stage.
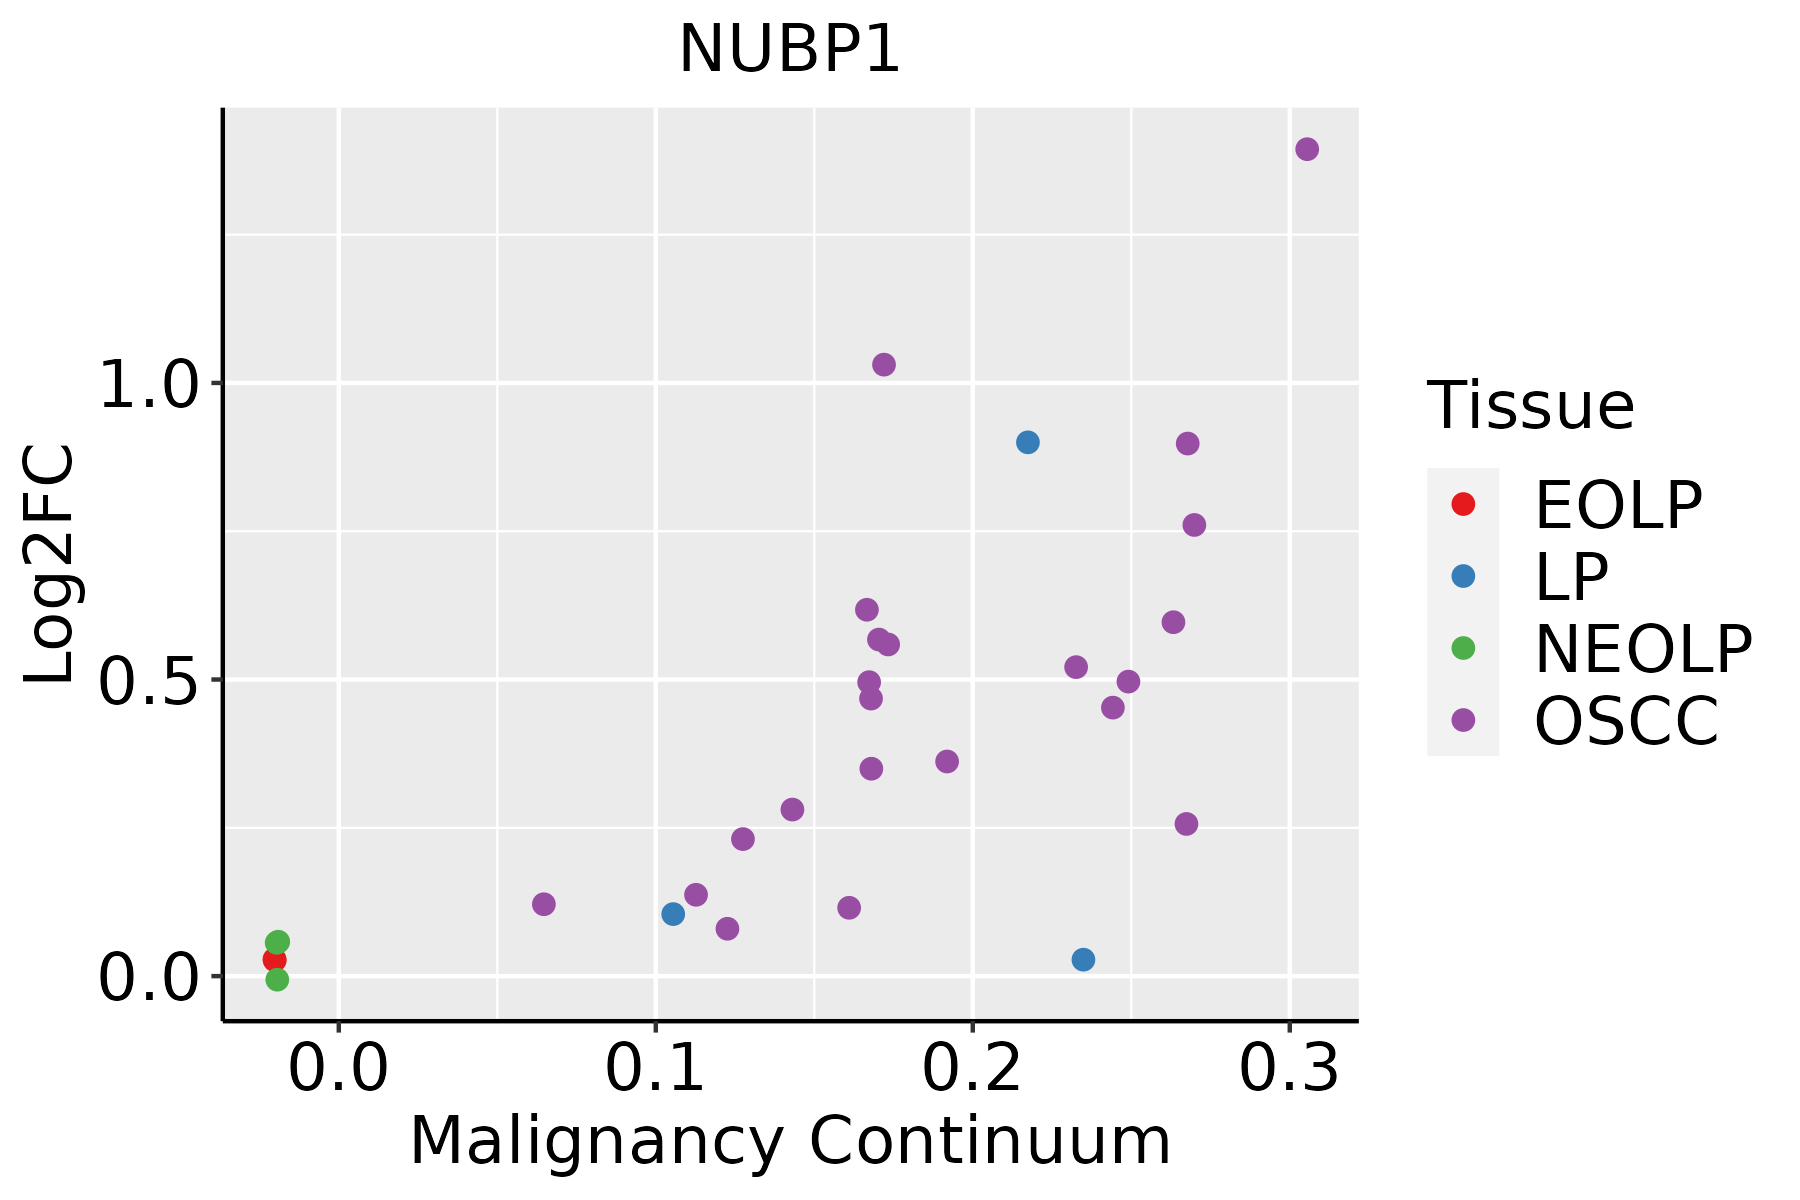
EOLP: Erosive Oral lichen planus
LP: leukoplakia
NEOLP: Non-erosive oral lichen planus
OSCC: Oral squamous cell carcinoma
SkinThe image shows the transcriptomic changes along malignancy continuum.log2FC in expression of this searched gene in stem-like cells from each diseased tissue sample relative to stem-like cells in normal samples in each tissue plotted against the malignancy continuum. Samples are colored based on if they are from different disease stage.
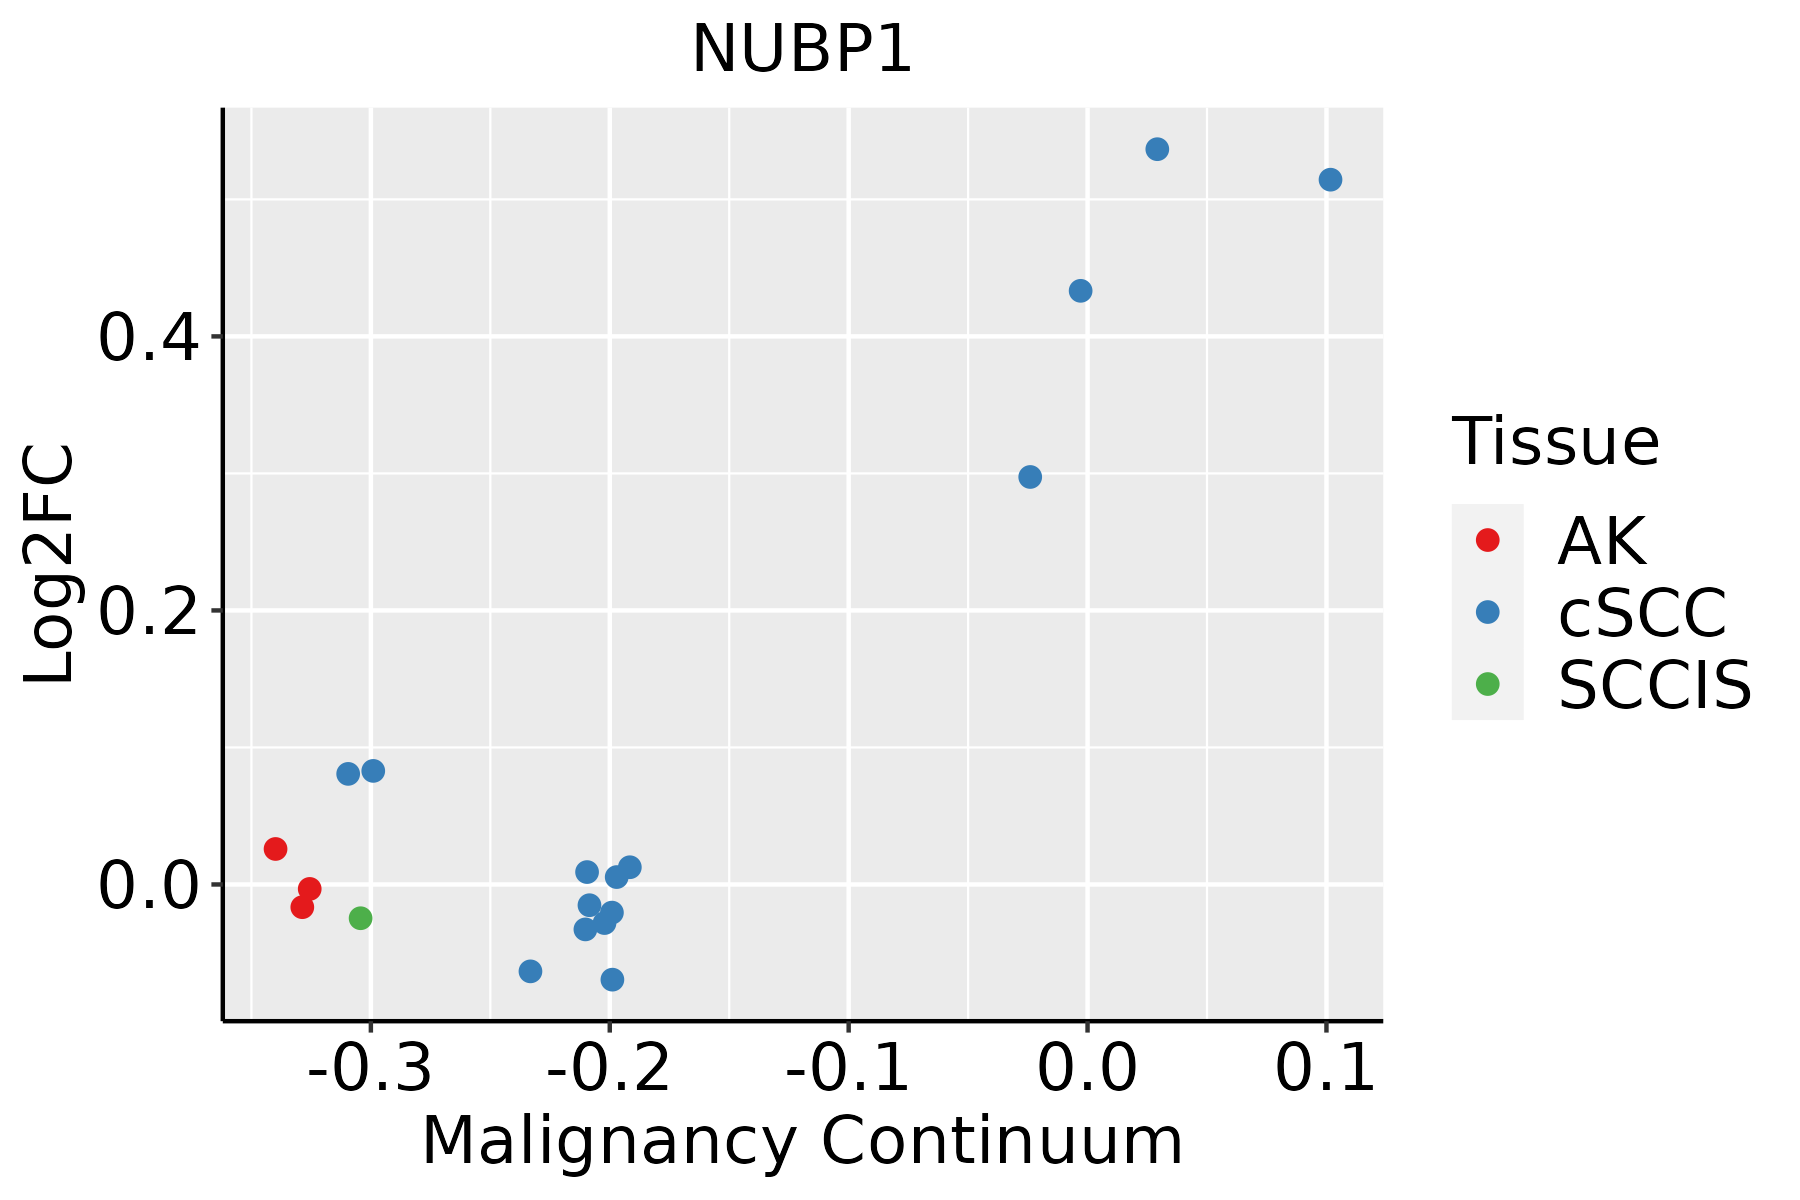
AK: Actinic keratosis
cSCC: Cutaneous squamous cell carcinoma
SCCIS:squamous cell carcinoma in situ
ThyroidThe image shows the transcriptomic changes along malignancy continuum.log2FC in expression of this searched gene in stem-like cells from each diseased tissue sample relative to stem-like cells in normal samples in each tissue plotted against the malignancy continuum. Samples are colored based on if they are from different disease stage.ATC: Anaplastic thyroid cancer
HT: Hashimoto's thyroiditis
PTC: Papillary thyroid cancer
∗log2FC in expression of this searched gene in stem-like cells from each diseased tissue sample relative to stem-like cells in normal samples in each tissue plotted against the malignancy continuum. Samples are colored based on if they are from different disease stage.

Top

Malignant transformation related pathway analysis

check buttonFind out the enriched GO biological processes and KEGG pathways involved in transition from healthy to precancer to cancer
check button Figure of enriched GO biological processes.
TissueDisease StageEnriched GO biological Processes
ColorectumADGO analysis - Figure of enriched GO biological processes: Top 15 enriched GO BP terms are showed in the bar plot of each disease state in each tissue. Each row represents a significant GO biological process which is colored according to the -log10(p.adjust).
ColorectumSERGO analysis - Figure of enriched GO biological processes: Top 15 enriched GO BP terms are showed in the bar plot of each disease state in each tissue. Each row represents a significant GO biological process which is colored according to the -log10(p.adjust).
ColorectumMSSGO analysis - Figure of enriched GO biological processes: Top 15 enriched GO BP terms are showed in the bar plot of each disease state in each tissue. Each row represents a significant GO biological process which is colored according to the -log10(p.adjust).
ColorectumMSI-HGO analysis - Figure of enriched GO biological processes: Top 15 enriched GO BP terms are showed in the bar plot of each disease state in each tissue. Each row represents a significant GO biological process which is colored according to the -log10(p.adjust).
ColorectumFAPGO analysis - Figure of enriched GO biological processes: Top 15 enriched GO BP terms are showed in the bar plot of each disease state in each tissue. Each row represents a significant GO biological process which is colored according to the -log10(p.adjust).
∗Top 15 enriched GO BP terms are showed in the bar plot of each disease state in each tissue. Each row represents a significant GO biological process which is colored according to the -log10(p.adjust).
Page: 1 2 3 4 5 6 7 8 9 

check button Enriched GO biological processes.
GO IDTissueDisease StageDescriptionGene RatioBg Ratiopvaluep.adjustCount
GO:199077819EsophagusESCCprotein localization to cell periphery217/8552333/187234.08e-131.88e-11217
GO:0016049110EsophagusESCCcell growth289/8552482/187231.29e-103.77e-09289
GO:00457865EsophagusESCCnegative regulation of cell cycle236/8552385/187233.62e-109.93e-09236
GO:0010639110EsophagusESCCnegative regulation of organelle organization215/8552348/187238.20e-102.01e-08215
GO:000155819EsophagusESCCregulation of cell growth248/8552414/187232.97e-096.45e-08248
GO:00067906EsophagusESCCsulfur compound metabolic process201/8552339/187232.64e-073.94e-06201
GO:00109484EsophagusESCCnegative regulation of cell cycle process177/8552294/187233.26e-074.59e-06177
GO:00618428EsophagusESCCmicrotubule organizing center localization28/855233/187233.80e-064.12e-0528
GO:00070982EsophagusESCCcentrosome cycle85/8552130/187234.41e-064.69e-0585
GO:00310233EsophagusESCCmicrotubule organizing center organization92/8552143/187235.04e-065.31e-0592
GO:00516428EsophagusESCCcentrosome localization27/855232/187237.10e-067.12e-0527
GO:005507617EsophagusESCCtransition metal ion homeostasis87/8552138/187232.85e-052.37e-0487
GO:001622611EsophagusESCCiron-sulfur cluster assembly21/855226/187232.69e-041.63e-0321
GO:003116311EsophagusESCCmetallo-sulfur cluster assembly21/855226/187232.69e-041.63e-0321
GO:00469169EsophagusESCCcellular transition metal ion homeostasis70/8552115/187237.28e-043.79e-0370
GO:00328864EsophagusESCCregulation of microtubule-based process134/8552240/187239.44e-044.80e-03134
GO:00550729EsophagusESCCiron ion homeostasis52/855285/187232.86e-031.21e-0252
GO:001604917Oral cavityOSCCcell growth268/7305482/187236.55e-143.51e-12268
GO:199077816Oral cavityOSCCprotein localization to cell periphery190/7305333/187231.46e-115.13e-10190
GO:000155816Oral cavityOSCCregulation of cell growth228/7305414/187231.74e-116.09e-10228
Page: 1 2 3 4 5 6 

check button Enriched KEGG pathways.
Pathway IDTissueDisease StageDescriptionGene RatioBg Ratiopvaluep.adjustqvalueCount
Page: 1 

Top

Cell-cell communication analysis

check buttonIdentification of potential cell-cell interactions between two cell types and their ligand-receptor pairs for different disease states
LigandReceptorLRpairPathwayTissueDisease Stage
Page: 1 

Top

Single-cell gene regulatory network inference analysis

check buttonFind out the significant the regulons (TFs) and the target genes of each regulon across cell types for different disease states
TFCell TypeTissueDisease StageTarget GeneRSSRegulon Activity
∗The dot plots of a searched regulon are shown for all cell subpopulations in each disease state of each tissue based on the regulon specific score inferred using pySCENIC and by calculating the average expression.
Page: 1 

Top

Somatic mutation of malignant transformation related genes

check buttonAnnotation of somatic variants for genes involved in malignant transformation
Hugo SymbolVariant ClassVariant ClassificationdbSNP RSHGVScHGVSpHGVSp ShortSWISSPROTBIOTYPESIFTPolyPhenTumor Sample BarcodeTissueHistologySexAgeStageTherapy TypesDrugsOutcome
NUBP1SNVMissense_Mutationnovelc.874N>Tp.Ala292Serp.A292SP53384protein_codingtolerated(0.17)possibly_damaging(0.802)TCGA-E9-A54X-01Breastbreast invasive carcinomaFemale>=65I/IIUnknownUnknownSD
NUBP1SNVMissense_Mutationc.16C>Tp.His6Tyrp.H6YP53384protein_codingdeleterious(0)benign(0.055)TCGA-EW-A1IW-01Breastbreast invasive carcinomaFemale>=65I/IIHormone TherapyaromasinSD
NUBP1insertionFrame_Shift_Insnovelc.520_521insGp.Pro174ArgfsTer6p.P174Rfs*6P53384protein_codingTCGA-A8-A08H-01Breastbreast invasive carcinomaFemale>=65I/IIUnknownUnknownSD
NUBP1insertionFrame_Shift_Insnovelc.521_522insCTGTAATCCCAGCACTTp.Gly175CysfsTer28p.G175Cfs*28P53384protein_codingTCGA-A8-A08H-01Breastbreast invasive carcinomaFemale>=65I/IIUnknownUnknownSD
NUBP1SNVMissense_Mutationc.492N>Tp.Glu164Aspp.E164DP53384protein_codingtolerated(0.65)benign(0.001)TCGA-A6-2672-01Colorectumcolon adenocarcinomaFemale>=65III/IVUnknownUnknownSD
NUBP1SNVMissense_Mutationnovelc.106N>Cp.Gly36Argp.G36RP53384protein_codingtolerated(0.12)benign(0.003)TCGA-AG-3580-01Colorectumrectum adenocarcinomaMale>=65I/IIUnknownUnknownSD
NUBP1insertionFrame_Shift_Insnovelc.493_494insAATCCACAGGGGATGCTTACTTTp.Val165GlufsTer40p.V165Efs*40P53384protein_codingTCGA-AA-3492-01Colorectumcolon adenocarcinomaFemale>=65I/IIUnknownUnknownSD
NUBP1SNVMissense_Mutationc.725C>Ap.Ser242Tyrp.S242YP53384protein_codingdeleterious(0)probably_damaging(0.954)TCGA-AP-A051-01Endometriumuterine corpus endometrioid carcinomaFemale>=65I/IIUnknownUnknownSD
NUBP1SNVMissense_Mutationc.16C>Tp.His6Tyrp.H6YP53384protein_codingdeleterious(0)benign(0.055)TCGA-B5-A0JX-01Endometriumuterine corpus endometrioid carcinomaFemale<65I/IIUnknownUnknownSD
NUBP1SNVMissense_Mutationc.413N>Ap.Pro138Hisp.P138HP53384protein_codingdeleterious(0.02)possibly_damaging(0.779)TCGA-B5-A11E-01Endometriumuterine corpus endometrioid carcinomaFemale<65I/IIUnknownUnknownSD
Page: 1 2 3 

Top

Related drugs of malignant transformation related genes

check buttonIdentification of chemicals and drugs interact with genes involved in malignant transfromation
(DGIdb 4.0)
Entrez IDSymbolCategoryInteraction TypesDrug Claim NameDrug NamePMIDs
Page: 1