Schematic overview of the cellular and molecular mechanisms involved in the cancer progression, including the proposed cellular and molecular mechanisms in cancer cells trajectory. AT1: alveolar type 1 cells; AT2: alveolar type 2 cells; AAH: atypical adenomatous hyperplasia; AIS: adenocarcinoma in situ; MIA: minimally invasive adenocarcinoma; IA: invasive adenocarcinoma; EMT: epithelial-mesenchymal transition

Home

Download

Statistics

Help

Contact

Center for Computational Systems Medicine
leaf

Gene summary

leaf

Malignant transformation analysis

leaf

Malignant transformation related pathway analysis

leaf

Cell-cell communication analysis

leaf

Single-cell gene regulatory network inference analysis

leaf

Somatic mutation of malignant transformation related genes

leaf

Related drugs of malignant transformation related genes

Gene: NUAK1

Gene summary for NUAK1

check button Gene summary.

Gene informationSpeciesHuman
Gene symbol

NUAK1

Gene ID

9891

Gene nameNUAK family kinase 1
Gene AliasARK5
Cytomap12q23.3
Gene Typeprotein-coding
GO ID

GO:0006464

UniProtAcc

A0A024RBL3


Top

Malignant transformation analysis

check button Identification of the aberrant gene expression in precancerous and cancerous lesions by comparing the gene expression of stem-like cells in diseased tissues with normal stem cells
check button Malignant transformation involving gene list.
Entrez IDSymbolReplicatesSpeciesOrganTissueAdj P-valueLog2FCMalignancy
9891NUAK1P2T-EHumanEsophagusESCC3.16e-501.23e+000.1177
9891NUAK1P8T-EHumanEsophagusESCC4.10e-185.29e-010.0889
9891NUAK1P10T-EHumanEsophagusESCC4.33e-274.76e-010.116
9891NUAK1P11T-EHumanEsophagusESCC8.05e-054.66e-010.1426
9891NUAK1P12T-EHumanEsophagusESCC2.79e-092.27e-010.1122
9891NUAK1P15T-EHumanEsophagusESCC7.27e-082.54e-010.1149
9891NUAK1P16T-EHumanEsophagusESCC1.04e-112.72e-010.1153
9891NUAK1P21T-EHumanEsophagusESCC1.74e-205.97e-010.1617
9891NUAK1P22T-EHumanEsophagusESCC6.00e-122.36e-010.1236
9891NUAK1P26T-EHumanEsophagusESCC4.84e-245.03e-010.1276
9891NUAK1P27T-EHumanEsophagusESCC6.91e-072.36e-010.1055
9891NUAK1P31T-EHumanEsophagusESCC6.90e-163.14e-010.1251
9891NUAK1P32T-EHumanEsophagusESCC1.44e-112.86e-010.1666
9891NUAK1P36T-EHumanEsophagusESCC2.95e-104.72e-010.1187
9891NUAK1P37T-EHumanEsophagusESCC1.71e-073.53e-010.1371
9891NUAK1P40T-EHumanEsophagusESCC9.86e-082.74e-010.109
9891NUAK1P42T-EHumanEsophagusESCC5.63e-134.73e-010.1175
9891NUAK1P44T-EHumanEsophagusESCC1.60e-022.40e-010.1096
9891NUAK1P47T-EHumanEsophagusESCC1.20e-021.54e-010.1067
9891NUAK1P48T-EHumanEsophagusESCC1.53e-082.69e-010.0959
Page: 1 2 3 4 

check button Transcriptomic changes along malignancy continuum.
TissueExpression DynamicsAbbreviation
EsophagusThe image shows the transcriptomic changes along malignancy continuum.log2FC in expression of this searched gene in stem-like cells from each diseased tissue sample relative to stem-like cells in normal samples in each tissue plotted against the malignancy continuum. Samples are colored based on if they are from different disease stage.
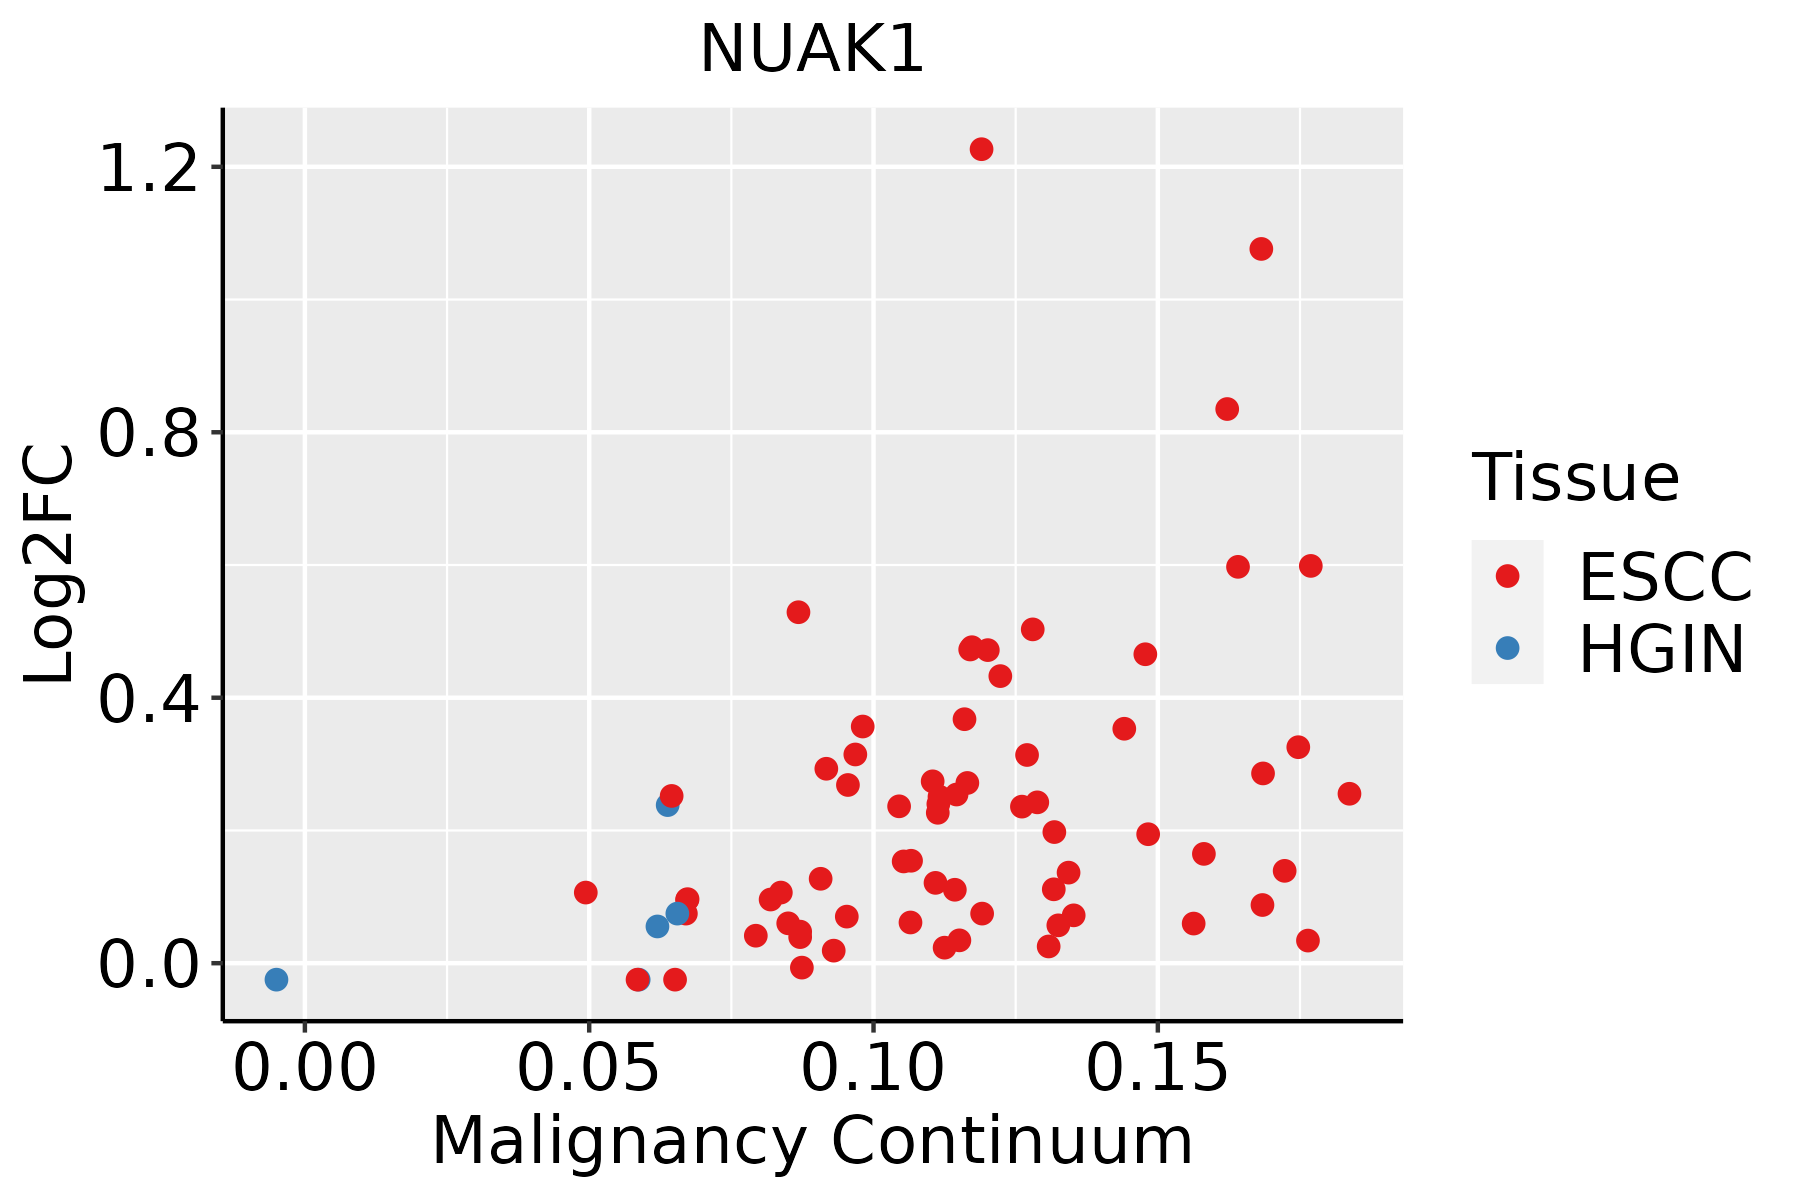
ESCC: Esophageal squamous cell carcinoma
HGIN: High-grade intraepithelial neoplasias
LGIN: Low-grade intraepithelial neoplasias
LiverThe image shows the transcriptomic changes along malignancy continuum.log2FC in expression of this searched gene in stem-like cells from each diseased tissue sample relative to stem-like cells in normal samples in each tissue plotted against the malignancy continuum. Samples are colored based on if they are from different disease stage.HCC: Hepatocellular carcinoma
NAFLD: Non-alcoholic fatty liver disease
Oral CavityThe image shows the transcriptomic changes along malignancy continuum.log2FC in expression of this searched gene in stem-like cells from each diseased tissue sample relative to stem-like cells in normal samples in each tissue plotted against the malignancy continuum. Samples are colored based on if they are from different disease stage.
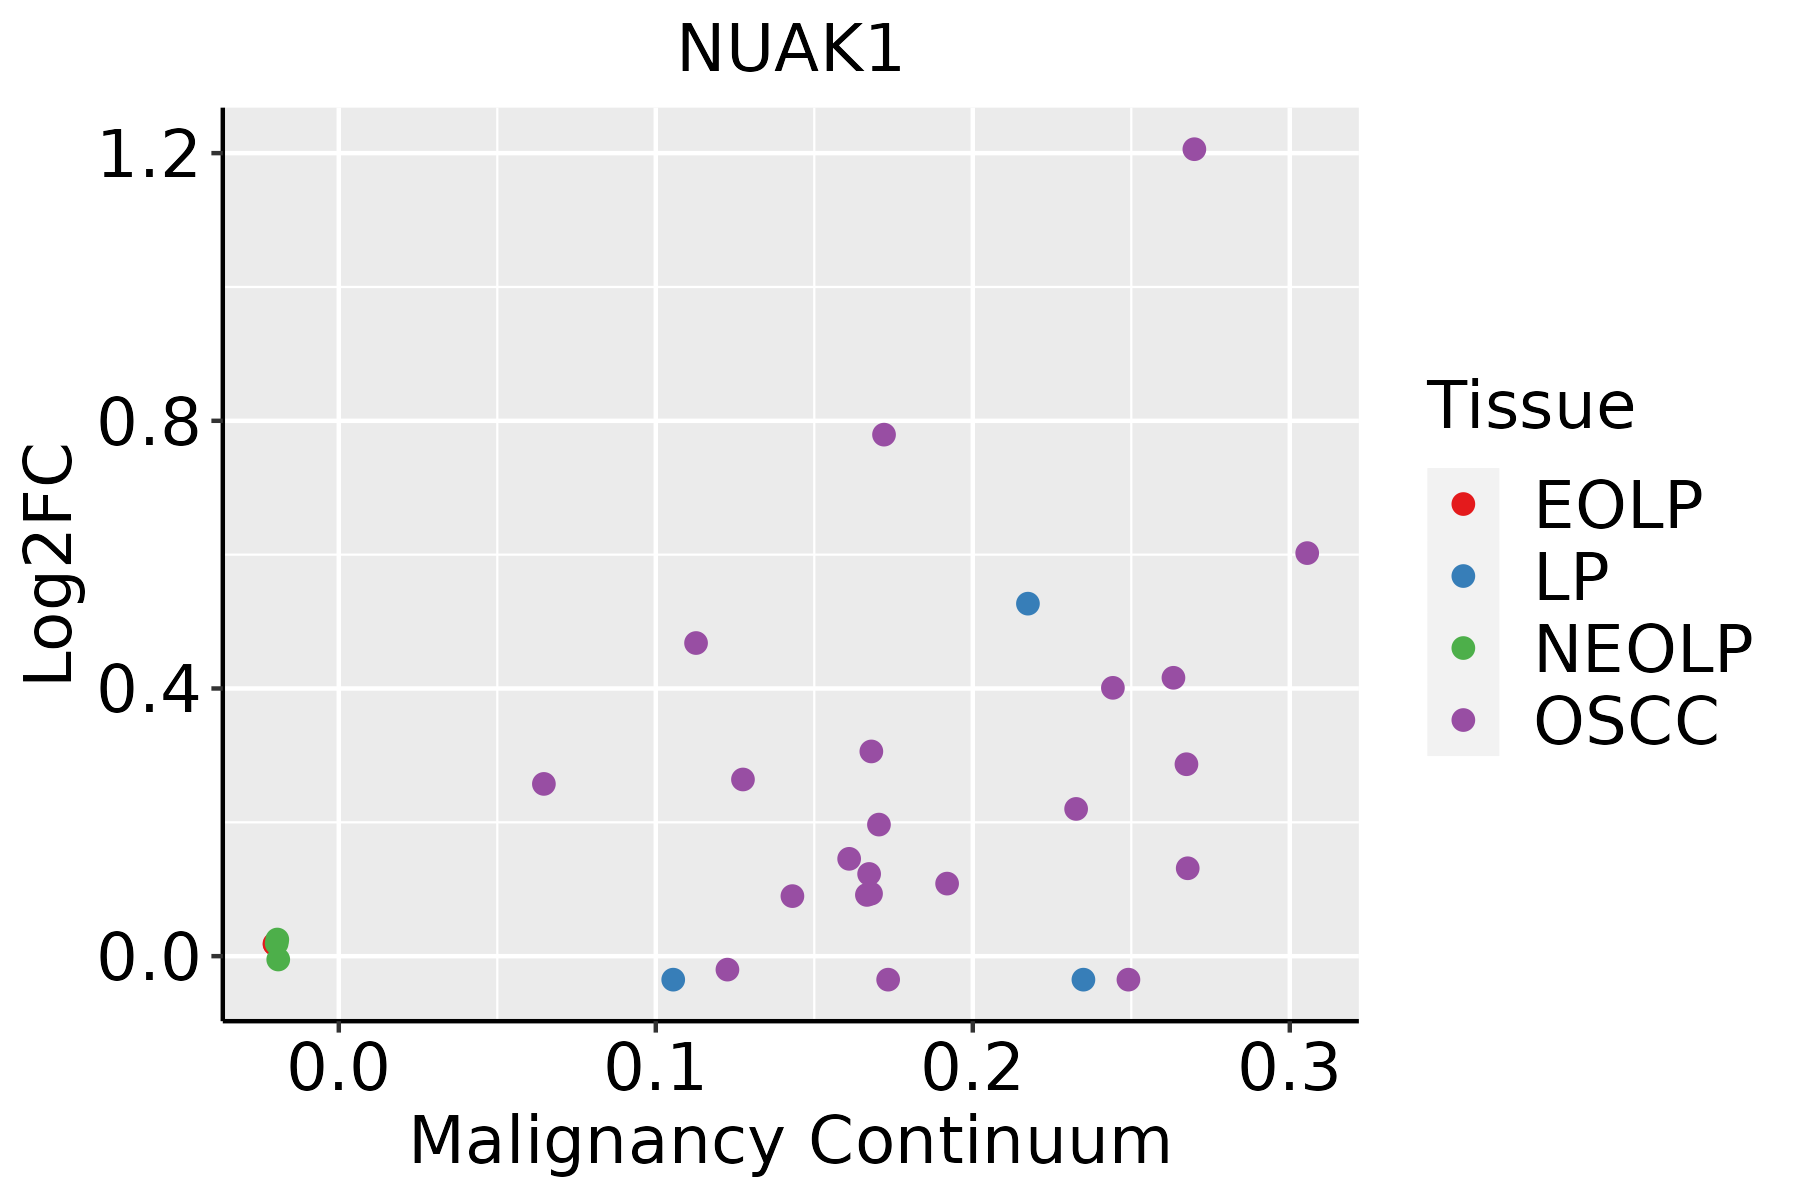
EOLP: Erosive Oral lichen planus
LP: leukoplakia
NEOLP: Non-erosive oral lichen planus
OSCC: Oral squamous cell carcinoma
ProstateThe image shows the transcriptomic changes along malignancy continuum.log2FC in expression of this searched gene in stem-like cells from each diseased tissue sample relative to stem-like cells in normal samples in each tissue plotted against the malignancy continuum. Samples are colored based on if they are from different disease stage.BPH: Benign Prostatic Hyperplasia
ThyroidThe image shows the transcriptomic changes along malignancy continuum.log2FC in expression of this searched gene in stem-like cells from each diseased tissue sample relative to stem-like cells in normal samples in each tissue plotted against the malignancy continuum. Samples are colored based on if they are from different disease stage.ATC: Anaplastic thyroid cancer
HT: Hashimoto's thyroiditis
PTC: Papillary thyroid cancer
∗log2FC in expression of this searched gene in stem-like cells from each diseased tissue sample relative to stem-like cells in normal samples in each tissue plotted against the malignancy continuum. Samples are colored based on if they are from different disease stage.

Top

Malignant transformation related pathway analysis

check buttonFind out the enriched GO biological processes and KEGG pathways involved in transition from healthy to precancer to cancer
check button Figure of enriched GO biological processes.
TissueDisease StageEnriched GO biological Processes
ColorectumADGO analysis - Figure of enriched GO biological processes: Top 15 enriched GO BP terms are showed in the bar plot of each disease state in each tissue. Each row represents a significant GO biological process which is colored according to the -log10(p.adjust).
ColorectumSERGO analysis - Figure of enriched GO biological processes: Top 15 enriched GO BP terms are showed in the bar plot of each disease state in each tissue. Each row represents a significant GO biological process which is colored according to the -log10(p.adjust).
ColorectumMSSGO analysis - Figure of enriched GO biological processes: Top 15 enriched GO BP terms are showed in the bar plot of each disease state in each tissue. Each row represents a significant GO biological process which is colored according to the -log10(p.adjust).
ColorectumMSI-HGO analysis - Figure of enriched GO biological processes: Top 15 enriched GO BP terms are showed in the bar plot of each disease state in each tissue. Each row represents a significant GO biological process which is colored according to the -log10(p.adjust).
ColorectumFAPGO analysis - Figure of enriched GO biological processes: Top 15 enriched GO BP terms are showed in the bar plot of each disease state in each tissue. Each row represents a significant GO biological process which is colored according to the -log10(p.adjust).
∗Top 15 enriched GO BP terms are showed in the bar plot of each disease state in each tissue. Each row represents a significant GO biological process which is colored according to the -log10(p.adjust).
Page: 1 2 3 4 5 6 7 8 9 

check button Enriched GO biological processes.
GO IDTissueDisease StageDescriptionGene RatioBg Ratiopvaluep.adjustCount
GO:0071496111EsophagusESCCcellular response to external stimulus215/8552320/187234.29e-152.43e-13215
GO:0072331111EsophagusESCCsignal transduction by p53 class mediator121/8552163/187239.61e-144.69e-12121
GO:0031668111EsophagusESCCcellular response to extracellular stimulus168/8552246/187234.93e-132.23e-11168
GO:0031669110EsophagusESCCcellular response to nutrient levels148/8552215/187234.58e-121.76e-10148
GO:0031667111EsophagusESCCresponse to nutrient levels289/8552474/187239.25e-123.47e-10289
GO:0009267110EsophagusESCCcellular response to starvation110/8552156/187232.63e-107.37e-09110
GO:004259419EsophagusESCCresponse to starvation133/8552197/187234.31e-101.14e-08133
GO:001631110EsophagusESCCdephosphorylation251/8552417/187231.26e-092.99e-08251
GO:000647018EsophagusESCCprotein dephosphorylation177/8552281/187233.13e-096.72e-08177
GO:1901796111EsophagusESCCregulation of signal transduction by p53 class mediator70/855293/187235.69e-091.18e-0770
GO:0035304111EsophagusESCCregulation of protein dephosphorylation66/855290/187238.82e-081.48e-0666
GO:0035303111EsophagusESCCregulation of dephosphorylation88/8552128/187231.04e-071.71e-0688
GO:000756820EsophagusESCCaging201/8552339/187232.64e-073.94e-06201
GO:00421492EsophagusESCCcellular response to glucose starvation36/855248/187233.43e-052.80e-0436
GO:00075699EsophagusESCCcell aging81/8552132/187232.00e-041.27e-0381
GO:0043666110EsophagusESCCregulation of phosphoprotein phosphatase activity40/855258/187232.83e-041.71e-0340
GO:001092115EsophagusESCCregulation of phosphatase activity52/855284/187231.98e-038.90e-0352
GO:00903984EsophagusESCCcellular senescence54/855293/187231.08e-023.67e-0254
GO:003166722LiverHCCresponse to nutrient levels276/7958474/187232.30e-121.08e-10276
GO:007149622LiverHCCcellular response to external stimulus191/7958320/187233.40e-101.13e-08191
Page: 1 2 3 4 5 6 

check button Enriched KEGG pathways.
Pathway IDTissueDisease StageDescriptionGene RatioBg Ratiopvaluep.adjustqvalueCount
Page: 1 

Top

Cell-cell communication analysis

check buttonIdentification of potential cell-cell interactions between two cell types and their ligand-receptor pairs for different disease states
LigandReceptorLRpairPathwayTissueDisease Stage
Page: 1 

Top

Single-cell gene regulatory network inference analysis

check buttonFind out the significant the regulons (TFs) and the target genes of each regulon across cell types for different disease states
TFCell TypeTissueDisease StageTarget GeneRSSRegulon Activity
NUAK1TUFColorectumADPOMP,BRINP1,EDIL3, etc.6.48e-03The dot plots of a searched regulon are shown for all cell subpopulations in each disease state of each tissue based on the regulon specific score inferred using pySCENIC and by calculating the average expression.
NUAK1EEColorectumADPOMP,BRINP1,EDIL3, etc.3.61e-02The dot plots of a searched regulon are shown for all cell subpopulations in each disease state of each tissue based on the regulon specific score inferred using pySCENIC and by calculating the average expression.
NUAK1CTColorectumADPOMP,BRINP1,EDIL3, etc.3.41e-03The dot plots of a searched regulon are shown for all cell subpopulations in each disease state of each tissue based on the regulon specific score inferred using pySCENIC and by calculating the average expression.
NUAK1SSCColorectumADPOMP,BRINP1,EDIL3, etc.6.66e-03The dot plots of a searched regulon are shown for all cell subpopulations in each disease state of each tissue based on the regulon specific score inferred using pySCENIC and by calculating the average expression.
NUAK1STMColorectumMSI-HPOMP,BRINP1,EDIL3, etc.1.61e-02The dot plots of a searched regulon are shown for all cell subpopulations in each disease state of each tissue based on the regulon specific score inferred using pySCENIC and by calculating the average expression.
NUAK1CTColorectumMSI-HPOMP,BRINP1,EDIL3, etc.2.22e-16The dot plots of a searched regulon are shown for all cell subpopulations in each disease state of each tissue based on the regulon specific score inferred using pySCENIC and by calculating the average expression.
NUAK1TUFColorectumMSSPOMP,BRINP1,EDIL3, etc.2.33e-02The dot plots of a searched regulon are shown for all cell subpopulations in each disease state of each tissue based on the regulon specific score inferred using pySCENIC and by calculating the average expression.
NUAK1CTColorectumMSSPOMP,BRINP1,EDIL3, etc.0.00e+00The dot plots of a searched regulon are shown for all cell subpopulations in each disease state of each tissue based on the regulon specific score inferred using pySCENIC and by calculating the average expression.
NUAK1EEColorectumSERPOMP,BRINP1,EDIL3, etc.5.76e-02The dot plots of a searched regulon are shown for all cell subpopulations in each disease state of each tissue based on the regulon specific score inferred using pySCENIC and by calculating the average expression.
NUAK1SSCColorectumSERPOMP,BRINP1,EDIL3, etc.1.09e-03The dot plots of a searched regulon are shown for all cell subpopulations in each disease state of each tissue based on the regulon specific score inferred using pySCENIC and by calculating the average expression.
∗The dot plots of a searched regulon are shown for all cell subpopulations in each disease state of each tissue based on the regulon specific score inferred using pySCENIC and by calculating the average expression.
Page: 1 2 3 

Top

Somatic mutation of malignant transformation related genes

check buttonAnnotation of somatic variants for genes involved in malignant transformation
Hugo SymbolVariant ClassVariant ClassificationdbSNP RSHGVScHGVSpHGVSp ShortSWISSPROTBIOTYPESIFTPolyPhenTumor Sample BarcodeTissueHistologySexAgeStageTherapy TypesDrugsOutcome
NUAK1SNVMissense_Mutationc.736N>Gp.Leu246Valp.L246VO60285protein_codingdeleterious(0)probably_damaging(0.991)TCGA-AC-A23H-01Breastbreast invasive carcinomaFemale>=65I/IIUnknownUnknownPD
NUAK1SNVMissense_Mutationnovelc.1404N>Tp.Leu468Phep.L468FO60285protein_codingdeleterious(0)probably_damaging(1)TCGA-AN-A046-01Breastbreast invasive carcinomaFemale>=65I/IIUnknownUnknownSD
NUAK1SNVMissense_Mutationc.623N>Gp.Phe208Cysp.F208CO60285protein_codingdeleterious(0.03)benign(0.049)TCGA-AR-A1AY-01Breastbreast invasive carcinomaFemale>=65I/IIUnspecificDoxorubicinSD
NUAK1SNVMissense_Mutationc.949N>Ap.Cys317Serp.C317SO60285protein_codingtolerated(0.46)possibly_damaging(0.521)TCGA-BH-A0C0-01Breastbreast invasive carcinomaFemale<65I/IIChemotherapycarboplatinSD
NUAK1SNVMissense_Mutationc.1515N>Gp.Ser505Argp.S505RO60285protein_codingtolerated(0.28)benign(0.003)TCGA-BH-A1F0-01Breastbreast invasive carcinomaFemale>=65I/IIUnknownUnknownPD
NUAK1SNVMissense_Mutationrs757219955c.1382C>Tp.Thr461Metp.T461MO60285protein_codingtolerated(0.11)benign(0.02)TCGA-D8-A1XW-01Breastbreast invasive carcinomaFemale<65I/IIChemotherapyadriamycin+cyclophosphamideSD
NUAK1SNVMissense_Mutationrs759029750c.1699C>Tp.Arg567Cysp.R567CO60285protein_codingdeleterious(0.01)probably_damaging(0.959)TCGA-D8-A73X-01Breastbreast invasive carcinomaFemale<65I/IIHormone TherapytamoxiphenSD
NUAK1SNVMissense_Mutationc.1327N>Tp.Pro443Serp.P443SO60285protein_codingtolerated(0.74)benign(0)TCGA-E2-A15H-01Breastbreast invasive carcinomaFemale<65I/IIChemotherapyherceptinSD
NUAK1SNVMissense_Mutationrs779923959c.445N>Ap.Arg149Serp.R149SO60285protein_codingtolerated(0.13)possibly_damaging(0.498)TCGA-E9-A295-01Breastbreast invasive carcinomaFemale>=65I/IIHormone TherapytamoxiphenSD
NUAK1SNVMissense_Mutationnovelc.260N>Cp.Arg87Prop.R87PO60285protein_codingdeleterious(0.01)possibly_damaging(0.906)TCGA-OL-A97C-01Breastbreast invasive carcinomaFemale>=65I/IIUnknownUnknownPD
Page: 1 2 3 4 5 6 7 8 9 10 

Top

Related drugs of malignant transformation related genes

check buttonIdentification of chemicals and drugs interact with genes involved in malignant transfromation
(DGIdb 4.0)
Entrez IDSymbolCategoryInteraction TypesDrug Claim NameDrug NamePMIDs
9891NUAK1KINASE, SERINE THREONINE KINASE, DRUGGABLE GENOME, ENZYMEinhibitor310264738CERDULATINIB
9891NUAK1KINASE, SERINE THREONINE KINASE, DRUGGABLE GENOME, ENZYMEinhibitor315661259
9891NUAK1KINASE, SERINE THREONINE KINASE, DRUGGABLE GENOME, ENZYMEinhibitor310264757
9891NUAK1KINASE, SERINE THREONINE KINASE, DRUGGABLE GENOME, ENZYMEinhibitor249565727
9891NUAK1KINASE, SERINE THREONINE KINASE, DRUGGABLE GENOME, ENZYMEinhibitor249565819
Page: 1