
|
|||||
|
 | |
| |
| |
| |
| |
| |
|
Gene: NTS |
Gene summary for NTS |
| Gene information | Species | Human | Gene symbol | NTS | Gene ID | 4922 |
| Gene name | neurotensin | |
| Gene Alias | NMN-125 | |
| Cytomap | 12q21.31 | |
| Gene Type | protein-coding | GO ID | GO:0007154 | UniProtAcc | P30990 |
Top |
Malignant transformation analysis |
| Identification of the aberrant gene expression in precancerous and cancerous lesions by comparing the gene expression of stem-like cells in diseased tissues with normal stem cells |
| Entrez ID | Symbol | Replicates | Species | Organ | Tissue | Adj P-value | Log2FC | Malignancy |
| 4922 | NTS | LZE11D | Human | Esophagus | HGIN | 9.56e-18 | 1.57e+00 | -0.005 |
| 4922 | NTS | LZE2T | Human | Esophagus | ESCC | 2.05e-21 | 3.54e+00 | 0.082 |
| 4922 | NTS | LZE4T | Human | Esophagus | ESCC | 1.39e-37 | 2.43e+00 | 0.0811 |
| 4922 | NTS | LZE21T | Human | Esophagus | ESCC | 2.35e-14 | 2.43e+00 | 0.0655 |
| 4922 | NTS | LZE6T | Human | Esophagus | ESCC | 1.87e-12 | 8.37e-01 | 0.0845 |
| 4922 | NTS | P1T-E | Human | Esophagus | ESCC | 4.53e-14 | 1.36e+00 | 0.0875 |
| 4922 | NTS | P4T-E | Human | Esophagus | ESCC | 5.27e-63 | 4.84e+00 | 0.1323 |
| 4922 | NTS | P8T-E | Human | Esophagus | ESCC | 2.87e-02 | 5.80e-01 | 0.0889 |
| 4922 | NTS | P9T-E | Human | Esophagus | ESCC | 3.22e-13 | 7.68e-01 | 0.1131 |
| 4922 | NTS | P10T-E | Human | Esophagus | ESCC | 7.79e-34 | 1.28e+00 | 0.116 |
| 4922 | NTS | P12T-E | Human | Esophagus | ESCC | 3.20e-82 | 3.48e+00 | 0.1122 |
| 4922 | NTS | P20T-E | Human | Esophagus | ESCC | 2.86e-10 | 9.31e-01 | 0.1124 |
| 4922 | NTS | P23T-E | Human | Esophagus | ESCC | 7.68e-77 | 4.68e+00 | 0.108 |
| 4922 | NTS | P26T-E | Human | Esophagus | ESCC | 1.29e-139 | 4.76e+00 | 0.1276 |
| 4922 | NTS | P27T-E | Human | Esophagus | ESCC | 7.14e-99 | 4.60e+00 | 0.1055 |
| 4922 | NTS | P28T-E | Human | Esophagus | ESCC | 2.33e-39 | 2.29e+00 | 0.1149 |
| 4922 | NTS | P30T-E | Human | Esophagus | ESCC | 2.31e-10 | 1.93e+00 | 0.137 |
| 4922 | NTS | P36T-E | Human | Esophagus | ESCC | 2.98e-06 | 8.40e-01 | 0.1187 |
| 4922 | NTS | P39T-E | Human | Esophagus | ESCC | 1.04e-13 | 1.39e+00 | 0.0894 |
| 4922 | NTS | P40T-E | Human | Esophagus | ESCC | 3.18e-05 | 1.48e+00 | 0.109 |
| Page: 1 2 |
| Tissue | Expression Dynamics | Abbreviation |
| Esophagus |  | ESCC: Esophageal squamous cell carcinoma |
| HGIN: High-grade intraepithelial neoplasias | ||
| LGIN: Low-grade intraepithelial neoplasias | ||
| Oral Cavity | 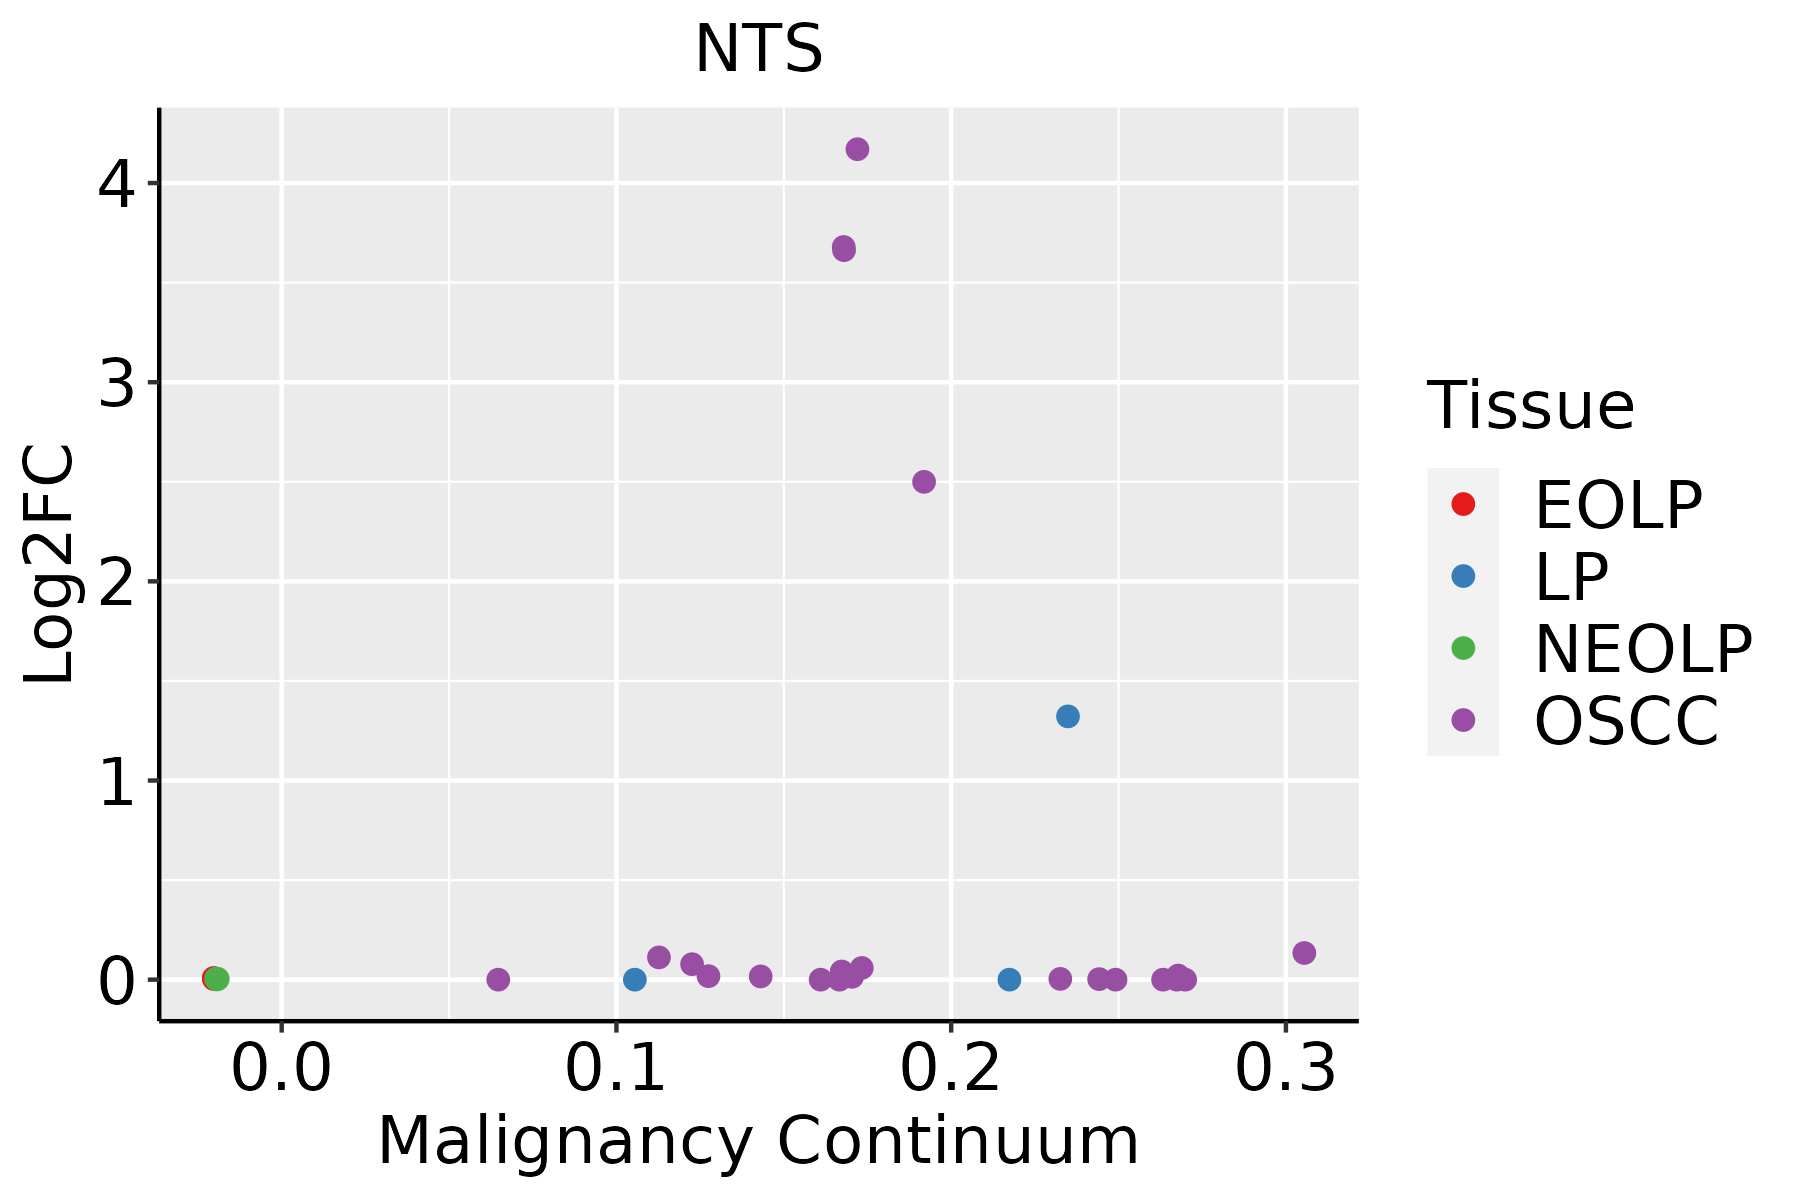 | EOLP: Erosive Oral lichen planus |
| LP: leukoplakia | ||
| NEOLP: Non-erosive oral lichen planus | ||
| OSCC: Oral squamous cell carcinoma |
| ∗log2FC in expression of this searched gene in stem-like cells from each diseased tissue sample relative to stem-like cells in normal samples in each tissue plotted against the malignancy continuum. Samples are colored based on if they are from different disease stage. |
Top |
Malignant transformation related pathway analysis |
| Find out the enriched GO biological processes and KEGG pathways involved in transition from healthy to precancer to cancer |
| Tissue | Disease Stage | Enriched GO biological Processes |
| Colorectum | AD |  |
| Colorectum | SER |  |
| Colorectum | MSS |  |
| Colorectum | MSI-H |  |
| Colorectum | FAP |  |
| ∗Top 15 enriched GO BP terms are showed in the bar plot of each disease state in each tissue. Each row represents a significant GO biological process which is colored according to the -log10(p.adjust). |
| Page: 1 2 3 4 5 6 7 8 9 |
| GO ID | Tissue | Disease Stage | Description | Gene Ratio | Bg Ratio | pvalue | p.adjust | Count |
| GO:00712148 | Cervix | CC | cellular response to abiotic stimulus | 69/2311 | 331/18723 | 7.36e-06 | 1.73e-04 | 69 |
| GO:01040048 | Cervix | CC | cellular response to environmental stimulus | 69/2311 | 331/18723 | 7.36e-06 | 1.73e-04 | 69 |
| GO:00714798 | Cervix | CC | cellular response to ionizing radiation | 22/2311 | 72/18723 | 3.47e-05 | 5.60e-04 | 22 |
| GO:00093149 | Cervix | CC | response to radiation | 86/2311 | 456/18723 | 3.50e-05 | 5.63e-04 | 86 |
| GO:19019873 | Cervix | CC | regulation of cell cycle phase transition | 74/2311 | 390/18723 | 9.80e-05 | 1.27e-03 | 74 |
| GO:00714786 | Cervix | CC | cellular response to radiation | 41/2311 | 186/18723 | 1.41e-04 | 1.71e-03 | 41 |
| GO:00102126 | Cervix | CC | response to ionizing radiation | 34/2311 | 148/18723 | 2.23e-04 | 2.53e-03 | 34 |
| GO:00457862 | Cervix | CC | negative regulation of cell cycle | 67/2311 | 385/18723 | 2.21e-03 | 1.59e-02 | 67 |
| GO:00427705 | Cervix | CC | signal transduction in response to DNA damage | 34/2311 | 172/18723 | 3.52e-03 | 2.27e-02 | 34 |
| GO:00109482 | Cervix | CC | negative regulation of cell cycle process | 51/2311 | 294/18723 | 7.35e-03 | 3.94e-02 | 51 |
| GO:00344707 | Endometrium | AEH | ncRNA processing | 62/2100 | 395/18723 | 3.93e-03 | 2.65e-02 | 62 |
| GO:003447012 | Endometrium | EEC | ncRNA processing | 63/2168 | 395/18723 | 5.20e-03 | 3.26e-02 | 63 |
| GO:003447010 | Esophagus | HGIN | ncRNA processing | 97/2587 | 395/18723 | 5.92e-09 | 3.90e-07 | 97 |
| GO:00346606 | Esophagus | HGIN | ncRNA metabolic process | 104/2587 | 485/18723 | 2.26e-06 | 8.23e-05 | 104 |
| GO:003447015 | Esophagus | ESCC | ncRNA processing | 300/8552 | 395/18723 | 3.09e-35 | 3.26e-32 | 300 |
| GO:003466012 | Esophagus | ESCC | ncRNA metabolic process | 346/8552 | 485/18723 | 4.35e-31 | 2.51e-28 | 346 |
| GO:004477216 | Esophagus | ESCC | mitotic cell cycle phase transition | 281/8552 | 424/18723 | 4.63e-18 | 4.45e-16 | 281 |
| GO:000734615 | Esophagus | ESCC | regulation of mitotic cell cycle | 293/8552 | 457/18723 | 8.00e-16 | 5.64e-14 | 293 |
| GO:001021217 | Esophagus | ESCC | response to ionizing radiation | 110/8552 | 148/18723 | 1.11e-12 | 4.78e-11 | 110 |
| GO:00905013 | Esophagus | ESCC | RNA phosphodiester bond hydrolysis | 110/8552 | 152/18723 | 1.95e-11 | 6.81e-10 | 110 |
| Page: 1 2 3 4 5 6 7 8 |
| Pathway ID | Tissue | Disease Stage | Description | Gene Ratio | Bg Ratio | pvalue | p.adjust | qvalue | Count |
| Page: 1 |
Top |
Cell-cell communication analysis |
| Identification of potential cell-cell interactions between two cell types and their ligand-receptor pairs for different disease states |
| Ligand | Receptor | LRpair | Pathway | Tissue | Disease Stage |
| Page: 1 |
Top |
Single-cell gene regulatory network inference analysis |
| Find out the significant the regulons (TFs) and the target genes of each regulon across cell types for different disease states |
| TF | Cell Type | Tissue | Disease Stage | Target Gene | RSS | Regulon Activity |
| ∗The dot plots of a searched regulon are shown for all cell subpopulations in each disease state of each tissue based on the regulon specific score inferred using pySCENIC and by calculating the average expression. |
| Page: 1 |
Top |
Somatic mutation of malignant transformation related genes |
| Annotation of somatic variants for genes involved in malignant transformation |
| Hugo Symbol | Variant Class | Variant Classification | dbSNP RS | HGVSc | HGVSp | HGVSp Short | SWISSPROT | BIOTYPE | SIFT | PolyPhen | Tumor Sample Barcode | Tissue | Histology | Sex | Age | Stage | Therapy Types | Drugs | Outcome |
| NTS | SNV | Missense_Mutation | c.494N>T | p.Arg165Ile | p.R165I | P30990 | protein_coding | deleterious(0) | probably_damaging(0.999) | TCGA-A6-6141-01 | Colorectum | colon adenocarcinoma | Male | <65 | I/II | Chemotherapy | 5-fu | SD | |
| NTS | SNV | Missense_Mutation | c.462N>T | p.Glu154Asp | p.E154D | P30990 | protein_coding | tolerated(0.61) | benign(0.003) | TCGA-AA-3977-01 | Colorectum | colon adenocarcinoma | Male | >=65 | I/II | Unknown | Unknown | SD | |
| NTS | SNV | Missense_Mutation | novel | c.496N>T | p.Asp166Tyr | p.D166Y | P30990 | protein_coding | deleterious(0.02) | benign(0.357) | TCGA-AG-A002-01 | Colorectum | rectum adenocarcinoma | Male | <65 | I/II | Unknown | Unknown | SD |
| NTS | SNV | Missense_Mutation | c.494N>T | p.Arg165Ile | p.R165I | P30990 | protein_coding | deleterious(0) | probably_damaging(0.999) | TCGA-F5-6814-01 | Colorectum | rectum adenocarcinoma | Male | <65 | I/II | Unknown | Unknown | SD | |
| NTS | SNV | Missense_Mutation | novel | c.505T>C | p.Tyr169His | p.Y169H | P30990 | protein_coding | deleterious(0) | probably_damaging(0.999) | TCGA-A5-A0G2-01 | Endometrium | uterine corpus endometrioid carcinoma | Female | <65 | III/IV | Unknown | Unknown | SD |
| NTS | SNV | Missense_Mutation | novel | c.135N>T | p.Lys45Asn | p.K45N | P30990 | protein_coding | deleterious(0) | probably_damaging(0.947) | TCGA-AJ-A3EL-01 | Endometrium | uterine corpus endometrioid carcinoma | Female | <65 | I/II | Unknown | Unknown | SD |
| NTS | SNV | Missense_Mutation | c.280G>T | p.Asp94Tyr | p.D94Y | P30990 | protein_coding | deleterious(0) | probably_damaging(0.977) | TCGA-AP-A056-01 | Endometrium | uterine corpus endometrioid carcinoma | Female | <65 | I/II | Unknown | Unknown | SD | |
| NTS | SNV | Missense_Mutation | c.188N>T | p.Ser63Ile | p.S63I | P30990 | protein_coding | tolerated(0.14) | possibly_damaging(0.837) | TCGA-AP-A059-01 | Endometrium | uterine corpus endometrioid carcinoma | Female | >=65 | I/II | Unknown | Unknown | SD | |
| NTS | SNV | Missense_Mutation | c.494N>T | p.Arg165Ile | p.R165I | P30990 | protein_coding | deleterious(0) | probably_damaging(0.999) | TCGA-AX-A0J0-01 | Endometrium | uterine corpus endometrioid carcinoma | Female | <65 | I/II | Unknown | Unknown | SD | |
| NTS | SNV | Missense_Mutation | c.425G>T | p.Arg142Ile | p.R142I | P30990 | protein_coding | deleterious(0) | probably_damaging(0.999) | TCGA-B5-A0JY-01 | Endometrium | uterine corpus endometrioid carcinoma | Female | <65 | III/IV | Chemotherapy | doxorubicin | SD |
| Page: 1 2 3 |
Top |
Related drugs of malignant transformation related genes |
| Identification of chemicals and drugs interact with genes involved in malignant transfromation |
| (DGIdb 4.0) |
| Entrez ID | Symbol | Category | Interaction Types | Drug Claim Name | Drug Name | PMIDs |
| 4922 | NTS | DRUGGABLE GENOME | NORETHISTERONE | NORETHINDRONE | 11495683 | |
| 4922 | NTS | DRUGGABLE GENOME | MAGNESIUM SULFATE | 1758237 | ||
| 4922 | NTS | DRUGGABLE GENOME | LITHIUM | LITHIUM | 7992199 | |
| 4922 | NTS | DRUGGABLE GENOME | NIFEDIPINE | NIFEDIPINE | 8770786 | |
| 4922 | NTS | DRUGGABLE GENOME | haloperidol | HALOPERIDOL | 27023437 | |
| 4922 | NTS | DRUGGABLE GENOME | RISPERIDONE | RISPERIDONE | 10991962 | |
| 4922 | NTS | DRUGGABLE GENOME | CHLORPROMAZINE | CHLORPROMAZINE | 1980851 | |
| 4922 | NTS | DRUGGABLE GENOME | ETHANOL | ALCOHOL | 9023306,1733422,1686369 | |
| 4922 | NTS | DRUGGABLE GENOME | AZASERINE | AZASERINE | 1993548 |
| Page: 1 |

Copyright 2023-Present -The University of Texas Health Science Center at Houston |