| Tissue | Expression Dynamics | Abbreviation |
| Breast | 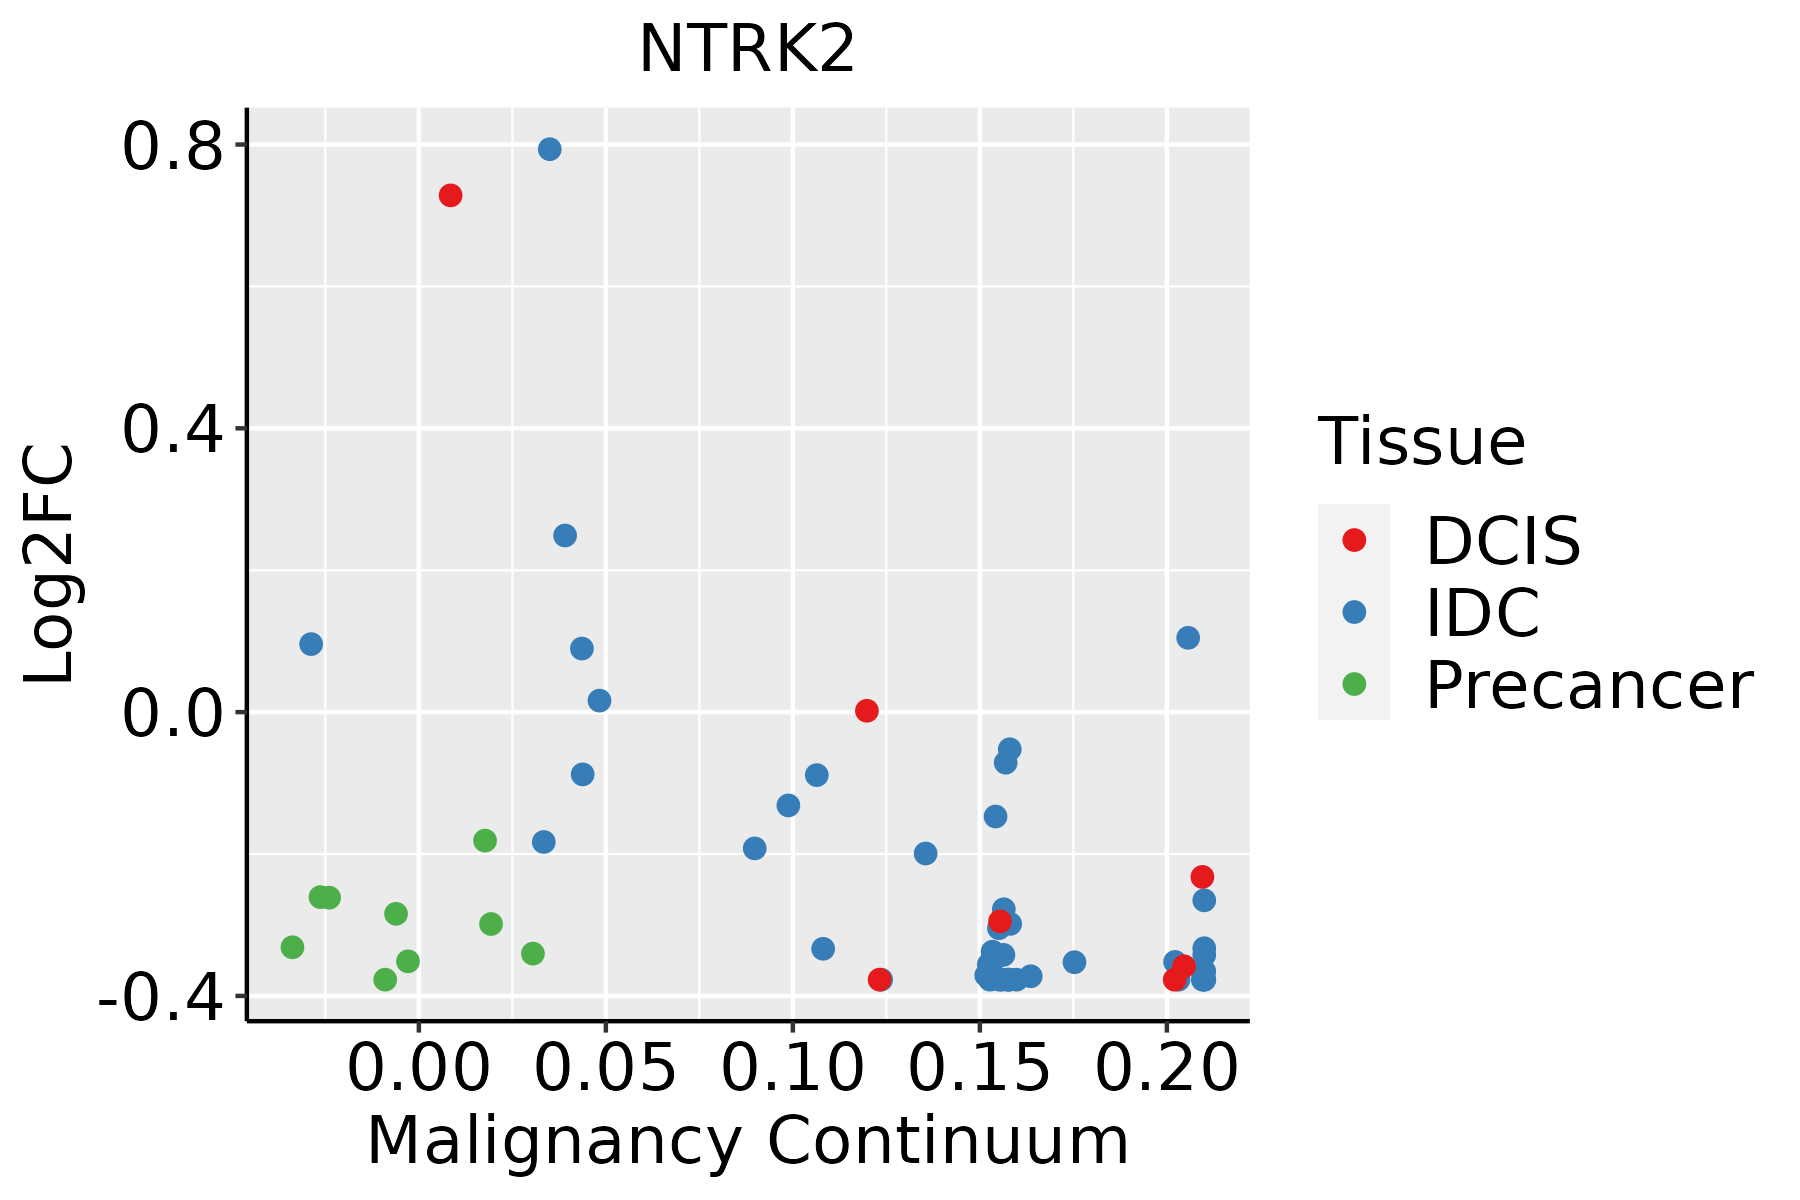 | IDC: Invasive ductal carcinoma |
| DCIS: Ductal carcinoma in situ |
| Precancer(BRCA1-mut): Precancerous lesion from BRCA1 mutation carriers |
| Cervix | 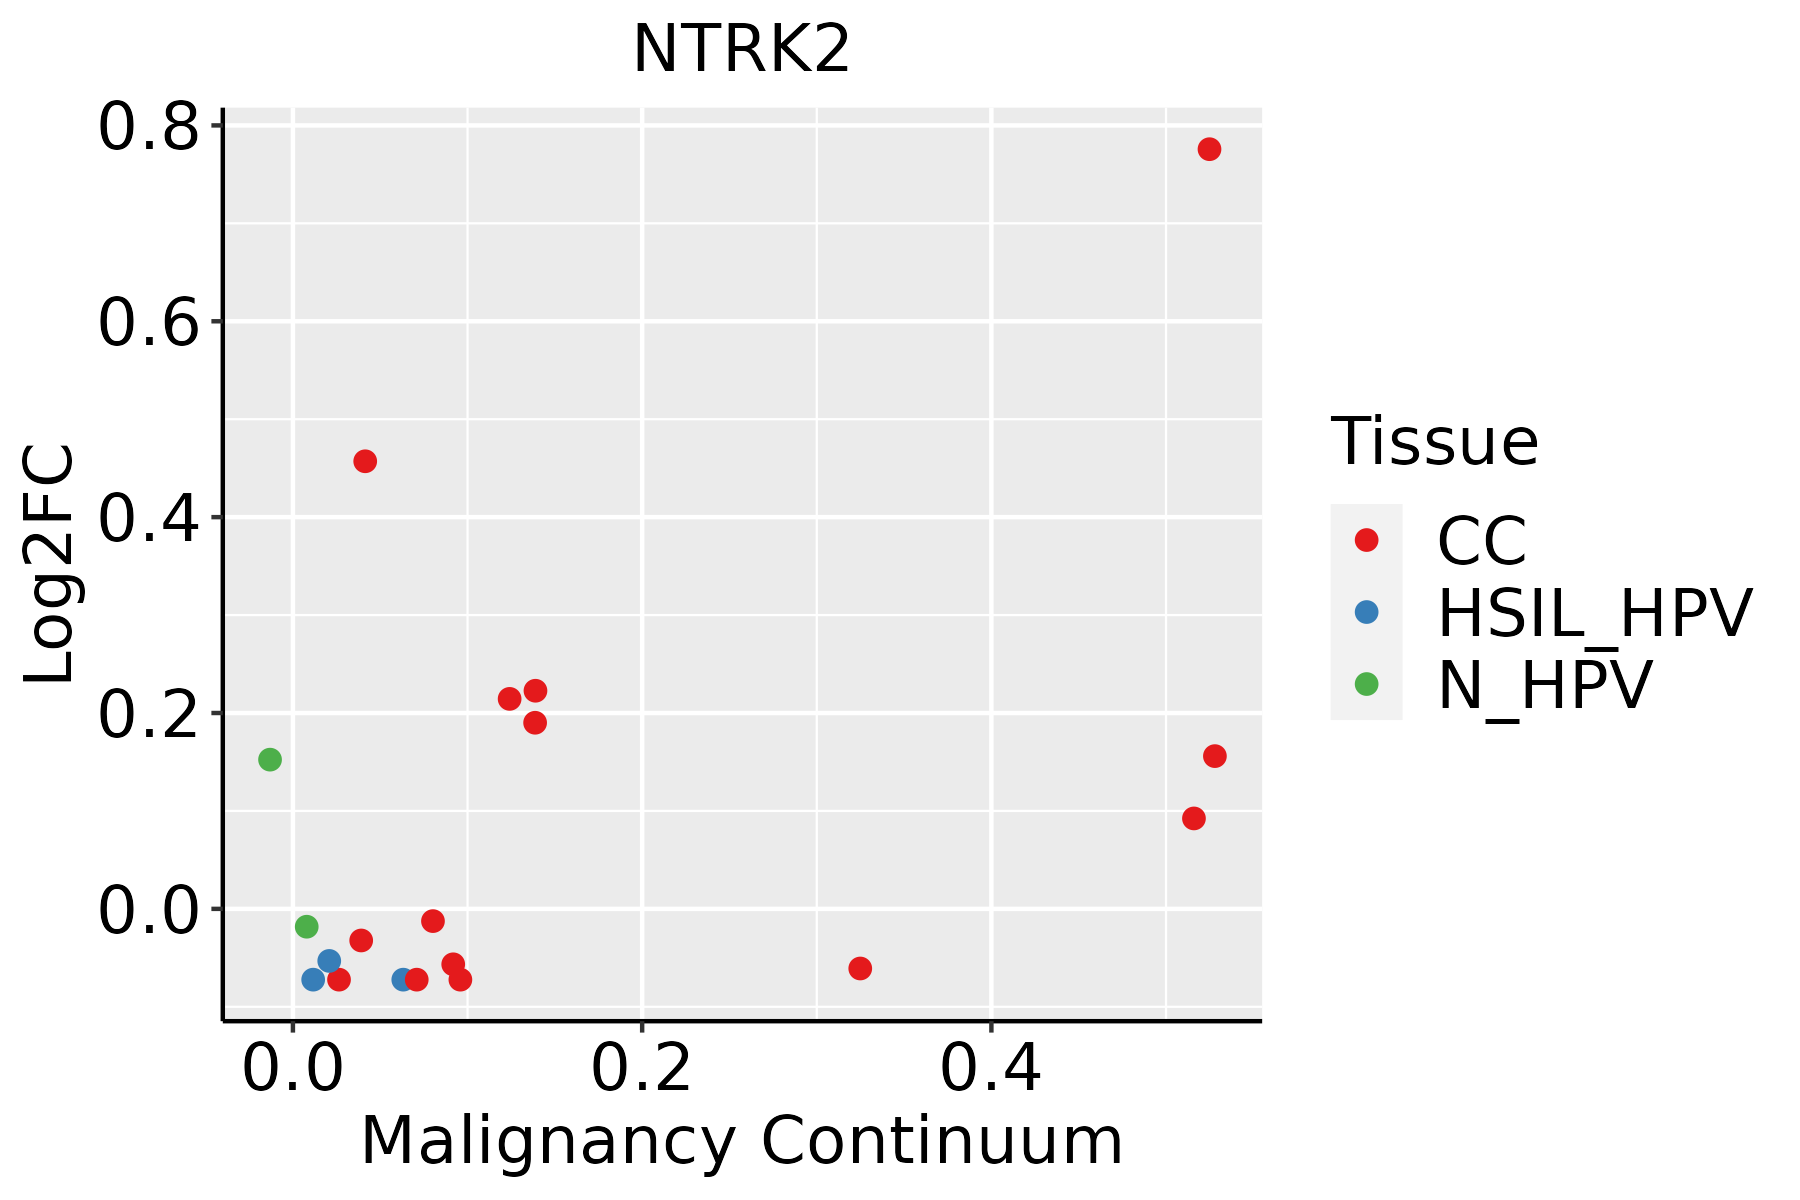 | CC: Cervix cancer |
| HSIL_HPV: HPV-infected high-grade squamous intraepithelial lesions |
| N_HPV: HPV-infected normal cervix |
| Colorectum (GSE201348) | 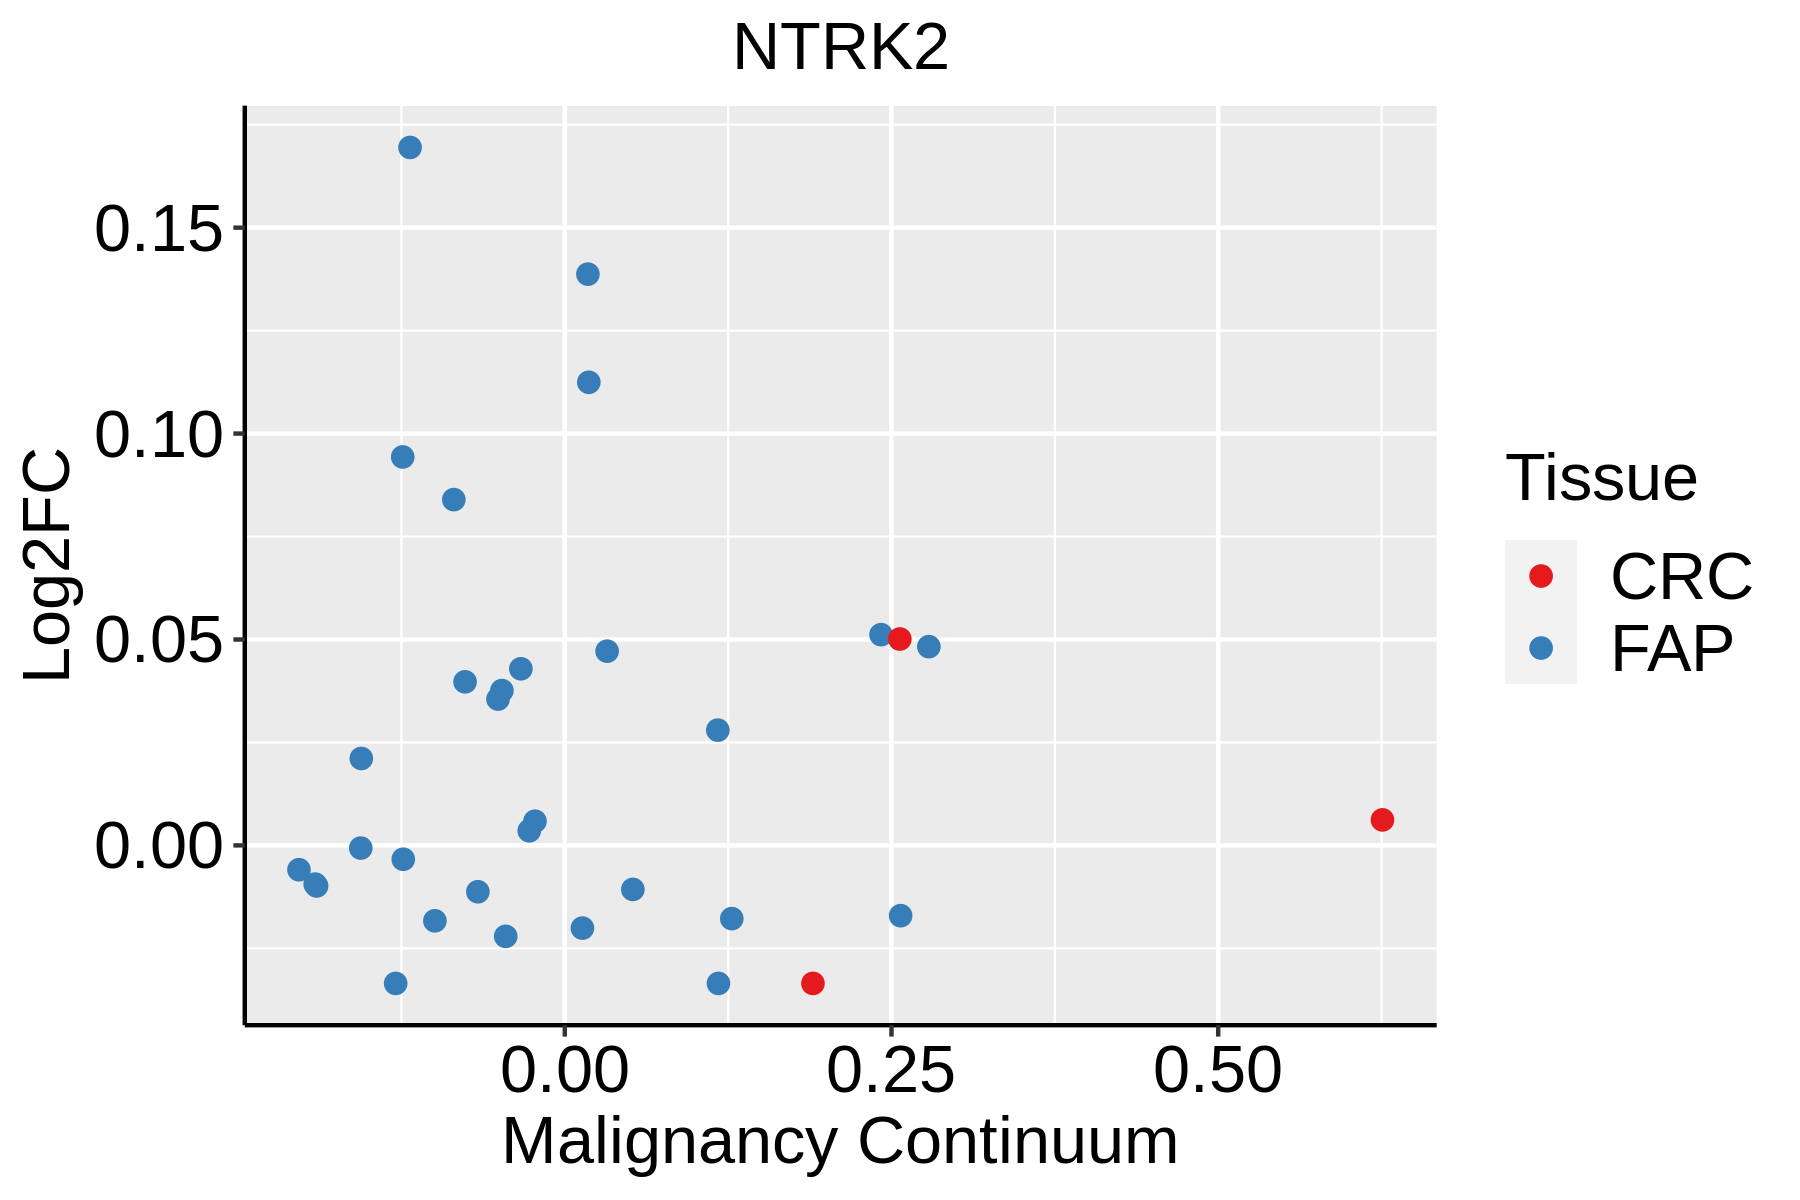 | FAP: Familial adenomatous polyposis |
| CRC: Colorectal cancer |
| Colorectum (HTA11) |  | AD: Adenomas |
| SER: Sessile serrated lesions |
| MSI-H: Microsatellite-high colorectal cancer |
| MSS: Microsatellite stable colorectal cancer |
| Esophagus |  | ESCC: Esophageal squamous cell carcinoma |
| HGIN: High-grade intraepithelial neoplasias |
| LGIN: Low-grade intraepithelial neoplasias |
| Oral Cavity | 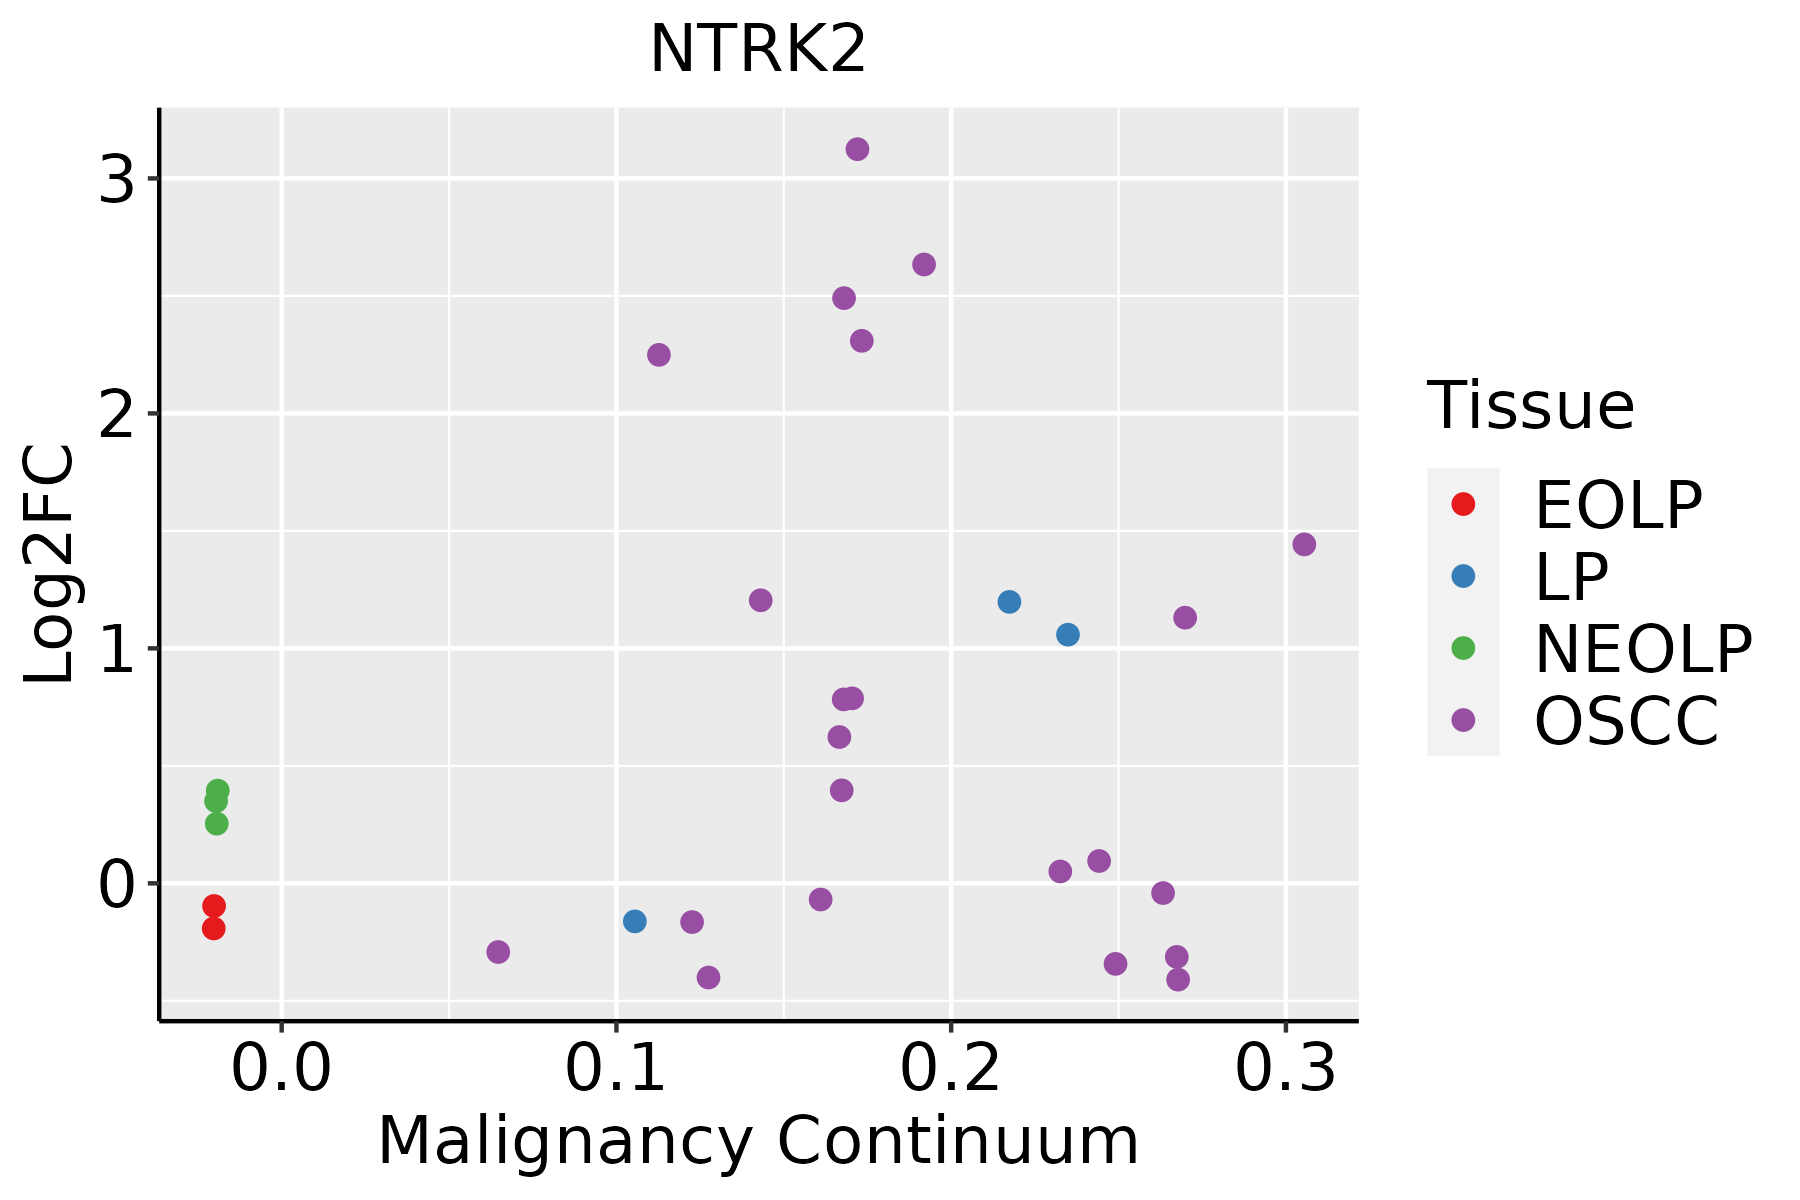 | EOLP: Erosive Oral lichen planus |
| LP: leukoplakia |
| NEOLP: Non-erosive oral lichen planus |
| OSCC: Oral squamous cell carcinoma |
| Skin | 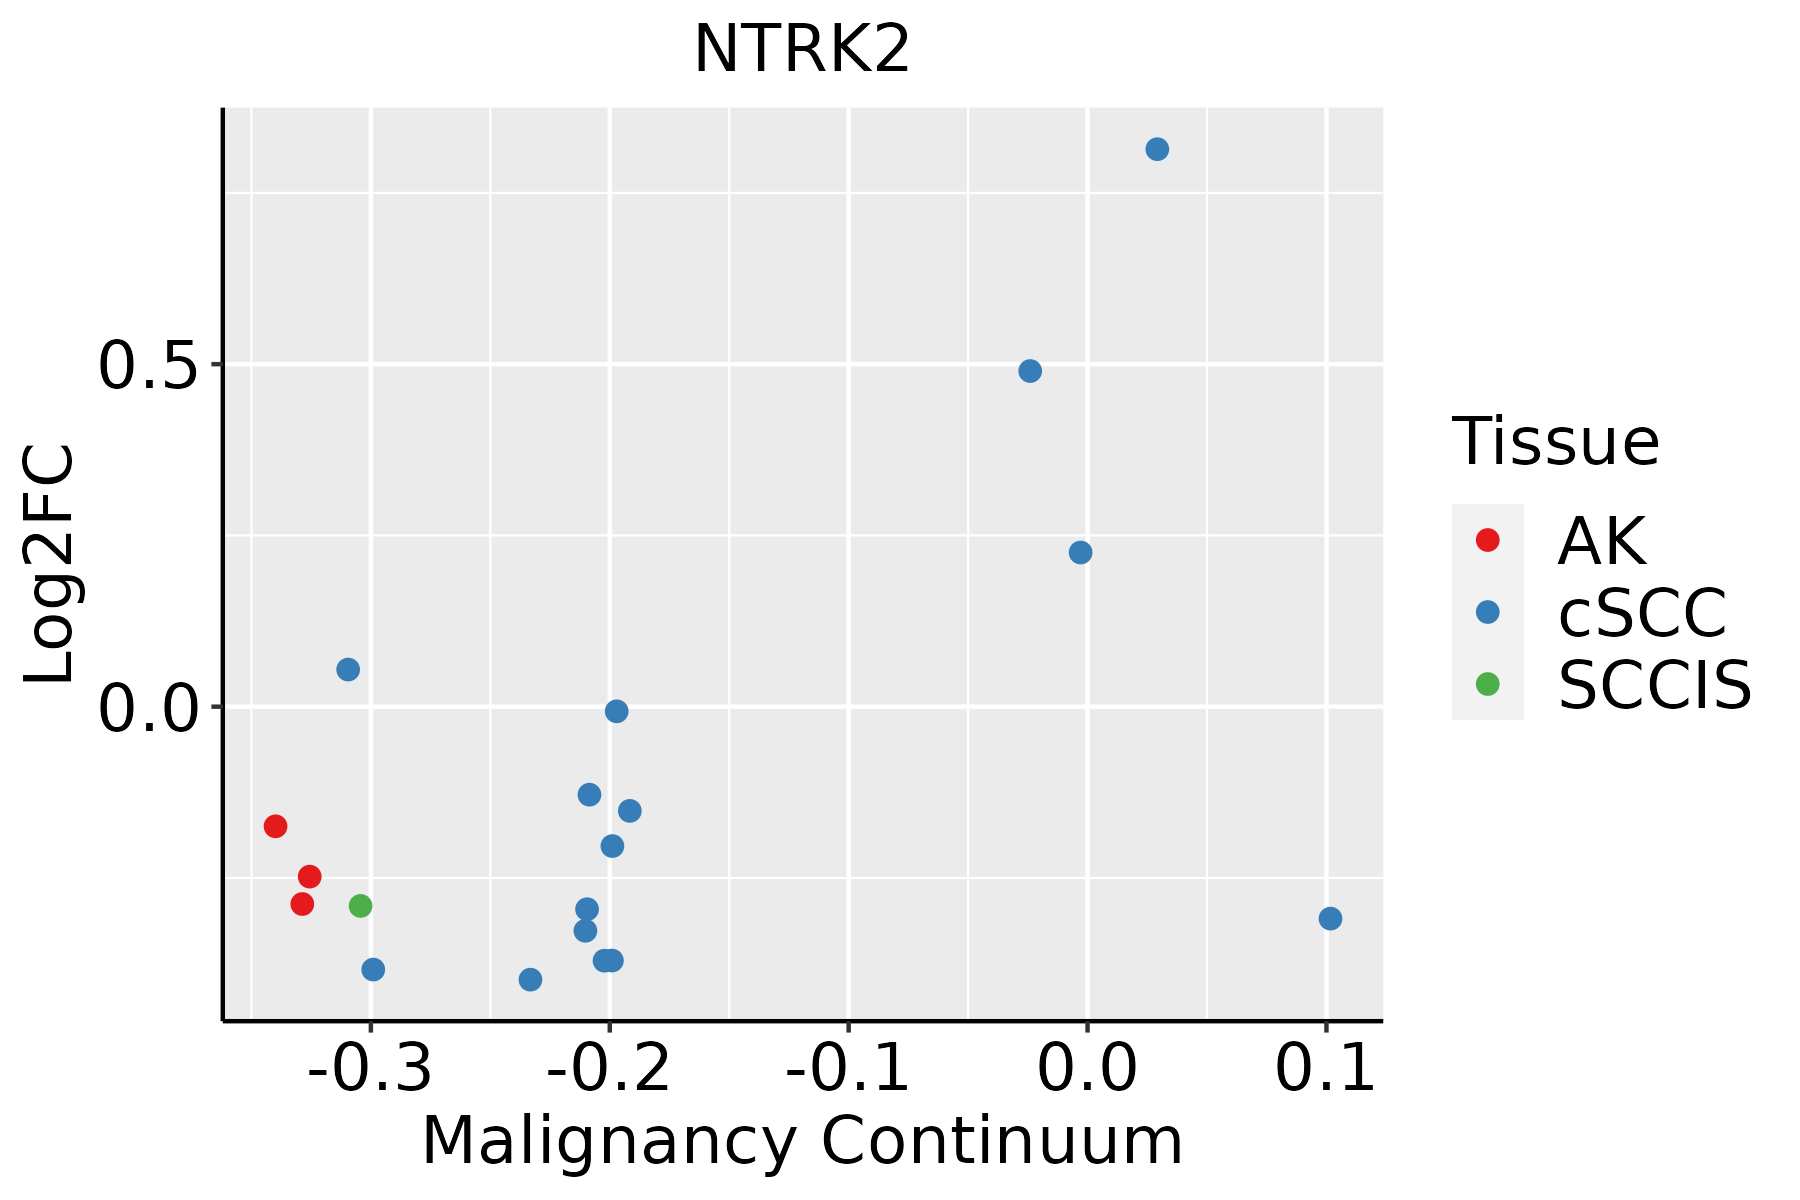 | AK: Actinic keratosis |
| cSCC: Cutaneous squamous cell carcinoma |
| SCCIS:squamous cell carcinoma in situ |
| Thyroid |  | ATC: Anaplastic thyroid cancer |
| HT: Hashimoto's thyroiditis |
| PTC: Papillary thyroid cancer |
| GO ID | Tissue | Disease Stage | Description | Gene Ratio | Bg Ratio | pvalue | p.adjust | Count |
| GO:00709979 | Breast | Precancer | neuron death | 50/1080 | 361/18723 | 7.75e-09 | 5.70e-07 | 50 |
| GO:00514029 | Breast | Precancer | neuron apoptotic process | 38/1080 | 246/18723 | 2.68e-08 | 1.75e-06 | 38 |
| GO:19012149 | Breast | Precancer | regulation of neuron death | 41/1080 | 319/18723 | 1.27e-06 | 4.80e-05 | 41 |
| GO:00435237 | Breast | Precancer | regulation of neuron apoptotic process | 31/1080 | 212/18723 | 1.69e-06 | 6.08e-05 | 31 |
| GO:00420633 | Breast | Precancer | gliogenesis | 33/1080 | 301/18723 | 3.06e-04 | 4.40e-03 | 33 |
| GO:00435243 | Breast | Precancer | negative regulation of neuron apoptotic process | 19/1080 | 145/18723 | 6.83e-04 | 8.34e-03 | 19 |
| GO:19012157 | Breast | Precancer | negative regulation of neuron death | 24/1080 | 208/18723 | 9.50e-04 | 1.07e-02 | 24 |
| GO:00100013 | Breast | Precancer | glial cell differentiation | 25/1080 | 225/18723 | 1.29e-03 | 1.37e-02 | 25 |
| GO:00434912 | Breast | Precancer | protein kinase B signaling | 23/1080 | 211/18723 | 2.53e-03 | 2.30e-02 | 23 |
| GO:00336749 | Breast | Precancer | positive regulation of kinase activity | 42/1080 | 467/18723 | 2.94e-03 | 2.54e-02 | 42 |
| GO:19900908 | Breast | Precancer | cellular response to nerve growth factor stimulus | 9/1080 | 53/18723 | 3.05e-03 | 2.62e-02 | 9 |
| GO:19900896 | Breast | Precancer | response to nerve growth factor | 9/1080 | 56/18723 | 4.47e-03 | 3.47e-02 | 9 |
| GO:00011015 | Breast | Precancer | response to acid chemical | 16/1080 | 135/18723 | 4.85e-03 | 3.67e-02 | 16 |
| GO:0021782 | Breast | Precancer | glial cell development | 14/1080 | 116/18723 | 6.92e-03 | 4.67e-02 | 14 |
| GO:007099714 | Breast | IDC | neuron death | 57/1434 | 361/18723 | 1.31e-07 | 7.38e-06 | 57 |
| GO:005140213 | Breast | IDC | neuron apoptotic process | 42/1434 | 246/18723 | 7.21e-07 | 3.35e-05 | 42 |
| GO:190121414 | Breast | IDC | regulation of neuron death | 48/1434 | 319/18723 | 5.01e-06 | 1.69e-04 | 48 |
| GO:004352313 | Breast | IDC | regulation of neuron apoptotic process | 35/1434 | 212/18723 | 1.26e-05 | 3.29e-04 | 35 |
| GO:004352411 | Breast | IDC | negative regulation of neuron apoptotic process | 23/1434 | 145/18723 | 6.58e-04 | 8.11e-03 | 23 |
| GO:004206311 | Breast | IDC | gliogenesis | 39/1434 | 301/18723 | 8.63e-04 | 1.00e-02 | 39 |
| Pathway ID | Tissue | Disease Stage | Description | Gene Ratio | Bg Ratio | pvalue | p.adjust | qvalue | Count |
| hsa0472214 | Cervix | CC | Neurotrophin signaling pathway | 32/1267 | 119/8465 | 5.01e-04 | 2.42e-03 | 1.43e-03 | 32 |
| hsa040142 | Cervix | CC | Ras signaling pathway | 51/1267 | 236/8465 | 3.55e-03 | 1.34e-02 | 7.91e-03 | 51 |
| hsa040109 | Cervix | CC | MAPK signaling pathway | 62/1267 | 302/8465 | 4.89e-03 | 1.67e-02 | 9.86e-03 | 62 |
| hsa0472215 | Cervix | CC | Neurotrophin signaling pathway | 32/1267 | 119/8465 | 5.01e-04 | 2.42e-03 | 1.43e-03 | 32 |
| hsa0401411 | Cervix | CC | Ras signaling pathway | 51/1267 | 236/8465 | 3.55e-03 | 1.34e-02 | 7.91e-03 | 51 |
| hsa0401012 | Cervix | CC | MAPK signaling pathway | 62/1267 | 302/8465 | 4.89e-03 | 1.67e-02 | 9.86e-03 | 62 |
| hsa04722 | Colorectum | AD | Neurotrophin signaling pathway | 50/2092 | 119/8465 | 2.28e-05 | 2.24e-04 | 1.43e-04 | 50 |
| hsa047221 | Colorectum | AD | Neurotrophin signaling pathway | 50/2092 | 119/8465 | 2.28e-05 | 2.24e-04 | 1.43e-04 | 50 |
| hsa0472225 | Esophagus | ESCC | Neurotrophin signaling pathway | 80/4205 | 119/8465 | 7.33e-05 | 3.07e-04 | 1.57e-04 | 80 |
| hsa041517 | Esophagus | ESCC | PI3K-Akt signaling pathway | 197/4205 | 354/8465 | 1.24e-02 | 2.83e-02 | 1.45e-02 | 197 |
| hsa04722111 | Esophagus | ESCC | Neurotrophin signaling pathway | 80/4205 | 119/8465 | 7.33e-05 | 3.07e-04 | 1.57e-04 | 80 |
| hsa0415114 | Esophagus | ESCC | PI3K-Akt signaling pathway | 197/4205 | 354/8465 | 1.24e-02 | 2.83e-02 | 1.45e-02 | 197 |
| hsa0472220 | Oral cavity | OSCC | Neurotrophin signaling pathway | 74/3704 | 119/8465 | 3.55e-05 | 1.49e-04 | 7.58e-05 | 74 |
| hsa0401014 | Oral cavity | OSCC | MAPK signaling pathway | 165/3704 | 302/8465 | 7.11e-05 | 2.74e-04 | 1.40e-04 | 165 |
| hsa041516 | Oral cavity | OSCC | PI3K-Akt signaling pathway | 185/3704 | 354/8465 | 6.26e-04 | 1.86e-03 | 9.49e-04 | 185 |
| hsa04722110 | Oral cavity | OSCC | Neurotrophin signaling pathway | 74/3704 | 119/8465 | 3.55e-05 | 1.49e-04 | 7.58e-05 | 74 |
| hsa0401015 | Oral cavity | OSCC | MAPK signaling pathway | 165/3704 | 302/8465 | 7.11e-05 | 2.74e-04 | 1.40e-04 | 165 |
| hsa0415113 | Oral cavity | OSCC | PI3K-Akt signaling pathway | 185/3704 | 354/8465 | 6.26e-04 | 1.86e-03 | 9.49e-04 | 185 |
| hsa0472224 | Oral cavity | LP | Neurotrophin signaling pathway | 46/2418 | 119/8465 | 1.07e-02 | 3.77e-02 | 2.43e-02 | 46 |
| hsa0472234 | Oral cavity | LP | Neurotrophin signaling pathway | 46/2418 | 119/8465 | 1.07e-02 | 3.77e-02 | 2.43e-02 | 46 |
| Hugo Symbol | Variant Class | Variant Classification | dbSNP RS | HGVSc | HGVSp | HGVSp Short | SWISSPROT | BIOTYPE | SIFT | PolyPhen | Tumor Sample Barcode | Tissue | Histology | Sex | Age | Stage | Therapy Types | Drugs | Outcome |
| NTRK2 | SNV | Missense_Mutation | rs144037140 | c.407G>A | p.Arg136His | p.R136H | Q16620 | protein_coding | tolerated(0.41) | benign(0.007) | TCGA-A8-A0A9-01 | Breast | breast invasive carcinoma | Female | >=65 | I/II | Hormone Therapy | anastrozole | SD |
| NTRK2 | SNV | Missense_Mutation | rs200996090 | c.1156N>A | p.Asp386Asn | p.D386N | Q16620 | protein_coding | tolerated(0.75) | benign(0.001) | TCGA-AN-A0XW-01 | Breast | breast invasive carcinoma | Female | <65 | III/IV | Unknown | Unknown | SD |
| NTRK2 | SNV | Missense_Mutation | novel | c.1869N>G | p.Cys623Trp | p.C623W | Q16620 | protein_coding | deleterious(0) | probably_damaging(0.998) | TCGA-AR-A1AO-01 | Breast | breast invasive carcinoma | Female | <65 | I/II | Chemotherapy | doxorubicin | SD |
| NTRK2 | SNV | Missense_Mutation | rs778391314 | c.157N>A | p.Val53Met | p.V53M | Q16620 | protein_coding | tolerated(0.13) | benign(0.001) | TCGA-AR-A250-01 | Breast | breast invasive carcinoma | Female | <65 | I/II | Chemotherapy | doxorubicin | SD |
| NTRK2 | SNV | Missense_Mutation | novel | c.2324N>G | p.Asn775Ser | p.N775S | Q16620 | protein_coding | deleterious(0) | probably_damaging(0.992) | TCGA-B6-A0IK-01 | Breast | breast invasive carcinoma | Female | <65 | III/IV | Unknown | Unknown | PD |
| NTRK2 | SNV | Missense_Mutation | | c.724N>A | p.Glu242Lys | p.E242K | Q16620 | protein_coding | tolerated(0.76) | benign(0.012) | TCGA-BH-A1F5-01 | Breast | breast invasive carcinoma | Female | <65 | I/II | Unknown | Unknown | SD |
| NTRK2 | SNV | Missense_Mutation | | c.1318N>A | p.Ala440Thr | p.A440T | Q16620 | protein_coding | deleterious(0.02) | probably_damaging(0.983) | TCGA-E2-A1LS-01 | Breast | breast invasive carcinoma | Female | <65 | I/II | Unspecific | Cyclophosphamide | SD |
| NTRK2 | SNV | Missense_Mutation | | c.167N>T | p.Pro56Leu | p.P56L | Q16620 | protein_coding | tolerated(0.1) | probably_damaging(1) | TCGA-E9-A22D-01 | Breast | breast invasive carcinoma | Female | <65 | I/II | Chemotherapy | 5-fluorouracil | SD |
| NTRK2 | insertion | In_Frame_Ins | novel | c.2322_2323insGGCATACTGTGT | p.Ser774_Asn775insGlyIleLeuCys | p.S774_N775insGILC | Q16620 | protein_coding | | | TCGA-B6-A0IK-01 | Breast | breast invasive carcinoma | Female | <65 | III/IV | Unknown | Unknown | PD |
| NTRK2 | deletion | Frame_Shift_Del | novel | c.50delG | p.Gly17AlafsTer47 | p.G17Afs*47 | Q16620 | protein_coding | | | TCGA-EW-A2FV-01 | Breast | breast invasive carcinoma | Female | <65 | III/IV | Chemotherapy | docetaxel | SD |
| Entrez ID | Symbol | Category | Interaction Types | Drug Claim Name | Drug Name | PMIDs |
| 4915 | NTRK2 | KINASE, TYROSINE KINASE, ENZYME, DRUGGABLE GENOME, CLINICALLY ACTIONABLE | | Macrocycle derivative 13 | | |
| 4915 | NTRK2 | KINASE, TYROSINE KINASE, ENZYME, DRUGGABLE GENOME, CLINICALLY ACTIONABLE | inhibitor | 249565751 | | |
| 4915 | NTRK2 | KINASE, TYROSINE KINASE, ENZYME, DRUGGABLE GENOME, CLINICALLY ACTIONABLE | inhibitor | 249565869 | CEP-11981 | |
| 4915 | NTRK2 | KINASE, TYROSINE KINASE, ENZYME, DRUGGABLE GENOME, CLINICALLY ACTIONABLE | | lithium | LITHIUM | 21047205,24885933 |
| 4915 | NTRK2 | KINASE, TYROSINE KINASE, ENZYME, DRUGGABLE GENOME, CLINICALLY ACTIONABLE | inhibitor | 381744997 | REPOTRECTINIB | |
| 4915 | NTRK2 | KINASE, TYROSINE KINASE, ENZYME, DRUGGABLE GENOME, CLINICALLY ACTIONABLE | | PILOCARPINE | PILOCARPINE | 15183516 |
| 4915 | NTRK2 | KINASE, TYROSINE KINASE, ENZYME, DRUGGABLE GENOME, CLINICALLY ACTIONABLE | | AST-487 | AST-487 | |
| 4915 | NTRK2 | KINASE, TYROSINE KINASE, ENZYME, DRUGGABLE GENOME, CLINICALLY ACTIONABLE | inhibitor | CHEMBL3545179 | AZD-7451 | |
| 4915 | NTRK2 | KINASE, TYROSINE KINASE, ENZYME, DRUGGABLE GENOME, CLINICALLY ACTIONABLE | inhibitor | 223366033 | | |
| 4915 | NTRK2 | KINASE, TYROSINE KINASE, ENZYME, DRUGGABLE GENOME, CLINICALLY ACTIONABLE | | TCMDC-125758 | CHEMBL546797 | |


