
|
|||||
|
 | |
| |
| |
| |
| |
| |
|
Gene: NTN4 |
Gene summary for NTN4 |
| Gene information | Species | Human | Gene symbol | NTN4 | Gene ID | 59277 |
| Gene name | netrin 4 | |
| Gene Alias | PRO3091 | |
| Cytomap | 12q22 | |
| Gene Type | protein-coding | GO ID | GO:0000902 | UniProtAcc | A8K3H6 |
Top |
Malignant transformation analysis |
| Identification of the aberrant gene expression in precancerous and cancerous lesions by comparing the gene expression of stem-like cells in diseased tissues with normal stem cells |
| Entrez ID | Symbol | Replicates | Species | Organ | Tissue | Adj P-value | Log2FC | Malignancy |
| 59277 | NTN4 | HTA11_3410_2000001011 | Human | Colorectum | AD | 4.56e-02 | -1.98e-01 | 0.0155 |
| 59277 | NTN4 | HTA11_99999970781_79442 | Human | Colorectum | MSS | 6.84e-03 | -2.91e-01 | 0.294 |
| 59277 | NTN4 | HTA11_99999971662_82457 | Human | Colorectum | MSS | 1.17e-08 | -3.30e-01 | 0.3859 |
| 59277 | NTN4 | HTA11_99999974143_84620 | Human | Colorectum | MSS | 7.00e-12 | -3.64e-01 | 0.3005 |
| 59277 | NTN4 | A015-C-203 | Human | Colorectum | FAP | 1.45e-10 | -1.93e-01 | -0.1294 |
| 59277 | NTN4 | A002-C-201 | Human | Colorectum | FAP | 3.14e-03 | -1.29e-01 | 0.0324 |
| 59277 | NTN4 | A001-C-119 | Human | Colorectum | FAP | 1.22e-02 | -2.69e-01 | -0.1557 |
| 59277 | NTN4 | A001-C-108 | Human | Colorectum | FAP | 7.53e-09 | -2.38e-01 | -0.0272 |
| 59277 | NTN4 | A002-C-205 | Human | Colorectum | FAP | 3.87e-09 | -2.39e-01 | -0.1236 |
| 59277 | NTN4 | A015-C-006 | Human | Colorectum | FAP | 2.44e-08 | -3.45e-01 | -0.0994 |
| 59277 | NTN4 | A002-C-114 | Human | Colorectum | FAP | 1.74e-07 | -2.38e-01 | -0.1561 |
| 59277 | NTN4 | A015-C-104 | Human | Colorectum | FAP | 8.19e-13 | -3.06e-01 | -0.1899 |
| 59277 | NTN4 | A001-C-014 | Human | Colorectum | FAP | 2.29e-09 | -2.97e-01 | 0.0135 |
| 59277 | NTN4 | A002-C-016 | Human | Colorectum | FAP | 8.34e-05 | -1.61e-01 | 0.0521 |
| 59277 | NTN4 | A015-C-002 | Human | Colorectum | FAP | 1.39e-05 | -3.34e-01 | -0.0763 |
| 59277 | NTN4 | A001-C-007 | Human | Colorectum | CRC | 3.57e-02 | -3.22e-01 | 0.1899 |
| 59277 | NTN4 | A001-C-203 | Human | Colorectum | FAP | 6.08e-03 | -1.06e-01 | -0.0481 |
| 59277 | NTN4 | A002-C-116 | Human | Colorectum | FAP | 1.43e-09 | -1.90e-01 | -0.0452 |
| 59277 | NTN4 | A014-C-008 | Human | Colorectum | FAP | 1.67e-06 | -3.51e-01 | -0.191 |
| 59277 | NTN4 | A018-E-020 | Human | Colorectum | FAP | 2.22e-06 | -6.90e-02 | -0.2034 |
| Page: 1 2 3 4 5 |
| Tissue | Expression Dynamics | Abbreviation |
| Colorectum (GSE201348) |  | FAP: Familial adenomatous polyposis |
| CRC: Colorectal cancer | ||
| Colorectum (HTA11) |  | AD: Adenomas |
| SER: Sessile serrated lesions | ||
| MSI-H: Microsatellite-high colorectal cancer | ||
| MSS: Microsatellite stable colorectal cancer | ||
| Esophagus |  | ESCC: Esophageal squamous cell carcinoma |
| HGIN: High-grade intraepithelial neoplasias | ||
| LGIN: Low-grade intraepithelial neoplasias | ||
| Lung | 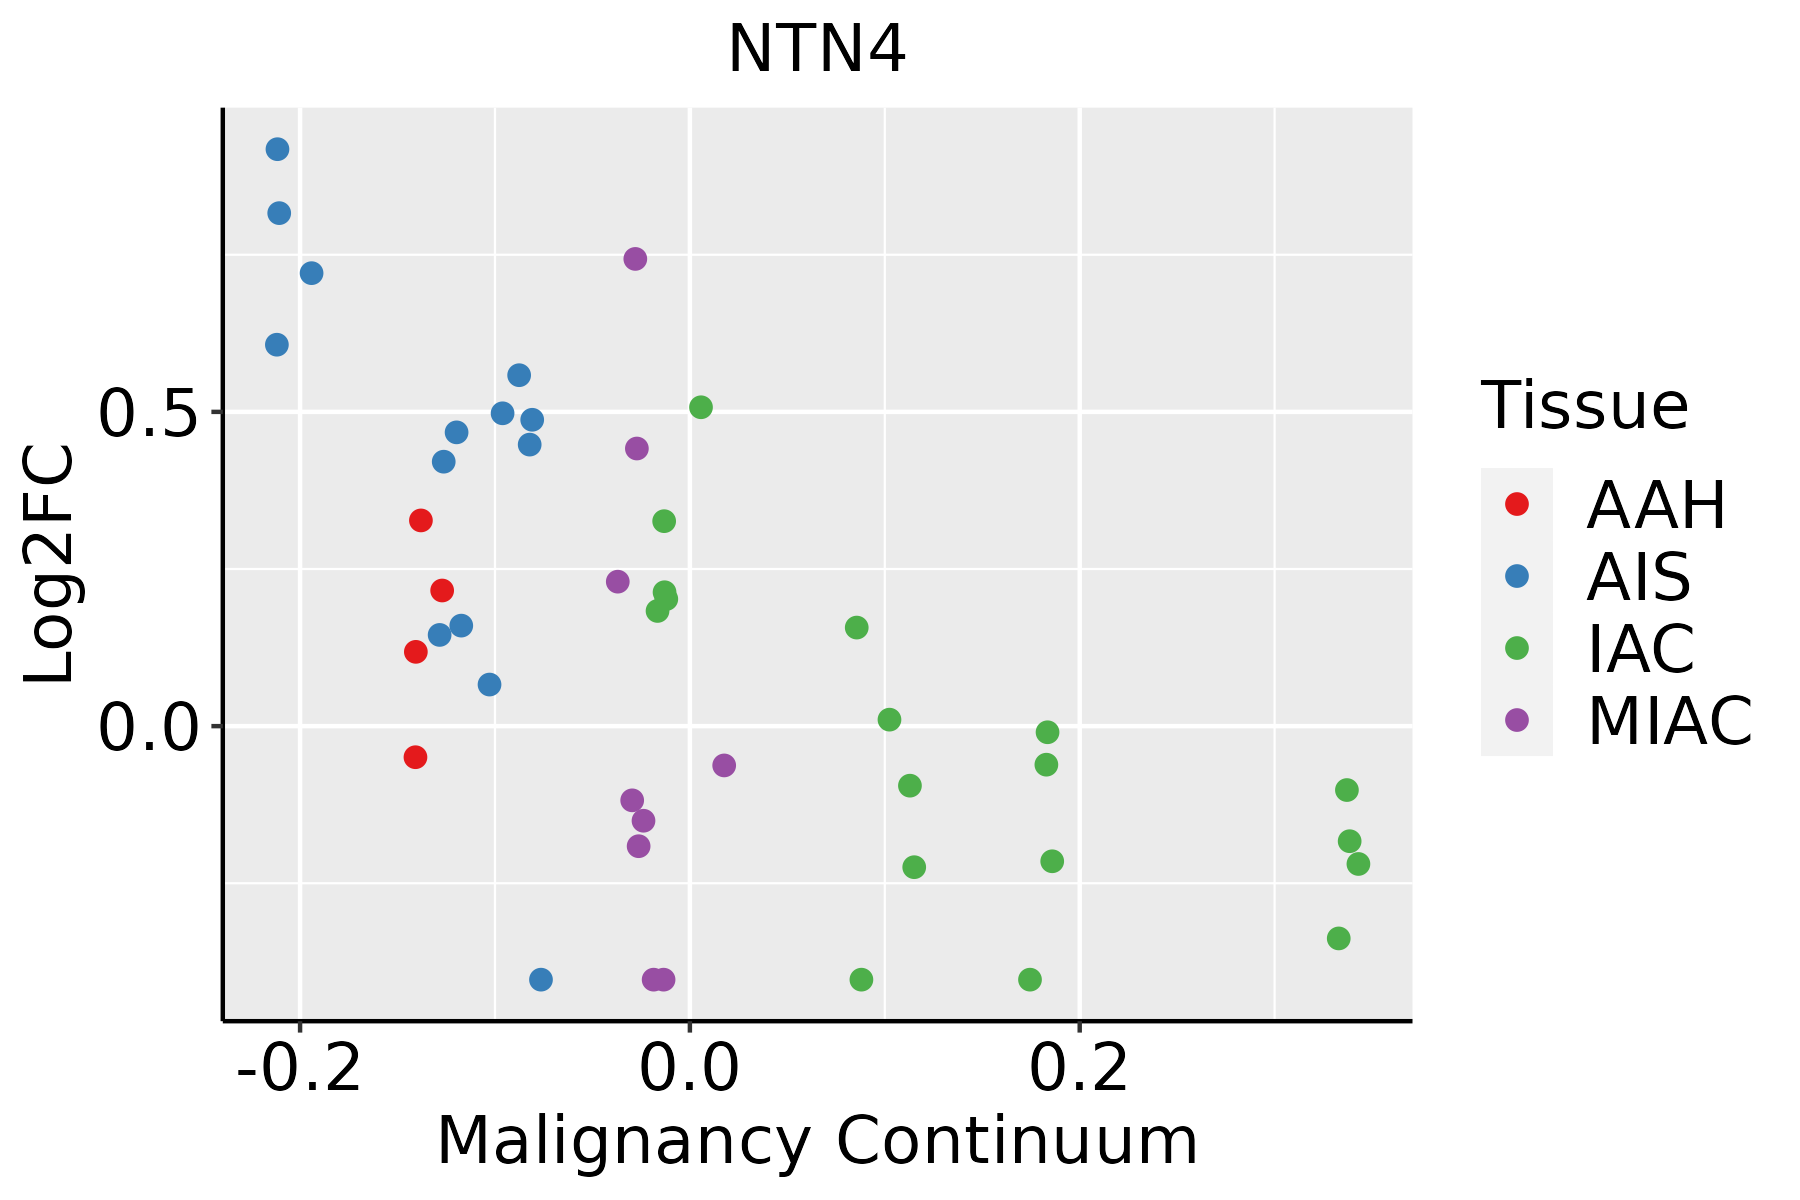 | AAH: Atypical adenomatous hyperplasia |
| AIS: Adenocarcinoma in situ | ||
| IAC: Invasive lung adenocarcinoma | ||
| MIA: Minimally invasive adenocarcinoma | ||
| Prostate |  | BPH: Benign Prostatic Hyperplasia |
| ∗log2FC in expression of this searched gene in stem-like cells from each diseased tissue sample relative to stem-like cells in normal samples in each tissue plotted against the malignancy continuum. Samples are colored based on if they are from different disease stage. |
Top |
Malignant transformation related pathway analysis |
| Find out the enriched GO biological processes and KEGG pathways involved in transition from healthy to precancer to cancer |
| Tissue | Disease Stage | Enriched GO biological Processes |
| Colorectum | AD |  |
| Colorectum | SER |  |
| Colorectum | MSS |  |
| Colorectum | MSI-H |  |
| Colorectum | FAP |  |
| ∗Top 15 enriched GO BP terms are showed in the bar plot of each disease state in each tissue. Each row represents a significant GO biological process which is colored according to the -log10(p.adjust). |
| Page: 1 2 3 4 5 6 7 8 9 |
| GO ID | Tissue | Disease Stage | Description | Gene Ratio | Bg Ratio | pvalue | p.adjust | Count |
| GO:0048732 | Colorectum | AD | gland development | 149/3918 | 436/18723 | 6.07e-11 | 6.33e-09 | 149 |
| GO:0031589 | Colorectum | AD | cell-substrate adhesion | 116/3918 | 363/18723 | 4.68e-07 | 1.76e-05 | 116 |
| GO:0007409 | Colorectum | AD | axonogenesis | 122/3918 | 418/18723 | 3.36e-05 | 6.15e-04 | 122 |
| GO:0061564 | Colorectum | AD | axon development | 132/3918 | 467/18723 | 8.40e-05 | 1.31e-03 | 132 |
| GO:0034446 | Colorectum | AD | substrate adhesion-dependent cell spreading | 40/3918 | 108/18723 | 8.52e-05 | 1.32e-03 | 40 |
| GO:0022612 | Colorectum | AD | gland morphogenesis | 42/3918 | 118/18723 | 1.62e-04 | 2.23e-03 | 42 |
| GO:0007411 | Colorectum | AD | axon guidance | 64/3918 | 227/18723 | 5.41e-03 | 3.55e-02 | 64 |
| GO:0097485 | Colorectum | AD | neuron projection guidance | 64/3918 | 228/18723 | 6.02e-03 | 3.78e-02 | 64 |
| GO:0001763 | Colorectum | AD | morphogenesis of a branching structure | 56/3918 | 196/18723 | 6.60e-03 | 4.09e-02 | 56 |
| GO:00074111 | Colorectum | SER | axon guidance | 51/2897 | 227/18723 | 3.29e-03 | 2.82e-02 | 51 |
| GO:00974851 | Colorectum | SER | neuron projection guidance | 51/2897 | 228/18723 | 3.61e-03 | 3.03e-02 | 51 |
| GO:00615641 | Colorectum | SER | axon development | 94/2897 | 467/18723 | 3.78e-03 | 3.13e-02 | 94 |
| GO:00074091 | Colorectum | SER | axonogenesis | 84/2897 | 418/18723 | 6.20e-03 | 4.49e-02 | 84 |
| GO:00487322 | Colorectum | MSS | gland development | 143/3467 | 436/18723 | 3.85e-13 | 8.01e-11 | 143 |
| GO:00315892 | Colorectum | MSS | cell-substrate adhesion | 104/3467 | 363/18723 | 1.35e-06 | 4.51e-05 | 104 |
| GO:00344462 | Colorectum | MSS | substrate adhesion-dependent cell spreading | 39/3467 | 108/18723 | 1.15e-05 | 2.71e-04 | 39 |
| GO:00226122 | Colorectum | MSS | gland morphogenesis | 41/3467 | 118/18723 | 2.02e-05 | 4.30e-04 | 41 |
| GO:00074092 | Colorectum | MSS | axonogenesis | 105/3467 | 418/18723 | 4.32e-04 | 5.23e-03 | 105 |
| GO:00615642 | Colorectum | MSS | axon development | 115/3467 | 467/18723 | 5.33e-04 | 6.00e-03 | 115 |
| GO:00017631 | Colorectum | MSS | morphogenesis of a branching structure | 55/3467 | 196/18723 | 6.70e-04 | 7.25e-03 | 55 |
| Page: 1 2 3 4 5 |
| Pathway ID | Tissue | Disease Stage | Description | Gene Ratio | Bg Ratio | pvalue | p.adjust | qvalue | Count |
| hsa04360 | Colorectum | AD | Axon guidance | 61/2092 | 182/8465 | 4.36e-03 | 2.17e-02 | 1.38e-02 | 61 |
| hsa043601 | Colorectum | AD | Axon guidance | 61/2092 | 182/8465 | 4.36e-03 | 2.17e-02 | 1.38e-02 | 61 |
| hsa043602 | Colorectum | MSS | Axon guidance | 54/1875 | 182/8465 | 1.03e-02 | 3.69e-02 | 2.26e-02 | 54 |
| hsa043603 | Colorectum | MSS | Axon guidance | 54/1875 | 182/8465 | 1.03e-02 | 3.69e-02 | 2.26e-02 | 54 |
| hsa043604 | Colorectum | FAP | Axon guidance | 47/1404 | 182/8465 | 9.09e-04 | 5.20e-03 | 3.16e-03 | 47 |
| hsa043605 | Colorectum | FAP | Axon guidance | 47/1404 | 182/8465 | 9.09e-04 | 5.20e-03 | 3.16e-03 | 47 |
| hsa043606 | Colorectum | CRC | Axon guidance | 43/1091 | 182/8465 | 4.38e-05 | 8.70e-04 | 5.90e-04 | 43 |
| hsa043607 | Colorectum | CRC | Axon guidance | 43/1091 | 182/8465 | 4.38e-05 | 8.70e-04 | 5.90e-04 | 43 |
| hsa0436016 | Esophagus | ESCC | Axon guidance | 108/4205 | 182/8465 | 5.13e-03 | 1.30e-02 | 6.67e-03 | 108 |
| hsa0436017 | Esophagus | ESCC | Axon guidance | 108/4205 | 182/8465 | 5.13e-03 | 1.30e-02 | 6.67e-03 | 108 |
| hsa043608 | Lung | IAC | Axon guidance | 34/1053 | 182/8465 | 9.31e-03 | 3.62e-02 | 2.41e-02 | 34 |
| hsa0436011 | Lung | IAC | Axon guidance | 34/1053 | 182/8465 | 9.31e-03 | 3.62e-02 | 2.41e-02 | 34 |
| hsa0436021 | Lung | AIS | Axon guidance | 34/961 | 182/8465 | 2.22e-03 | 1.37e-02 | 8.80e-03 | 34 |
| hsa0436031 | Lung | AIS | Axon guidance | 34/961 | 182/8465 | 2.22e-03 | 1.37e-02 | 8.80e-03 | 34 |
| Page: 1 |
Top |
Cell-cell communication analysis |
| Identification of potential cell-cell interactions between two cell types and their ligand-receptor pairs for different disease states |
| Ligand | Receptor | LRpair | Pathway | Tissue | Disease Stage |
| Page: 1 |
Top |
Single-cell gene regulatory network inference analysis |
| Find out the significant the regulons (TFs) and the target genes of each regulon across cell types for different disease states |
| TF | Cell Type | Tissue | Disease Stage | Target Gene | RSS | Regulon Activity |
| ∗The dot plots of a searched regulon are shown for all cell subpopulations in each disease state of each tissue based on the regulon specific score inferred using pySCENIC and by calculating the average expression. |
| Page: 1 |
Top |
Somatic mutation of malignant transformation related genes |
| Annotation of somatic variants for genes involved in malignant transformation |
| Hugo Symbol | Variant Class | Variant Classification | dbSNP RS | HGVSc | HGVSp | HGVSp Short | SWISSPROT | BIOTYPE | SIFT | PolyPhen | Tumor Sample Barcode | Tissue | Histology | Sex | Age | Stage | Therapy Types | Drugs | Outcome |
| NTN4 | SNV | Missense_Mutation | novel | c.1205N>T | p.Ser402Leu | p.S402L | Q9HB63 | protein_coding | deleterious(0) | possibly_damaging(0.826) | TCGA-5L-AAT0-01 | Breast | breast invasive carcinoma | Female | <65 | I/II | Hormone Therapy | tamoxiphen | SD |
| NTN4 | SNV | Missense_Mutation | novel | c.1204N>A | p.Ser402Thr | p.S402T | Q9HB63 | protein_coding | tolerated(0.19) | benign(0.095) | TCGA-5L-AAT0-01 | Breast | breast invasive carcinoma | Female | <65 | I/II | Hormone Therapy | tamoxiphen | SD |
| NTN4 | SNV | Missense_Mutation | rs762563540 | c.275N>T | p.Ser92Phe | p.S92F | Q9HB63 | protein_coding | deleterious(0.04) | possibly_damaging(0.571) | TCGA-AR-A2LE-01 | Breast | breast invasive carcinoma | Female | >=65 | I/II | Hormone Therapy | tamoxiphen | PD |
| NTN4 | insertion | Nonsense_Mutation | novel | c.1075_1076insAAAAATGAGAATGTCTGAACTACTAAGCAGATAAAAGA | p.Cys359Ter | p.C359* | Q9HB63 | protein_coding | TCGA-B6-A0I8-01 | Breast | breast invasive carcinoma | Female | <65 | I/II | Unknown | Unknown | PD | ||
| NTN4 | SNV | Missense_Mutation | rs762872102 | c.1033N>A | p.Val345Ile | p.V345I | Q9HB63 | protein_coding | tolerated(0.5) | benign(0) | TCGA-2W-A8YY-01 | Cervix | cervical & endocervical cancer | Female | <65 | I/II | Chemotherapy | cisplatin | CR |
| NTN4 | SNV | Missense_Mutation | novel | c.482N>T | p.Ala161Val | p.A161V | Q9HB63 | protein_coding | deleterious(0) | probably_damaging(0.986) | TCGA-2W-A8YY-01 | Cervix | cervical & endocervical cancer | Female | <65 | I/II | Chemotherapy | cisplatin | CR |
| NTN4 | SNV | Missense_Mutation | novel | c.1705N>A | p.Glu569Lys | p.E569K | Q9HB63 | protein_coding | tolerated(0.06) | probably_damaging(0.984) | TCGA-C5-A7UE-01 | Cervix | cervical & endocervical cancer | Female | <65 | I/II | Chemotherapy | cisplatin | SD |
| NTN4 | SNV | Missense_Mutation | novel | c.1717N>A | p.Asp573Asn | p.D573N | Q9HB63 | protein_coding | tolerated(1) | benign(0) | TCGA-MA-AA41-01 | Cervix | cervical & endocervical cancer | Female | <65 | I/II | Unknown | Unknown | SD |
| NTN4 | SNV | Missense_Mutation | c.238T>C | p.Cys80Arg | p.C80R | Q9HB63 | protein_coding | deleterious(0) | probably_damaging(1) | TCGA-AA-3492-01 | Colorectum | colon adenocarcinoma | Female | >=65 | I/II | Unknown | Unknown | SD | |
| NTN4 | SNV | Missense_Mutation | c.1185T>G | p.Cys395Trp | p.C395W | Q9HB63 | protein_coding | deleterious(0) | probably_damaging(1) | TCGA-AA-3693-01 | Colorectum | colon adenocarcinoma | Female | >=65 | III/IV | Unknown | Unknown | SD |
| Page: 1 2 3 4 5 6 7 |
Top |
Related drugs of malignant transformation related genes |
| Identification of chemicals and drugs interact with genes involved in malignant transfromation |
| (DGIdb 4.0) |
| Entrez ID | Symbol | Category | Interaction Types | Drug Claim Name | Drug Name | PMIDs |
| Page: 1 |

Copyright 2023-Present -The University of Texas Health Science Center at Houston |