
|
|||||
|
 | |
| |
| |
| |
| |
| |
|
Gene: NTMT1 |
Gene summary for NTMT1 |
| Gene information | Species | Human | Gene symbol | NTMT1 | Gene ID | 28989 |
| Gene name | N-terminal Xaa-Pro-Lys N-methyltransferase 1 | |
| Gene Alias | AD-003 | |
| Cytomap | 9q34.11 | |
| Gene Type | protein-coding | GO ID | GO:0000226 | UniProtAcc | A0A024R8E4 |
Top |
Malignant transformation analysis |
| Identification of the aberrant gene expression in precancerous and cancerous lesions by comparing the gene expression of stem-like cells in diseased tissues with normal stem cells |
| Entrez ID | Symbol | Replicates | Species | Organ | Tissue | Adj P-value | Log2FC | Malignancy |
| 28989 | NTMT1 | LZE4T | Human | Esophagus | ESCC | 5.50e-07 | 2.83e-01 | 0.0811 |
| 28989 | NTMT1 | LZE7T | Human | Esophagus | ESCC | 5.40e-12 | 6.10e-01 | 0.0667 |
| 28989 | NTMT1 | LZE8T | Human | Esophagus | ESCC | 4.10e-16 | 4.36e-01 | 0.067 |
| 28989 | NTMT1 | LZE20T | Human | Esophagus | ESCC | 3.11e-16 | 4.79e-01 | 0.0662 |
| 28989 | NTMT1 | LZE22D1 | Human | Esophagus | HGIN | 7.67e-04 | 8.63e-02 | 0.0595 |
| 28989 | NTMT1 | LZE22T | Human | Esophagus | ESCC | 4.05e-04 | 3.01e-01 | 0.068 |
| 28989 | NTMT1 | LZE24T | Human | Esophagus | ESCC | 4.72e-18 | 5.70e-01 | 0.0596 |
| 28989 | NTMT1 | LZE6T | Human | Esophagus | ESCC | 6.05e-09 | 6.80e-01 | 0.0845 |
| 28989 | NTMT1 | P1T-E | Human | Esophagus | ESCC | 2.59e-16 | 6.61e-01 | 0.0875 |
| 28989 | NTMT1 | P2T-E | Human | Esophagus | ESCC | 9.25e-40 | 6.68e-01 | 0.1177 |
| 28989 | NTMT1 | P4T-E | Human | Esophagus | ESCC | 5.98e-38 | 9.12e-01 | 0.1323 |
| 28989 | NTMT1 | P5T-E | Human | Esophagus | ESCC | 3.55e-33 | 6.38e-01 | 0.1327 |
| 28989 | NTMT1 | P8T-E | Human | Esophagus | ESCC | 4.32e-36 | 6.60e-01 | 0.0889 |
| 28989 | NTMT1 | P9T-E | Human | Esophagus | ESCC | 4.84e-16 | 4.58e-01 | 0.1131 |
| 28989 | NTMT1 | P10T-E | Human | Esophagus | ESCC | 2.00e-32 | 4.42e-01 | 0.116 |
| 28989 | NTMT1 | P11T-E | Human | Esophagus | ESCC | 5.88e-17 | 7.32e-01 | 0.1426 |
| 28989 | NTMT1 | P12T-E | Human | Esophagus | ESCC | 3.05e-29 | 5.21e-01 | 0.1122 |
| 28989 | NTMT1 | P15T-E | Human | Esophagus | ESCC | 7.38e-37 | 6.98e-01 | 0.1149 |
| 28989 | NTMT1 | P16T-E | Human | Esophagus | ESCC | 5.39e-21 | 3.62e-01 | 0.1153 |
| 28989 | NTMT1 | P17T-E | Human | Esophagus | ESCC | 1.96e-18 | 8.76e-01 | 0.1278 |
| Page: 1 2 3 4 5 6 |
| Tissue | Expression Dynamics | Abbreviation |
| Esophagus | 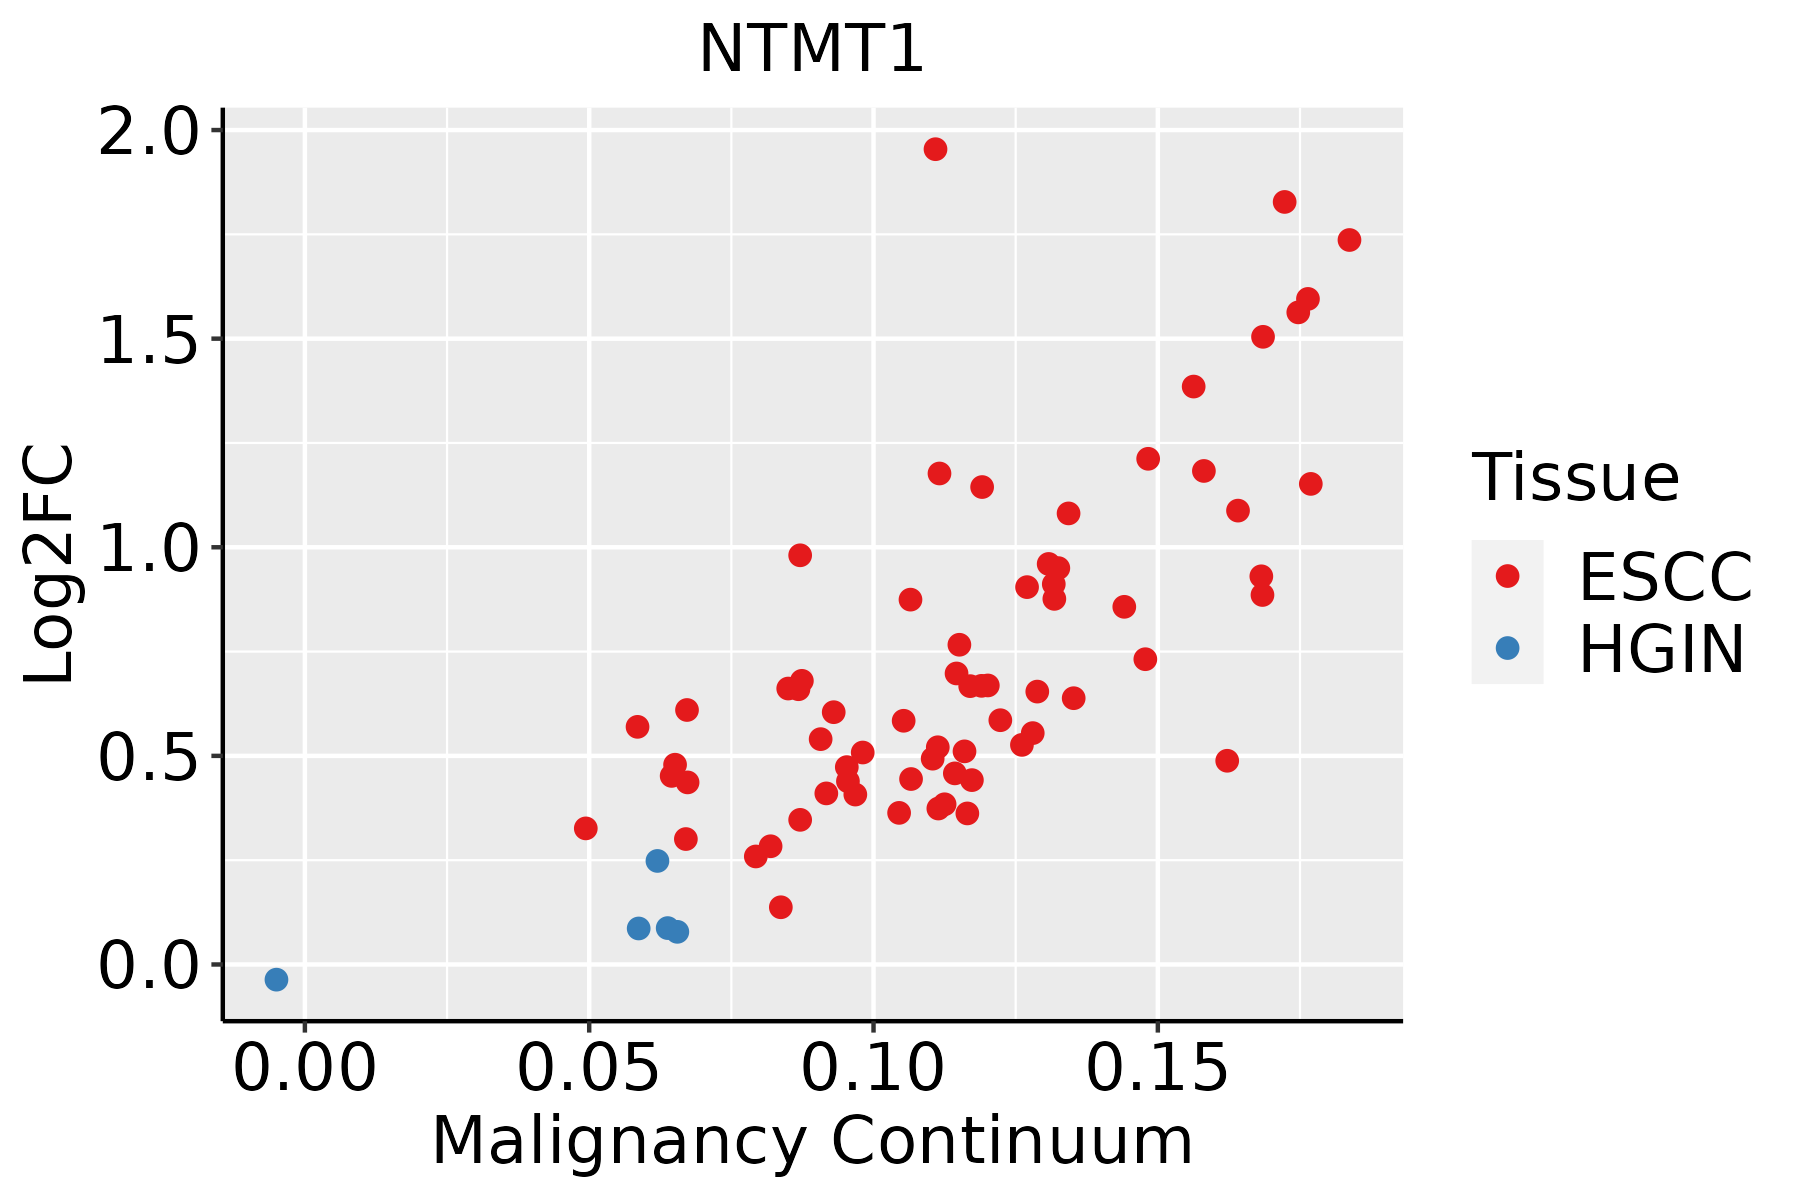 | ESCC: Esophageal squamous cell carcinoma |
| HGIN: High-grade intraepithelial neoplasias | ||
| LGIN: Low-grade intraepithelial neoplasias | ||
| Liver |  | HCC: Hepatocellular carcinoma |
| NAFLD: Non-alcoholic fatty liver disease | ||
| Oral Cavity |  | EOLP: Erosive Oral lichen planus |
| LP: leukoplakia | ||
| NEOLP: Non-erosive oral lichen planus | ||
| OSCC: Oral squamous cell carcinoma | ||
| Skin | 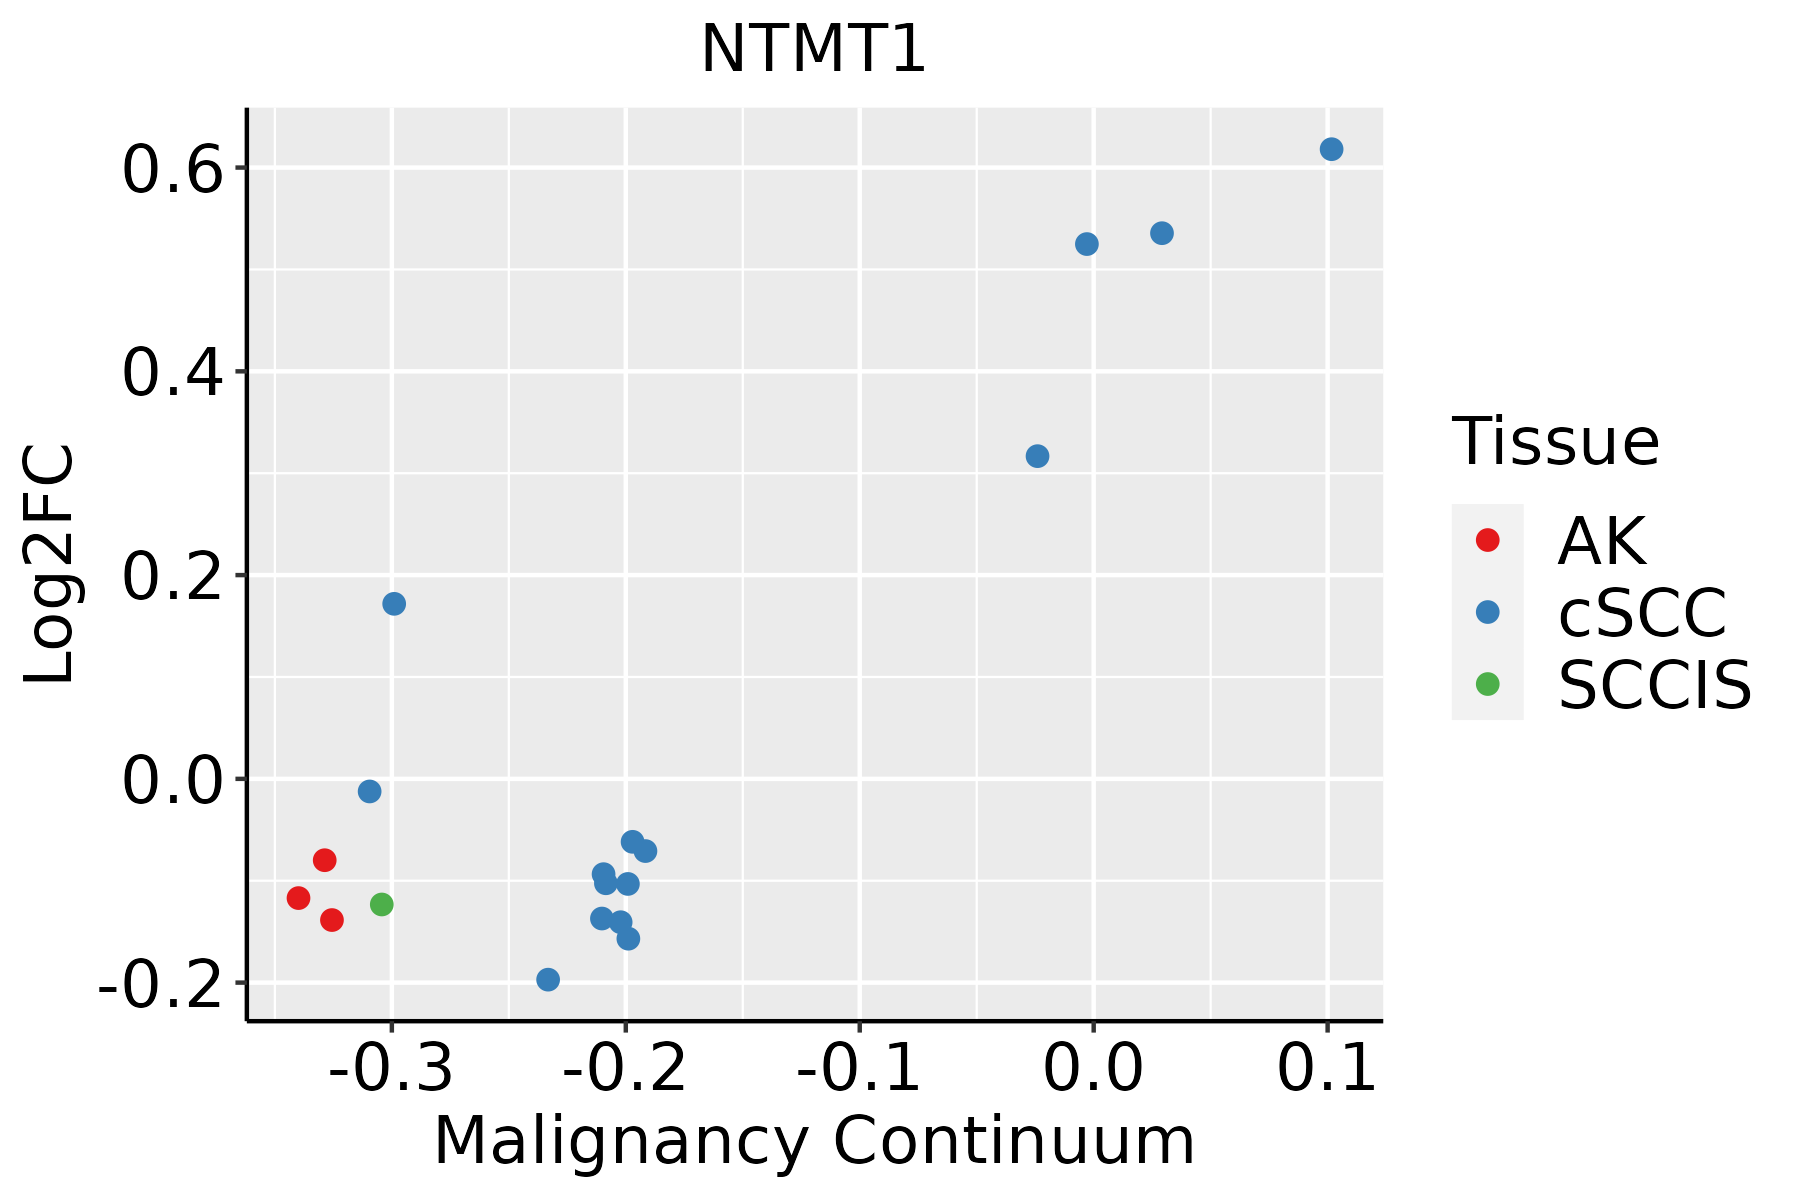 | AK: Actinic keratosis |
| cSCC: Cutaneous squamous cell carcinoma | ||
| SCCIS:squamous cell carcinoma in situ | ||
| Thyroid |  | ATC: Anaplastic thyroid cancer |
| HT: Hashimoto's thyroiditis | ||
| PTC: Papillary thyroid cancer |
| ∗log2FC in expression of this searched gene in stem-like cells from each diseased tissue sample relative to stem-like cells in normal samples in each tissue plotted against the malignancy continuum. Samples are colored based on if they are from different disease stage. |
Top |
Malignant transformation related pathway analysis |
| Find out the enriched GO biological processes and KEGG pathways involved in transition from healthy to precancer to cancer |
| Tissue | Disease Stage | Enriched GO biological Processes |
| Colorectum | AD |  |
| Colorectum | SER |  |
| Colorectum | MSS |  |
| Colorectum | MSI-H |  |
| Colorectum | FAP |  |
| ∗Top 15 enriched GO BP terms are showed in the bar plot of each disease state in each tissue. Each row represents a significant GO biological process which is colored according to the -log10(p.adjust). |
| Page: 1 2 3 4 5 6 7 8 9 |
| GO ID | Tissue | Disease Stage | Description | Gene Ratio | Bg Ratio | pvalue | p.adjust | Count |
| GO:00165708 | Esophagus | HGIN | histone modification | 92/2587 | 463/18723 | 1.70e-04 | 3.30e-03 | 92 |
| GO:00070593 | Esophagus | HGIN | chromosome segregation | 71/2587 | 346/18723 | 3.47e-04 | 5.62e-03 | 71 |
| GO:00070518 | Esophagus | HGIN | spindle organization | 42/2587 | 184/18723 | 6.07e-04 | 8.49e-03 | 42 |
| GO:00182089 | Esophagus | HGIN | peptidyl-proline modification | 17/2587 | 58/18723 | 1.64e-03 | 1.82e-02 | 17 |
| GO:00064798 | Esophagus | HGIN | protein methylation | 38/2587 | 181/18723 | 5.05e-03 | 4.22e-02 | 38 |
| GO:00082138 | Esophagus | HGIN | protein alkylation | 38/2587 | 181/18723 | 5.05e-03 | 4.22e-02 | 38 |
| GO:001657015 | Esophagus | ESCC | histone modification | 323/8552 | 463/18723 | 2.61e-26 | 7.88e-24 | 323 |
| GO:000705911 | Esophagus | ESCC | chromosome segregation | 238/8552 | 346/18723 | 1.72e-18 | 1.82e-16 | 238 |
| GO:000705114 | Esophagus | ESCC | spindle organization | 134/8552 | 184/18723 | 5.70e-14 | 2.87e-12 | 134 |
| GO:00434143 | Esophagus | ESCC | macromolecule methylation | 199/8552 | 316/18723 | 3.44e-10 | 9.57e-09 | 199 |
| GO:00322592 | Esophagus | ESCC | methylation | 222/8552 | 364/18723 | 2.26e-09 | 5.09e-08 | 222 |
| GO:001820816 | Esophagus | ESCC | peptidyl-proline modification | 46/8552 | 58/18723 | 1.59e-07 | 2.51e-06 | 46 |
| GO:000647914 | Esophagus | ESCC | protein methylation | 115/8552 | 181/18723 | 9.07e-07 | 1.16e-05 | 115 |
| GO:000821314 | Esophagus | ESCC | protein alkylation | 115/8552 | 181/18723 | 9.07e-07 | 1.16e-05 | 115 |
| GO:00182099 | Esophagus | ESCC | peptidyl-serine modification | 196/8552 | 338/18723 | 3.07e-06 | 3.47e-05 | 196 |
| GO:00165718 | Esophagus | ESCC | histone methylation | 89/8552 | 141/18723 | 2.17e-05 | 1.87e-04 | 89 |
| GO:0031365 | Esophagus | ESCC | N-terminal protein amino acid modification | 21/8552 | 30/18723 | 6.17e-03 | 2.27e-02 | 21 |
| GO:001657011 | Liver | Cirrhotic | histone modification | 154/4634 | 463/18723 | 1.92e-05 | 2.57e-04 | 154 |
| GO:00182084 | Liver | Cirrhotic | peptidyl-proline modification | 26/4634 | 58/18723 | 6.65e-04 | 5.04e-03 | 26 |
| GO:00070514 | Liver | Cirrhotic | spindle organization | 62/4634 | 184/18723 | 3.88e-03 | 2.10e-02 | 62 |
| Page: 1 2 3 4 5 |
| Pathway ID | Tissue | Disease Stage | Description | Gene Ratio | Bg Ratio | pvalue | p.adjust | qvalue | Count |
| Page: 1 |
Top |
Cell-cell communication analysis |
| Identification of potential cell-cell interactions between two cell types and their ligand-receptor pairs for different disease states |
| Ligand | Receptor | LRpair | Pathway | Tissue | Disease Stage |
| Page: 1 |
Top |
Single-cell gene regulatory network inference analysis |
| Find out the significant the regulons (TFs) and the target genes of each regulon across cell types for different disease states |
| TF | Cell Type | Tissue | Disease Stage | Target Gene | RSS | Regulon Activity |
| ∗The dot plots of a searched regulon are shown for all cell subpopulations in each disease state of each tissue based on the regulon specific score inferred using pySCENIC and by calculating the average expression. |
| Page: 1 |
Top |
Somatic mutation of malignant transformation related genes |
| Annotation of somatic variants for genes involved in malignant transformation |
| Hugo Symbol | Variant Class | Variant Classification | dbSNP RS | HGVSc | HGVSp | HGVSp Short | SWISSPROT | BIOTYPE | SIFT | PolyPhen | Tumor Sample Barcode | Tissue | Histology | Sex | Age | Stage | Therapy Types | Drugs | Outcome |
| NTMT1 | SNV | Missense_Mutation | c.51N>C | p.Lys17Asn | p.K17N | Q9BV86 | protein_coding | deleterious(0.03) | benign(0.034) | TCGA-AO-A03T-01 | Breast | breast invasive carcinoma | Female | <65 | I/II | Chemotherapy | cyclophosphamide | SD | |
| NTMT1 | SNV | Missense_Mutation | novel | c.495C>G | p.Ile165Met | p.I165M | Q9BV86 | protein_coding | deleterious(0) | probably_damaging(0.954) | TCGA-LL-A5YO-01 | Breast | breast invasive carcinoma | Female | <65 | I/II | Chemotherapy | taxotere | CR |
| NTMT1 | deletion | Frame_Shift_Del | novel | c.478delN | p.Asn160ThrfsTer15 | p.N160Tfs*15 | Q9BV86 | protein_coding | TCGA-D8-A27V-01 | Breast | breast invasive carcinoma | Female | <65 | I/II | Hormone Therapy | tamoxiphen | SD | ||
| NTMT1 | deletion | Frame_Shift_Del | novel | c.33delA | p.Gln11HisfsTer43 | p.Q11Hfs*43 | Q9BV86 | protein_coding | TCGA-EW-A2FV-01 | Breast | breast invasive carcinoma | Female | <65 | III/IV | Chemotherapy | docetaxel | SD | ||
| NTMT1 | SNV | Missense_Mutation | c.22N>C | p.Asp8His | p.D8H | Q9BV86 | protein_coding | tolerated(0.16) | possibly_damaging(0.678) | TCGA-DG-A2KM-01 | Cervix | cervical & endocervical cancer | Female | <65 | I/II | Chemotherapy | cisplatin | SD | |
| NTMT1 | SNV | Missense_Mutation | c.159N>C | p.Leu53Phe | p.L53F | Q9BV86 | protein_coding | tolerated(0.12) | probably_damaging(1) | TCGA-IR-A3LL-01 | Cervix | cervical & endocervical cancer | Female | <65 | I/II | Chemotherapy | cisplatin | CR | |
| NTMT1 | SNV | Missense_Mutation | c.648N>G | p.His216Gln | p.H216Q | Q9BV86 | protein_coding | tolerated(0.41) | benign(0) | TCGA-AA-3663-01 | Colorectum | colon adenocarcinoma | Male | <65 | I/II | Unknown | Unknown | SD | |
| NTMT1 | SNV | Missense_Mutation | c.542N>T | p.Ser181Ile | p.S181I | Q9BV86 | protein_coding | deleterious(0) | probably_damaging(1) | TCGA-AD-A5EJ-01 | Colorectum | colon adenocarcinoma | Female | >=65 | I/II | Unknown | Unknown | SD | |
| NTMT1 | SNV | Missense_Mutation | rs199618234 | c.391G>A | p.Val131Met | p.V131M | Q9BV86 | protein_coding | deleterious(0) | probably_damaging(0.965) | TCGA-AZ-6598-01 | Colorectum | colon adenocarcinoma | Female | >=65 | I/II | Unknown | Unknown | SD |
| NTMT1 | SNV | Missense_Mutation | rs758319961 | c.454C>T | p.Arg152Cys | p.R152C | Q9BV86 | protein_coding | deleterious(0.02) | probably_damaging(0.998) | TCGA-WS-AB45-01 | Colorectum | colon adenocarcinoma | Female | <65 | I/II | Unknown | Unknown | SD |
| Page: 1 2 3 |
Top |
Related drugs of malignant transformation related genes |
| Identification of chemicals and drugs interact with genes involved in malignant transfromation |
| (DGIdb 4.0) |
| Entrez ID | Symbol | Category | Interaction Types | Drug Claim Name | Drug Name | PMIDs |
| Page: 1 |

Copyright 2023-Present -The University of Texas Health Science Center at Houston |