
|
|||||
|
 | |
| |
| |
| |
| |
| |
|
Gene: NT5E |
Gene summary for NT5E |
| Gene information | Species | Human | Gene symbol | NT5E | Gene ID | 4907 |
| Gene name | 5'-nucleotidase ecto | |
| Gene Alias | CALJA | |
| Cytomap | 6q14.3 | |
| Gene Type | protein-coding | GO ID | GO:0006139 | UniProtAcc | P21589 |
Top |
Malignant transformation analysis |
| Identification of the aberrant gene expression in precancerous and cancerous lesions by comparing the gene expression of stem-like cells in diseased tissues with normal stem cells |
| Entrez ID | Symbol | Replicates | Species | Organ | Tissue | Adj P-value | Log2FC | Malignancy |
| 4907 | NT5E | HTA11_2487_2000001011 | Human | Colorectum | SER | 1.92e-03 | 3.55e-01 | -0.1808 |
| 4907 | NT5E | HTA11_78_2000001011 | Human | Colorectum | AD | 2.45e-11 | 6.13e-01 | -0.1088 |
| 4907 | NT5E | HTA11_347_2000001011 | Human | Colorectum | AD | 2.71e-09 | 4.53e-01 | -0.1954 |
| 4907 | NT5E | HTA11_6801_2000001011 | Human | Colorectum | SER | 2.61e-05 | 7.26e-01 | 0.0171 |
| 4907 | NT5E | HTA11_6818_2000001021 | Human | Colorectum | AD | 1.10e-04 | 4.15e-01 | 0.0588 |
| 4907 | NT5E | HTA11_99999971662_82457 | Human | Colorectum | MSS | 4.18e-02 | 2.47e-01 | 0.3859 |
| 4907 | NT5E | LZE22T | Human | Esophagus | ESCC | 1.73e-02 | 2.83e-01 | 0.068 |
| 4907 | NT5E | LZE6T | Human | Esophagus | ESCC | 5.75e-04 | 5.11e-01 | 0.0845 |
| 4907 | NT5E | P5T-E | Human | Esophagus | ESCC | 9.38e-04 | 1.30e-01 | 0.1327 |
| 4907 | NT5E | P8T-E | Human | Esophagus | ESCC | 3.73e-45 | 1.08e+00 | 0.0889 |
| 4907 | NT5E | P9T-E | Human | Esophagus | ESCC | 3.93e-15 | 4.82e-01 | 0.1131 |
| 4907 | NT5E | P10T-E | Human | Esophagus | ESCC | 2.43e-04 | 3.44e-01 | 0.116 |
| 4907 | NT5E | P11T-E | Human | Esophagus | ESCC | 6.64e-03 | 3.35e-01 | 0.1426 |
| 4907 | NT5E | P15T-E | Human | Esophagus | ESCC | 1.04e-02 | 3.25e-01 | 0.1149 |
| 4907 | NT5E | P19T-E | Human | Esophagus | ESCC | 4.95e-02 | 7.55e-01 | 0.1662 |
| 4907 | NT5E | P21T-E | Human | Esophagus | ESCC | 1.13e-53 | 1.50e+00 | 0.1617 |
| 4907 | NT5E | P23T-E | Human | Esophagus | ESCC | 4.71e-05 | 2.89e-01 | 0.108 |
| 4907 | NT5E | P24T-E | Human | Esophagus | ESCC | 5.64e-05 | 4.01e-01 | 0.1287 |
| 4907 | NT5E | P30T-E | Human | Esophagus | ESCC | 4.12e-05 | 7.73e-01 | 0.137 |
| 4907 | NT5E | P32T-E | Human | Esophagus | ESCC | 2.39e-30 | 9.62e-01 | 0.1666 |
| Page: 1 2 3 4 |
| Tissue | Expression Dynamics | Abbreviation |
| Colorectum (GSE201348) |  | FAP: Familial adenomatous polyposis |
| CRC: Colorectal cancer | ||
| Colorectum (HTA11) |  | AD: Adenomas |
| SER: Sessile serrated lesions | ||
| MSI-H: Microsatellite-high colorectal cancer | ||
| MSS: Microsatellite stable colorectal cancer | ||
| Esophagus | 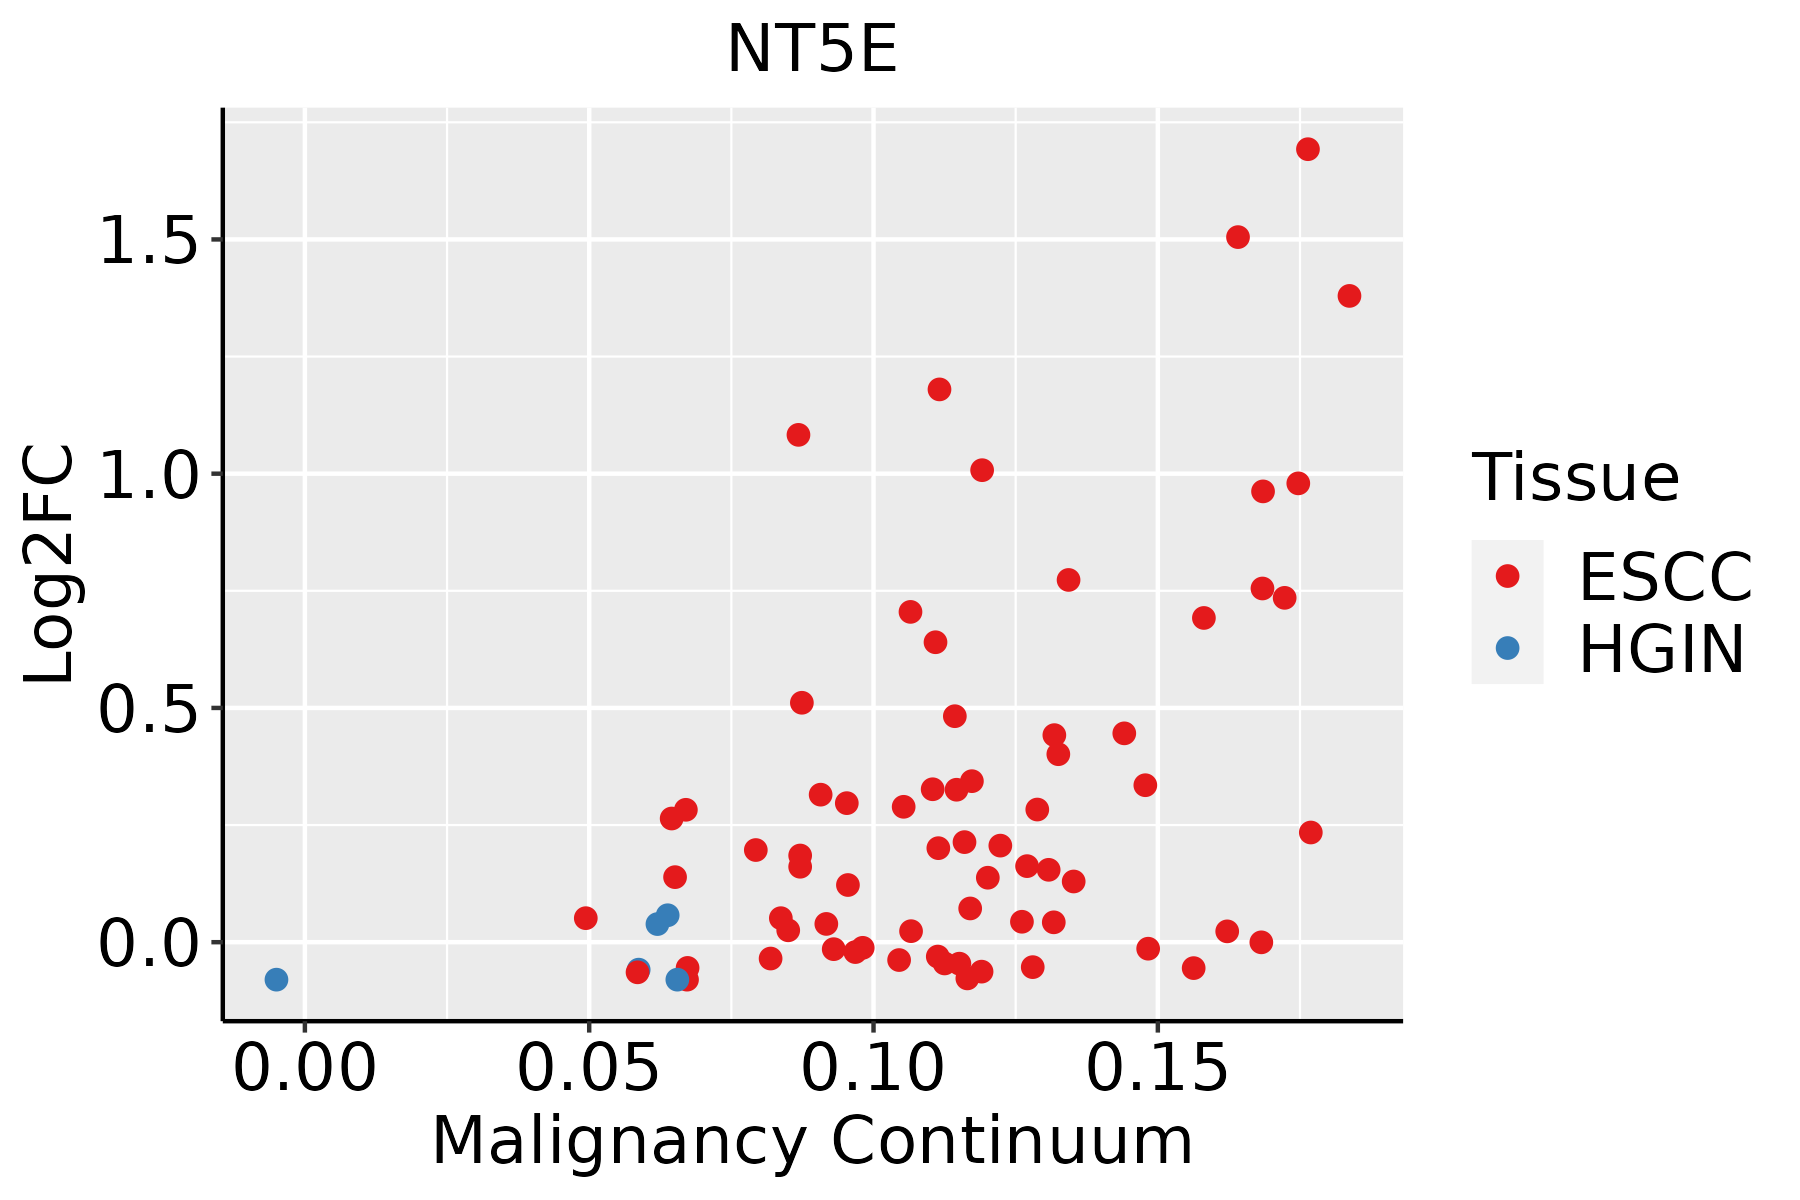 | ESCC: Esophageal squamous cell carcinoma |
| HGIN: High-grade intraepithelial neoplasias | ||
| LGIN: Low-grade intraepithelial neoplasias | ||
| Liver | 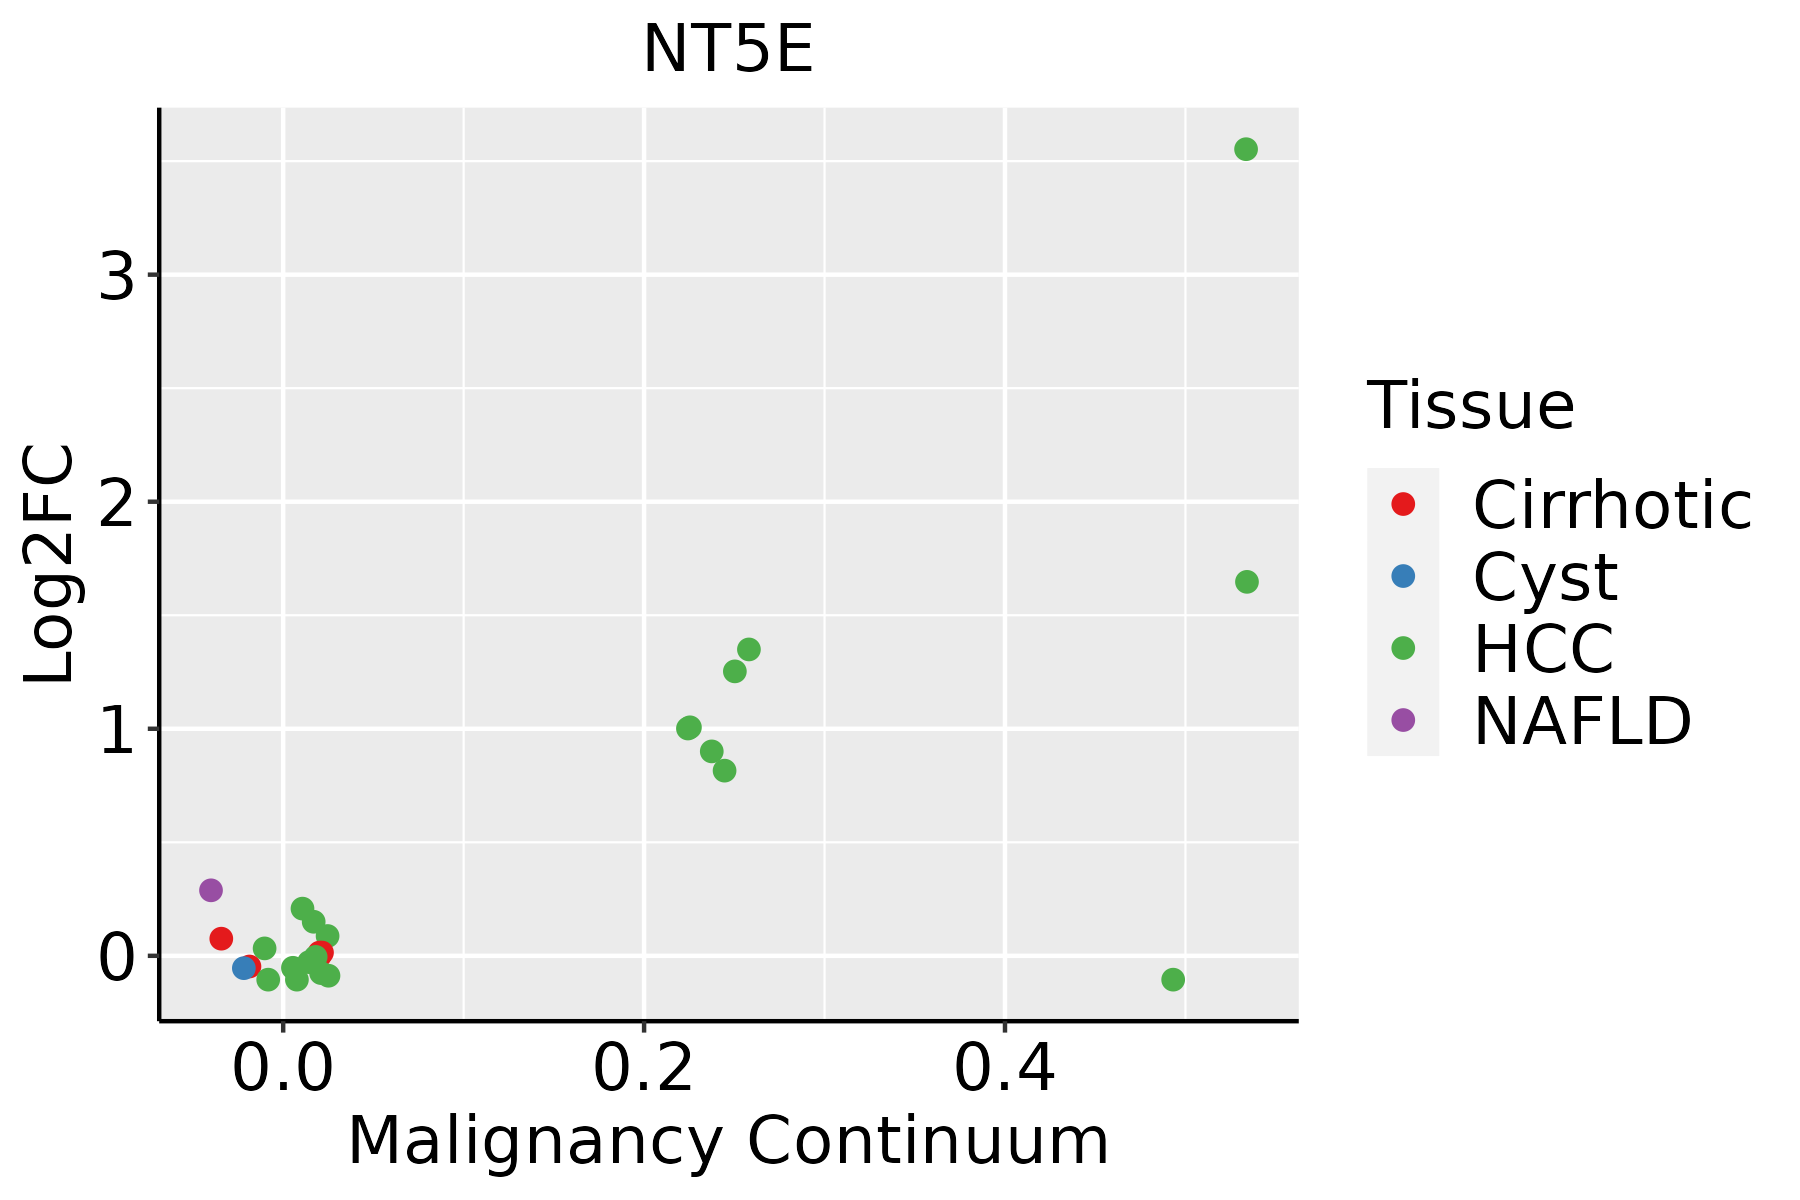 | HCC: Hepatocellular carcinoma |
| NAFLD: Non-alcoholic fatty liver disease | ||
| Oral Cavity | 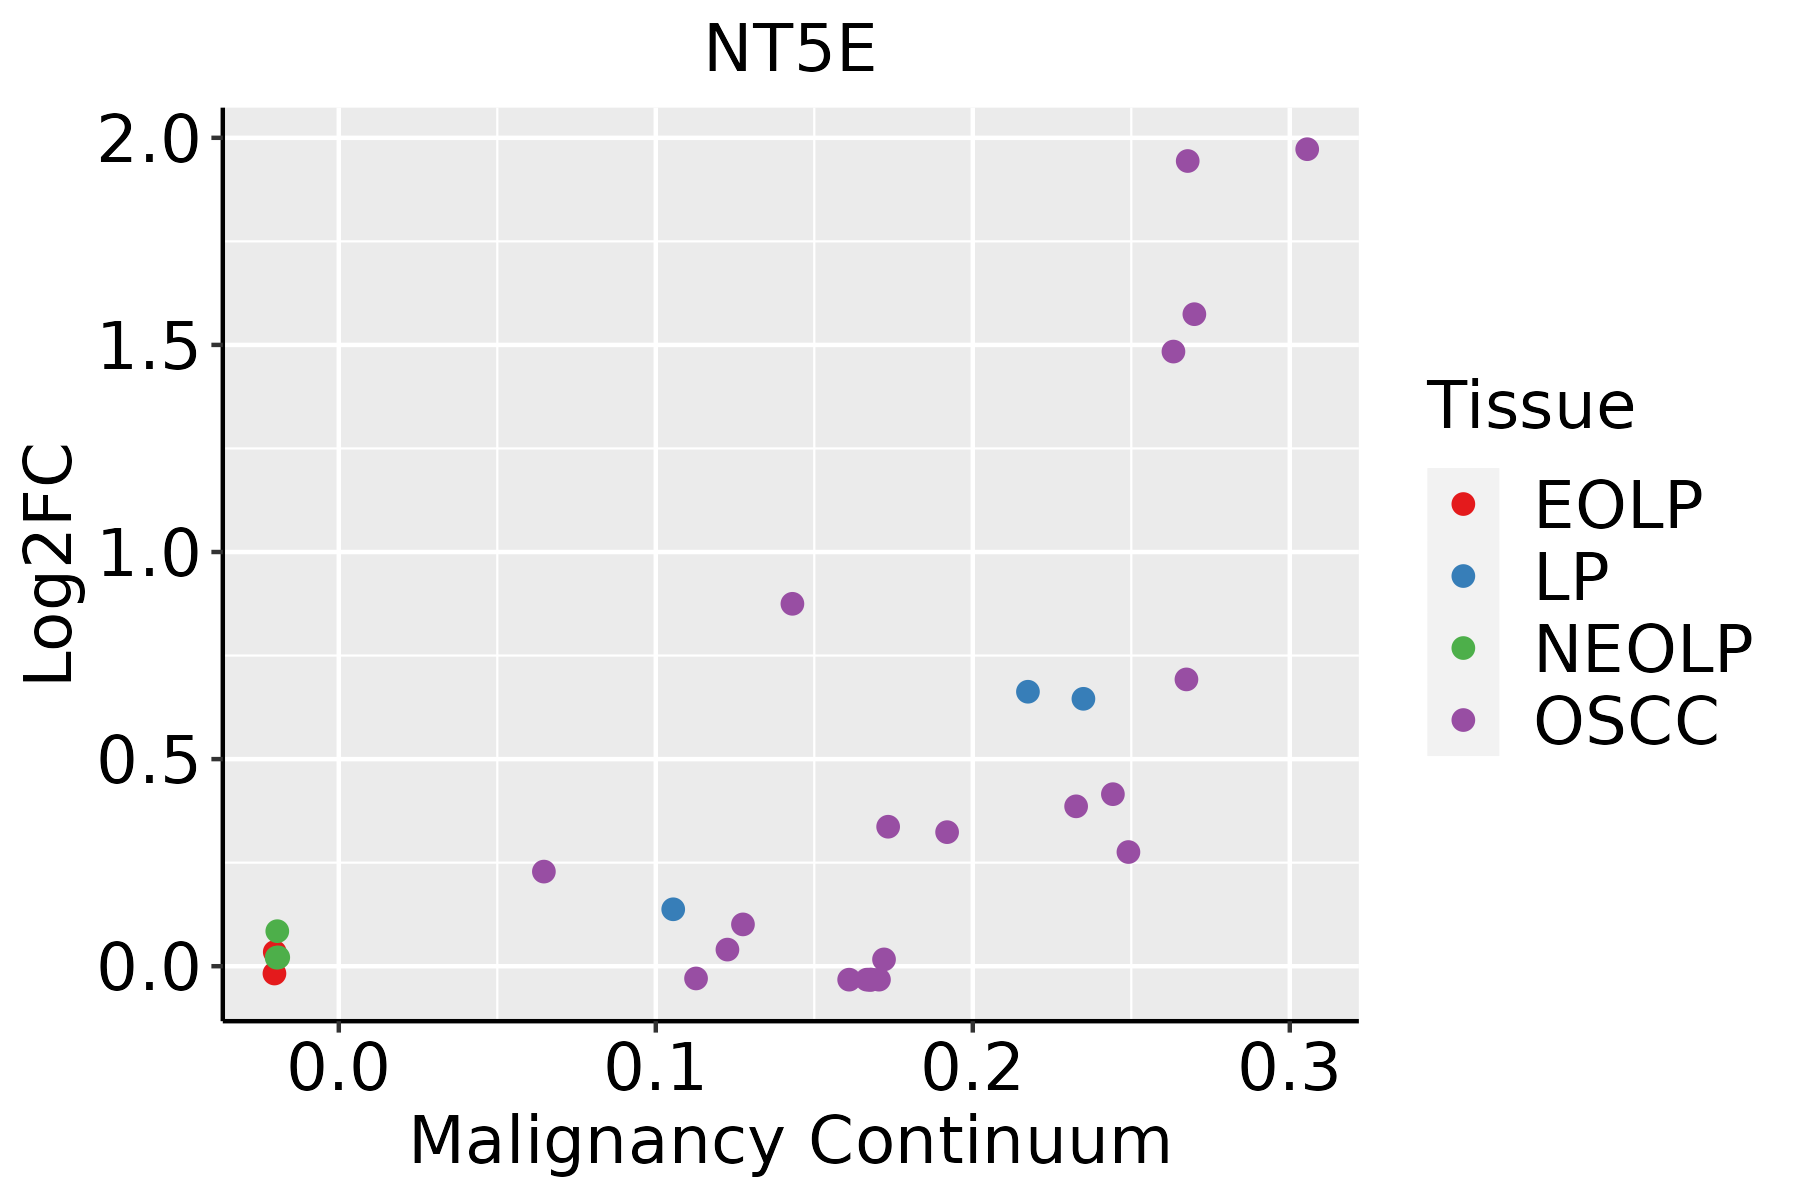 | EOLP: Erosive Oral lichen planus |
| LP: leukoplakia | ||
| NEOLP: Non-erosive oral lichen planus | ||
| OSCC: Oral squamous cell carcinoma | ||
| Thyroid | 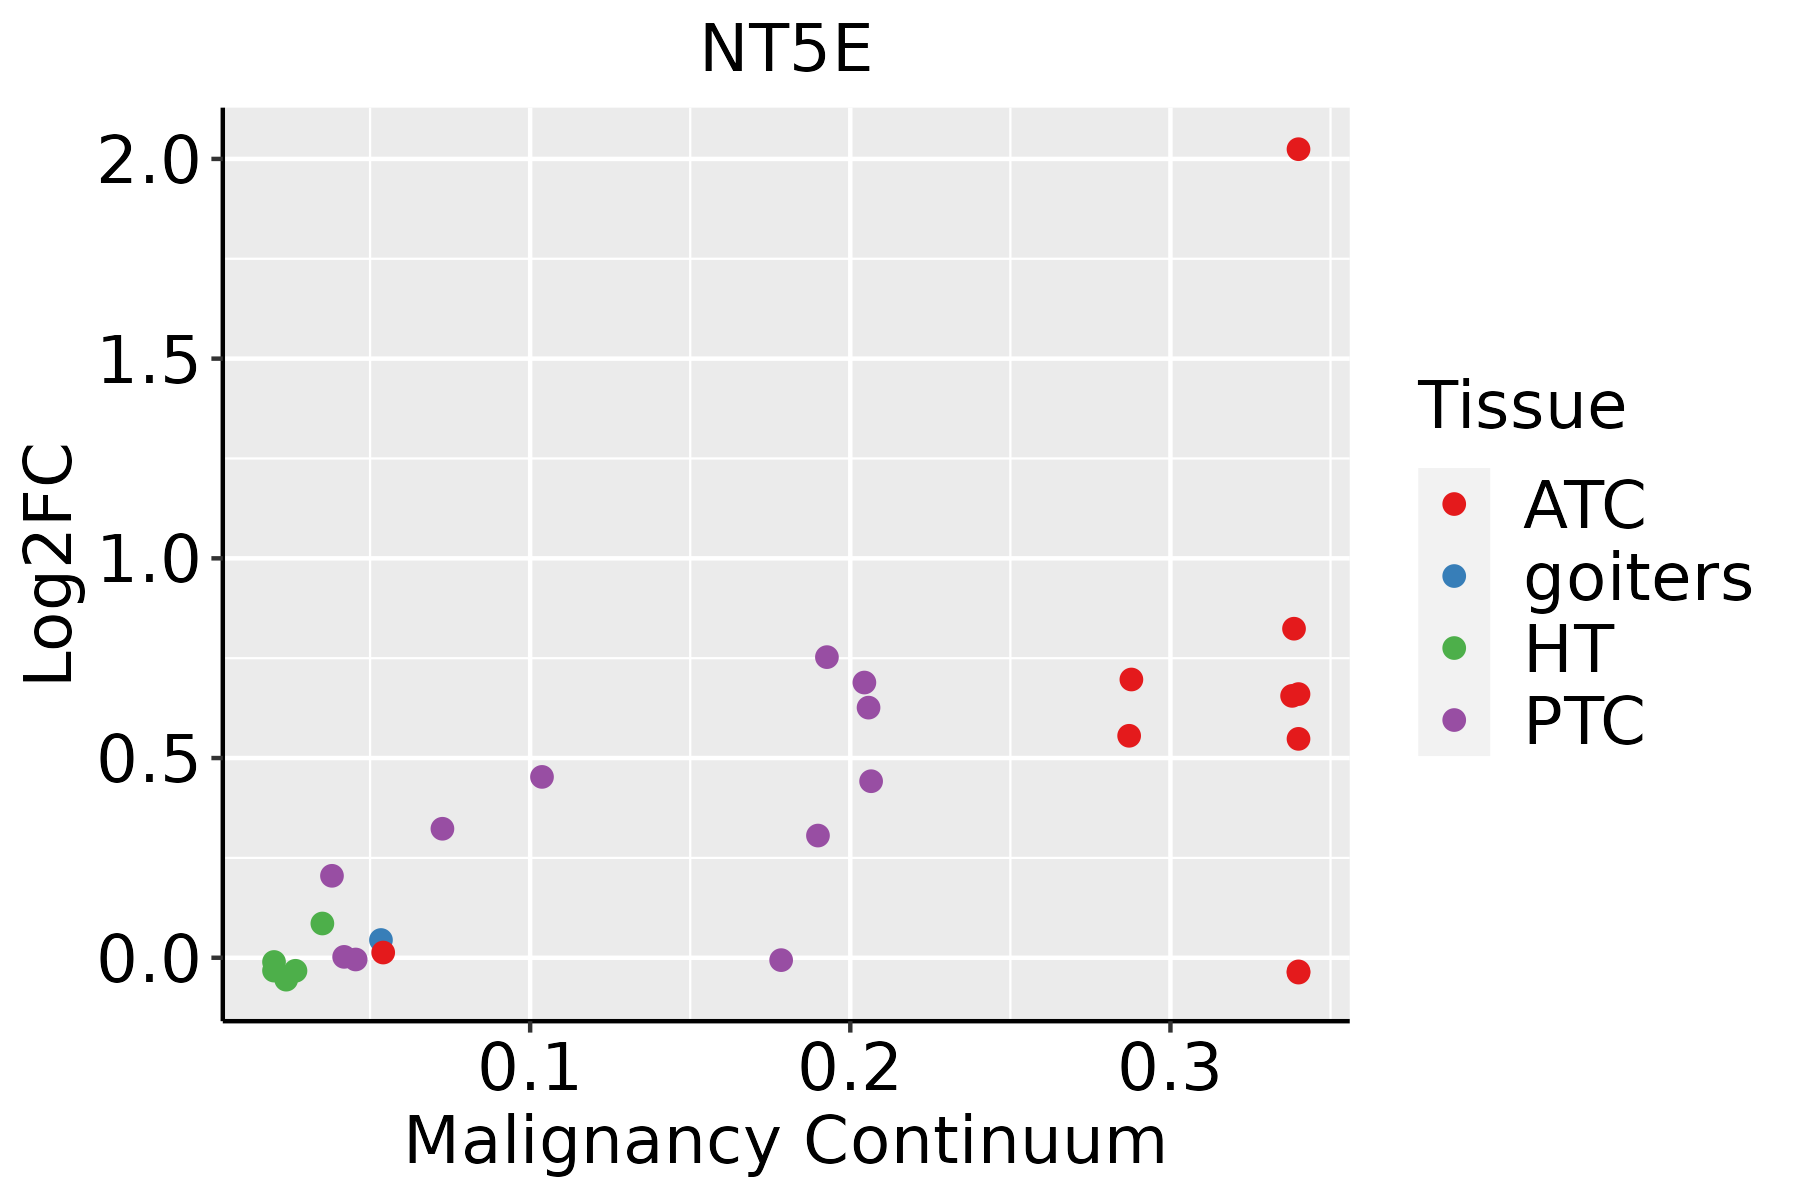 | ATC: Anaplastic thyroid cancer |
| HT: Hashimoto's thyroiditis | ||
| PTC: Papillary thyroid cancer |
| ∗log2FC in expression of this searched gene in stem-like cells from each diseased tissue sample relative to stem-like cells in normal samples in each tissue plotted against the malignancy continuum. Samples are colored based on if they are from different disease stage. |
Top |
Malignant transformation related pathway analysis |
| Find out the enriched GO biological processes and KEGG pathways involved in transition from healthy to precancer to cancer |
| Tissue | Disease Stage | Enriched GO biological Processes |
| Colorectum | AD |  |
| Colorectum | SER |  |
| Colorectum | MSS |  |
| Colorectum | MSI-H |  |
| Colorectum | FAP |  |
| ∗Top 15 enriched GO BP terms are showed in the bar plot of each disease state in each tissue. Each row represents a significant GO biological process which is colored according to the -log10(p.adjust). |
| Page: 1 2 3 4 5 6 7 8 9 |
| GO ID | Tissue | Disease Stage | Description | Gene Ratio | Bg Ratio | pvalue | p.adjust | Count |
| GO:0009150 | Colorectum | AD | purine ribonucleotide metabolic process | 142/3918 | 368/18723 | 4.29e-15 | 1.17e-12 | 142 |
| GO:0006163 | Colorectum | AD | purine nucleotide metabolic process | 149/3918 | 396/18723 | 1.08e-14 | 2.80e-12 | 149 |
| GO:0072521 | Colorectum | AD | purine-containing compound metabolic process | 153/3918 | 416/18723 | 4.34e-14 | 1.01e-11 | 153 |
| GO:0009259 | Colorectum | AD | ribonucleotide metabolic process | 144/3918 | 385/18723 | 5.25e-14 | 1.13e-11 | 144 |
| GO:0019693 | Colorectum | AD | ribose phosphate metabolic process | 145/3918 | 396/18723 | 3.01e-13 | 5.71e-11 | 145 |
| GO:0009117 | Colorectum | AD | nucleotide metabolic process | 168/3918 | 489/18723 | 2.20e-12 | 3.36e-10 | 168 |
| GO:0006753 | Colorectum | AD | nucleoside phosphate metabolic process | 169/3918 | 497/18723 | 4.99e-12 | 6.98e-10 | 169 |
| GO:0044270 | Colorectum | AD | cellular nitrogen compound catabolic process | 147/3918 | 451/18723 | 3.35e-09 | 2.23e-07 | 147 |
| GO:0046700 | Colorectum | AD | heterocycle catabolic process | 145/3918 | 445/18723 | 4.37e-09 | 2.84e-07 | 145 |
| GO:0034655 | Colorectum | AD | nucleobase-containing compound catabolic process | 133/3918 | 407/18723 | 1.56e-08 | 9.12e-07 | 133 |
| GO:0009135 | Colorectum | AD | purine nucleoside diphosphate metabolic process | 47/3918 | 103/18723 | 1.61e-08 | 9.22e-07 | 47 |
| GO:0009179 | Colorectum | AD | purine ribonucleoside diphosphate metabolic process | 47/3918 | 103/18723 | 1.61e-08 | 9.22e-07 | 47 |
| GO:0009185 | Colorectum | AD | ribonucleoside diphosphate metabolic process | 47/3918 | 106/18723 | 4.85e-08 | 2.55e-06 | 47 |
| GO:0019439 | Colorectum | AD | aromatic compound catabolic process | 146/3918 | 467/18723 | 7.48e-08 | 3.84e-06 | 146 |
| GO:1901361 | Colorectum | AD | organic cyclic compound catabolic process | 153/3918 | 495/18723 | 8.23e-08 | 4.18e-06 | 153 |
| GO:0046031 | Colorectum | AD | ADP metabolic process | 41/3918 | 90/18723 | 1.37e-07 | 6.42e-06 | 41 |
| GO:0009132 | Colorectum | AD | nucleoside diphosphate metabolic process | 49/3918 | 124/18723 | 1.75e-06 | 5.31e-05 | 49 |
| GO:0072522 | Colorectum | AD | purine-containing compound biosynthetic process | 68/3918 | 200/18723 | 1.12e-05 | 2.55e-04 | 68 |
| GO:0016311 | Colorectum | AD | dephosphorylation | 123/3918 | 417/18723 | 1.84e-05 | 3.82e-04 | 123 |
| GO:0009126 | Colorectum | AD | purine nucleoside monophosphate metabolic process | 19/3918 | 44/18723 | 7.13e-04 | 7.21e-03 | 19 |
| Page: 1 2 3 4 5 6 7 8 9 10 11 12 13 |
| Pathway ID | Tissue | Disease Stage | Description | Gene Ratio | Bg Ratio | pvalue | p.adjust | qvalue | Count |
| hsa012325 | Esophagus | ESCC | Nucleotide metabolism | 59/4205 | 85/8465 | 1.67e-04 | 6.58e-04 | 3.37e-04 | 59 |
| hsa002405 | Esophagus | ESCC | Pyrimidine metabolism | 41/4205 | 58/8465 | 9.14e-04 | 2.92e-03 | 1.49e-03 | 41 |
| hsa0123212 | Esophagus | ESCC | Nucleotide metabolism | 59/4205 | 85/8465 | 1.67e-04 | 6.58e-04 | 3.37e-04 | 59 |
| hsa0024012 | Esophagus | ESCC | Pyrimidine metabolism | 41/4205 | 58/8465 | 9.14e-04 | 2.92e-03 | 1.49e-03 | 41 |
| hsa002402 | Liver | HCC | Pyrimidine metabolism | 44/4020 | 58/8465 | 9.34e-06 | 7.11e-05 | 3.95e-05 | 44 |
| hsa012322 | Liver | HCC | Nucleotide metabolism | 59/4020 | 85/8465 | 3.30e-05 | 1.88e-04 | 1.04e-04 | 59 |
| hsa002403 | Liver | HCC | Pyrimidine metabolism | 44/4020 | 58/8465 | 9.34e-06 | 7.11e-05 | 3.95e-05 | 44 |
| hsa012323 | Liver | HCC | Nucleotide metabolism | 59/4020 | 85/8465 | 3.30e-05 | 1.88e-04 | 1.04e-04 | 59 |
| hsa012324 | Oral cavity | OSCC | Nucleotide metabolism | 54/3704 | 85/8465 | 1.78e-04 | 5.95e-04 | 3.03e-04 | 54 |
| hsa002404 | Oral cavity | OSCC | Pyrimidine metabolism | 37/3704 | 58/8465 | 1.62e-03 | 4.45e-03 | 2.26e-03 | 37 |
| hsa0123211 | Oral cavity | OSCC | Nucleotide metabolism | 54/3704 | 85/8465 | 1.78e-04 | 5.95e-04 | 3.03e-04 | 54 |
| hsa0024011 | Oral cavity | OSCC | Pyrimidine metabolism | 37/3704 | 58/8465 | 1.62e-03 | 4.45e-03 | 2.26e-03 | 37 |
| hsa0123221 | Oral cavity | LP | Nucleotide metabolism | 42/2418 | 85/8465 | 3.62e-05 | 2.36e-04 | 1.52e-04 | 42 |
| hsa0024021 | Oral cavity | LP | Pyrimidine metabolism | 28/2418 | 58/8465 | 1.12e-03 | 5.02e-03 | 3.24e-03 | 28 |
| hsa0123231 | Oral cavity | LP | Nucleotide metabolism | 42/2418 | 85/8465 | 3.62e-05 | 2.36e-04 | 1.52e-04 | 42 |
| hsa0024031 | Oral cavity | LP | Pyrimidine metabolism | 28/2418 | 58/8465 | 1.12e-03 | 5.02e-03 | 3.24e-03 | 28 |
| Page: 1 |
Top |
Cell-cell communication analysis |
| Identification of potential cell-cell interactions between two cell types and their ligand-receptor pairs for different disease states |
| Ligand | Receptor | LRpair | Pathway | Tissue | Disease Stage |
| Page: 1 |
Top |
Single-cell gene regulatory network inference analysis |
| Find out the significant the regulons (TFs) and the target genes of each regulon across cell types for different disease states |
| TF | Cell Type | Tissue | Disease Stage | Target Gene | RSS | Regulon Activity |
| ∗The dot plots of a searched regulon are shown for all cell subpopulations in each disease state of each tissue based on the regulon specific score inferred using pySCENIC and by calculating the average expression. |
| Page: 1 |
Top |
Somatic mutation of malignant transformation related genes |
| Annotation of somatic variants for genes involved in malignant transformation |
| Hugo Symbol | Variant Class | Variant Classification | dbSNP RS | HGVSc | HGVSp | HGVSp Short | SWISSPROT | BIOTYPE | SIFT | PolyPhen | Tumor Sample Barcode | Tissue | Histology | Sex | Age | Stage | Therapy Types | Drugs | Outcome |
| NT5E | SNV | Missense_Mutation | c.1423N>G | p.Leu475Val | p.L475V | P21589 | protein_coding | tolerated(0.14) | benign(0.065) | TCGA-A8-A075-01 | Breast | breast invasive carcinoma | Female | <65 | I/II | Chemotherapy | epirubicin | CR | |
| NT5E | SNV | Missense_Mutation | c.355G>C | p.Glu119Gln | p.E119Q | P21589 | protein_coding | deleterious(0) | probably_damaging(0.999) | TCGA-AR-A0TX-01 | Breast | breast invasive carcinoma | Female | <65 | I/II | Unknown | Unknown | SD | |
| NT5E | SNV | Missense_Mutation | c.693N>T | p.Gln231His | p.Q231H | P21589 | protein_coding | deleterious(0.01) | probably_damaging(0.942) | TCGA-B6-A1KN-01 | Breast | breast invasive carcinoma | Female | <65 | III/IV | Unknown | Unknown | SD | |
| NT5E | SNV | Missense_Mutation | c.1051N>G | p.Gln351Glu | p.Q351E | P21589 | protein_coding | tolerated(0.75) | benign(0.013) | TCGA-E2-A10C-01 | Breast | breast invasive carcinoma | Female | <65 | I/II | Chemotherapy | cytoxan | SD | |
| NT5E | insertion | Frame_Shift_Ins | novel | c.1422_1423insTGGGTTGC | p.Leu475TrpfsTer24 | p.L475Wfs*24 | P21589 | protein_coding | TCGA-AR-A0U0-01 | Breast | breast invasive carcinoma | Female | >=65 | I/II | Unknown | Unknown | SD | ||
| NT5E | insertion | Frame_Shift_Ins | novel | c.380_381insACCTAATCATTTCACCATGGAGTTCTTCCCCAGATGTGAAACTGCTG | p.Ile128ProfsTer29 | p.I128Pfs*29 | P21589 | protein_coding | TCGA-B6-A0IA-01 | Breast | breast invasive carcinoma | Female | <65 | I/II | Unknown | Unknown | SD | ||
| NT5E | insertion | Frame_Shift_Ins | novel | c.1633_1634insATGCTGGACCTGTCATTTTAGCTACTTATTCCAA | p.Arg545HisfsTer50 | p.R545Hfs*50 | P21589 | protein_coding | TCGA-BH-A0EE-01 | Breast | breast invasive carcinoma | Female | >=65 | I/II | Chemotherapy | docetaxel | SD | ||
| NT5E | SNV | Missense_Mutation | c.1132N>A | p.Glu378Lys | p.E378K | P21589 | protein_coding | tolerated(0.26) | benign(0.068) | TCGA-LP-A4AU-01 | Cervix | cervical & endocervical cancer | Female | <65 | III/IV | Chemotherapy | cisplatin | CR | |
| NT5E | SNV | Missense_Mutation | c.1061G>A | p.Arg354His | p.R354H | P21589 | protein_coding | deleterious(0) | probably_damaging(0.995) | TCGA-VS-A8EC-01 | Cervix | cervical & endocervical cancer | Female | <65 | III/IV | Chemotherapy | carboplatin | CR | |
| NT5E | SNV | Missense_Mutation | rs775412849 | c.817N>T | p.Arg273Trp | p.R273W | P21589 | protein_coding | deleterious(0) | possibly_damaging(0.836) | TCGA-AA-A01P-01 | Colorectum | colon adenocarcinoma | Female | >=65 | III/IV | Unknown | Unknown | PD |
| Page: 1 2 3 4 5 |
Top |
Related drugs of malignant transformation related genes |
| Identification of chemicals and drugs interact with genes involved in malignant transfromation |
| (DGIdb 4.0) |
| Entrez ID | Symbol | Category | Interaction Types | Drug Claim Name | Drug Name | PMIDs |
| 4907 | NT5E | ENZYME, EXTERNAL SIDE OF PLASMA MEMBRANE, CELL SURFACE, DRUGGABLE GENOME | inhibitor | 404859154 | ||
| 4907 | NT5E | ENZYME, EXTERNAL SIDE OF PLASMA MEMBRANE, CELL SURFACE, DRUGGABLE GENOME | PMID28870136-Compound-64 | |||
| 4907 | NT5E | ENZYME, EXTERNAL SIDE OF PLASMA MEMBRANE, CELL SURFACE, DRUGGABLE GENOME | PMID28870136-Compound-44 | |||
| 4907 | NT5E | ENZYME, EXTERNAL SIDE OF PLASMA MEMBRANE, CELL SURFACE, DRUGGABLE GENOME | PMID28870136-Compound-50 | |||
| 4907 | NT5E | ENZYME, EXTERNAL SIDE OF PLASMA MEMBRANE, CELL SURFACE, DRUGGABLE GENOME | INOSITOL | INOSITOL | 2847980 | |
| 4907 | NT5E | ENZYME, EXTERNAL SIDE OF PLASMA MEMBRANE, CELL SURFACE, DRUGGABLE GENOME | PMID28870136-Compound-58 | |||
| 4907 | NT5E | ENZYME, EXTERNAL SIDE OF PLASMA MEMBRANE, CELL SURFACE, DRUGGABLE GENOME | PMID28870136-Compound-57 | |||
| 4907 | NT5E | ENZYME, EXTERNAL SIDE OF PLASMA MEMBRANE, CELL SURFACE, DRUGGABLE GENOME | PMID28870136-Compound-38 | |||
| 4907 | NT5E | ENZYME, EXTERNAL SIDE OF PLASMA MEMBRANE, CELL SURFACE, DRUGGABLE GENOME | PMID28870136-Compound-42 | |||
| 4907 | NT5E | ENZYME, EXTERNAL SIDE OF PLASMA MEMBRANE, CELL SURFACE, DRUGGABLE GENOME | PMID28870136-Compound-51 |
| Page: 1 2 3 4 5 6 |

Copyright 2023-Present -The University of Texas Health Science Center at Houston |