
|
|||||
|
 | |
| |
| |
| |
| |
| |
|
Gene: NT5C3B |
Gene summary for NT5C3B |
| Gene information | Species | Human | Gene symbol | NT5C3B | Gene ID | 115024 |
| Gene name | 5'-nucleotidase, cytosolic IIIB | |
| Gene Alias | NT5C3L | |
| Cytomap | 17q21.2 | |
| Gene Type | protein-coding | GO ID | GO:0000288 | UniProtAcc | Q969T7 |
Top |
Malignant transformation analysis |
| Identification of the aberrant gene expression in precancerous and cancerous lesions by comparing the gene expression of stem-like cells in diseased tissues with normal stem cells |
| Entrez ID | Symbol | Replicates | Species | Organ | Tissue | Adj P-value | Log2FC | Malignancy |
| 115024 | NT5C3B | LZE2T | Human | Esophagus | ESCC | 4.45e-03 | 7.31e-01 | 0.082 |
| 115024 | NT5C3B | LZE4T | Human | Esophagus | ESCC | 8.64e-17 | 4.06e-01 | 0.0811 |
| 115024 | NT5C3B | LZE8T | Human | Esophagus | ESCC | 1.39e-02 | 4.25e-02 | 0.067 |
| 115024 | NT5C3B | LZE20T | Human | Esophagus | ESCC | 4.95e-02 | 2.86e-02 | 0.0662 |
| 115024 | NT5C3B | LZE22D1 | Human | Esophagus | HGIN | 4.95e-04 | 1.13e-01 | 0.0595 |
| 115024 | NT5C3B | LZE24T | Human | Esophagus | ESCC | 9.36e-16 | 4.84e-01 | 0.0596 |
| 115024 | NT5C3B | P1T-E | Human | Esophagus | ESCC | 5.28e-03 | 3.86e-01 | 0.0875 |
| 115024 | NT5C3B | P2T-E | Human | Esophagus | ESCC | 1.08e-35 | 7.01e-01 | 0.1177 |
| 115024 | NT5C3B | P4T-E | Human | Esophagus | ESCC | 2.92e-34 | 9.38e-01 | 0.1323 |
| 115024 | NT5C3B | P5T-E | Human | Esophagus | ESCC | 9.69e-39 | 9.09e-01 | 0.1327 |
| 115024 | NT5C3B | P8T-E | Human | Esophagus | ESCC | 7.00e-33 | 5.46e-01 | 0.0889 |
| 115024 | NT5C3B | P9T-E | Human | Esophagus | ESCC | 9.23e-21 | 6.00e-01 | 0.1131 |
| 115024 | NT5C3B | P10T-E | Human | Esophagus | ESCC | 3.18e-22 | 4.28e-01 | 0.116 |
| 115024 | NT5C3B | P11T-E | Human | Esophagus | ESCC | 4.14e-17 | 9.91e-01 | 0.1426 |
| 115024 | NT5C3B | P12T-E | Human | Esophagus | ESCC | 2.51e-59 | 1.12e+00 | 0.1122 |
| 115024 | NT5C3B | P15T-E | Human | Esophagus | ESCC | 8.72e-29 | 7.90e-01 | 0.1149 |
| 115024 | NT5C3B | P16T-E | Human | Esophagus | ESCC | 1.46e-36 | 7.78e-01 | 0.1153 |
| 115024 | NT5C3B | P17T-E | Human | Esophagus | ESCC | 6.77e-05 | 4.10e-01 | 0.1278 |
| 115024 | NT5C3B | P19T-E | Human | Esophagus | ESCC | 3.35e-10 | 9.51e-01 | 0.1662 |
| 115024 | NT5C3B | P20T-E | Human | Esophagus | ESCC | 5.32e-31 | 8.96e-01 | 0.1124 |
| Page: 1 2 3 4 5 6 |
| Tissue | Expression Dynamics | Abbreviation |
| Esophagus |  | ESCC: Esophageal squamous cell carcinoma |
| HGIN: High-grade intraepithelial neoplasias | ||
| LGIN: Low-grade intraepithelial neoplasias | ||
| Liver | 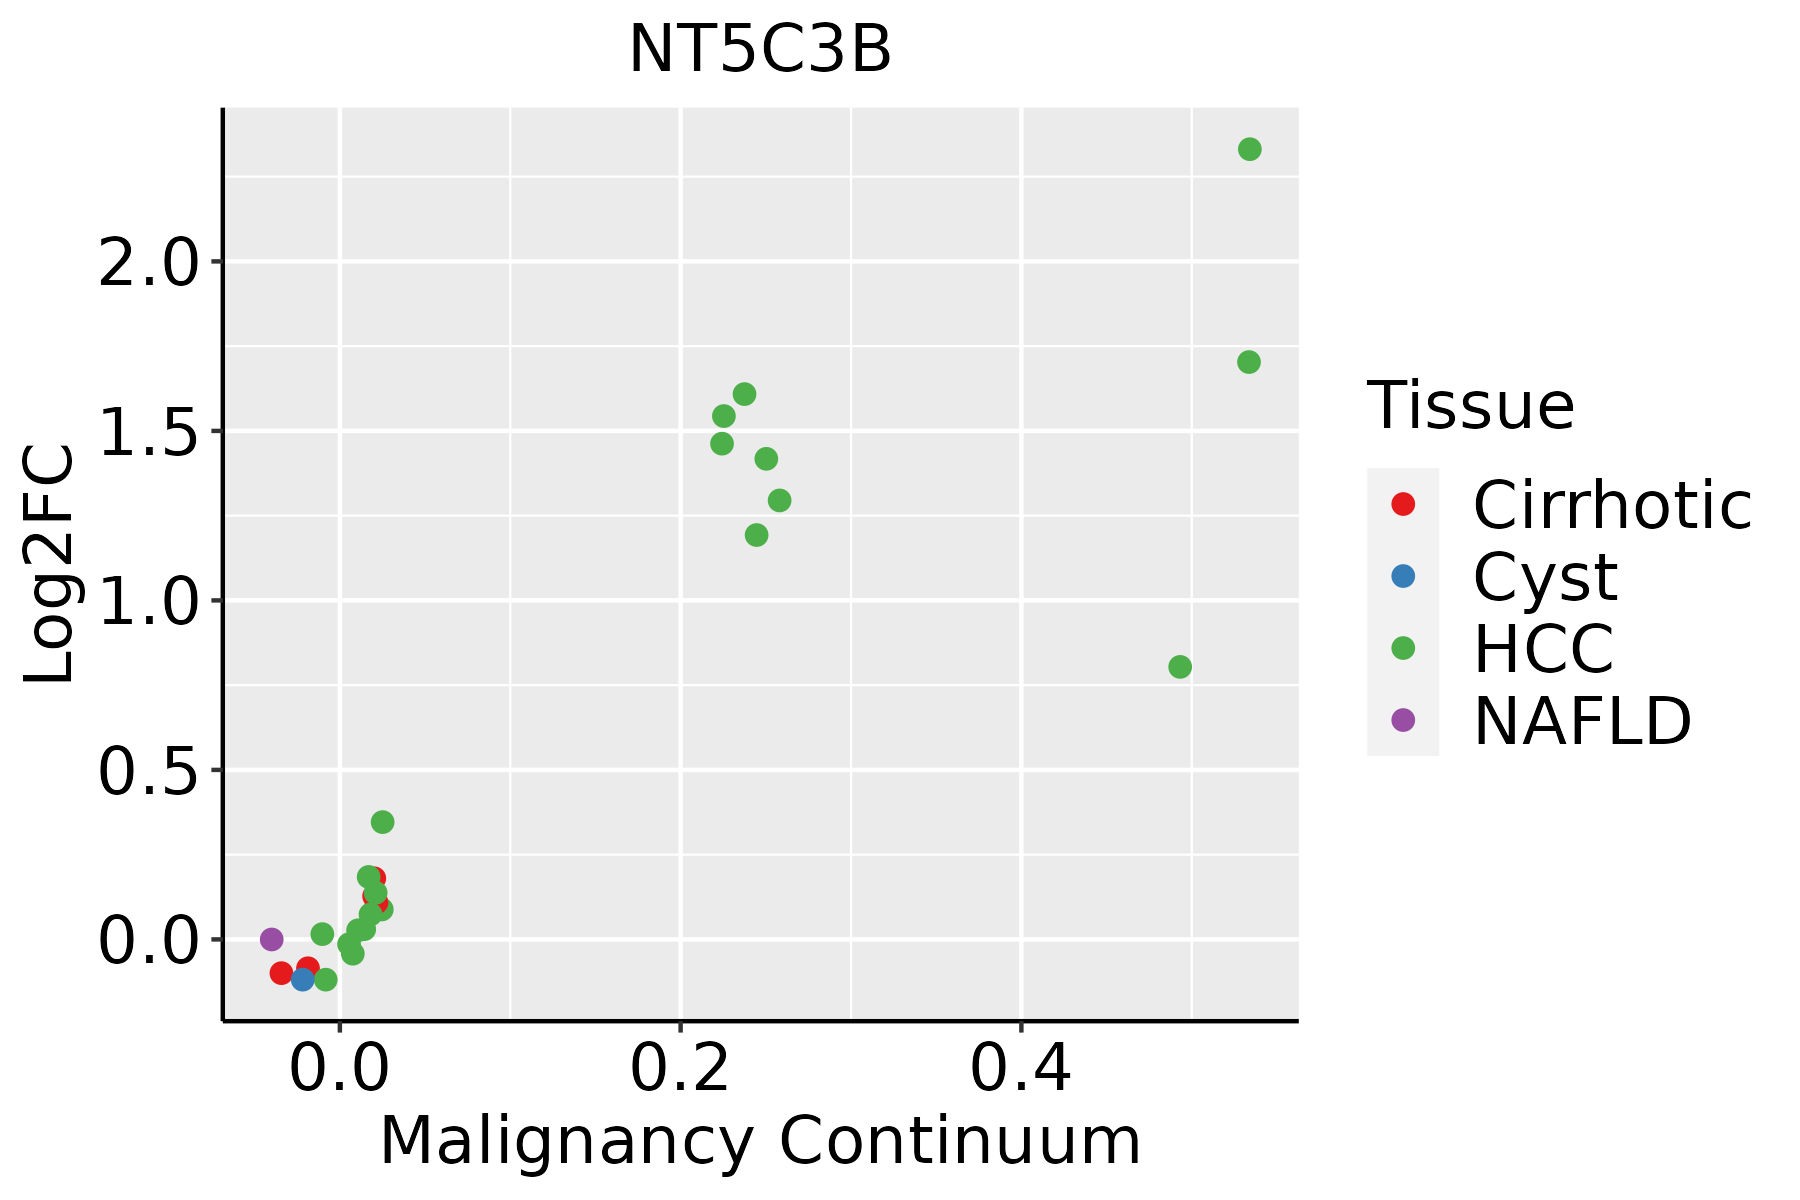 | HCC: Hepatocellular carcinoma |
| NAFLD: Non-alcoholic fatty liver disease | ||
| Oral Cavity |  | EOLP: Erosive Oral lichen planus |
| LP: leukoplakia | ||
| NEOLP: Non-erosive oral lichen planus | ||
| OSCC: Oral squamous cell carcinoma | ||
| Skin | 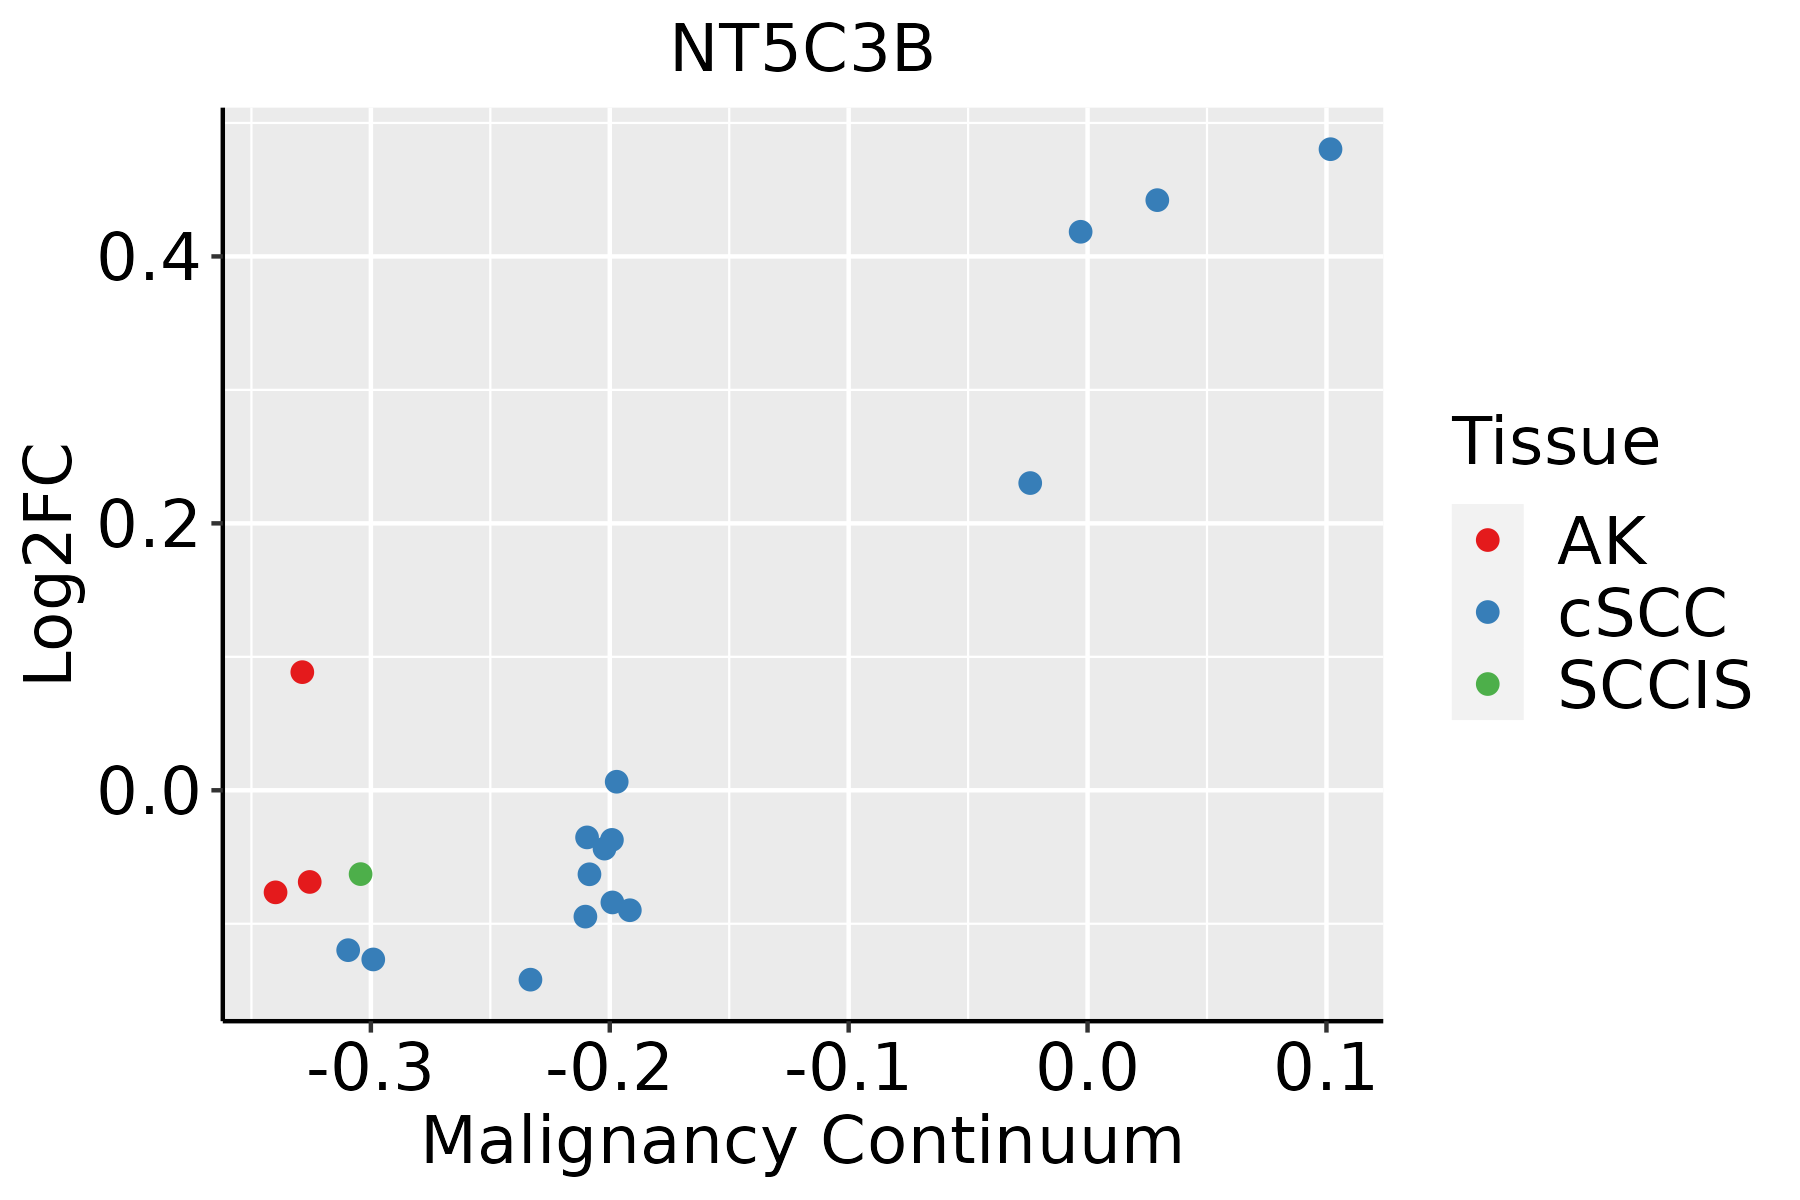 | AK: Actinic keratosis |
| cSCC: Cutaneous squamous cell carcinoma | ||
| SCCIS:squamous cell carcinoma in situ | ||
| Thyroid | 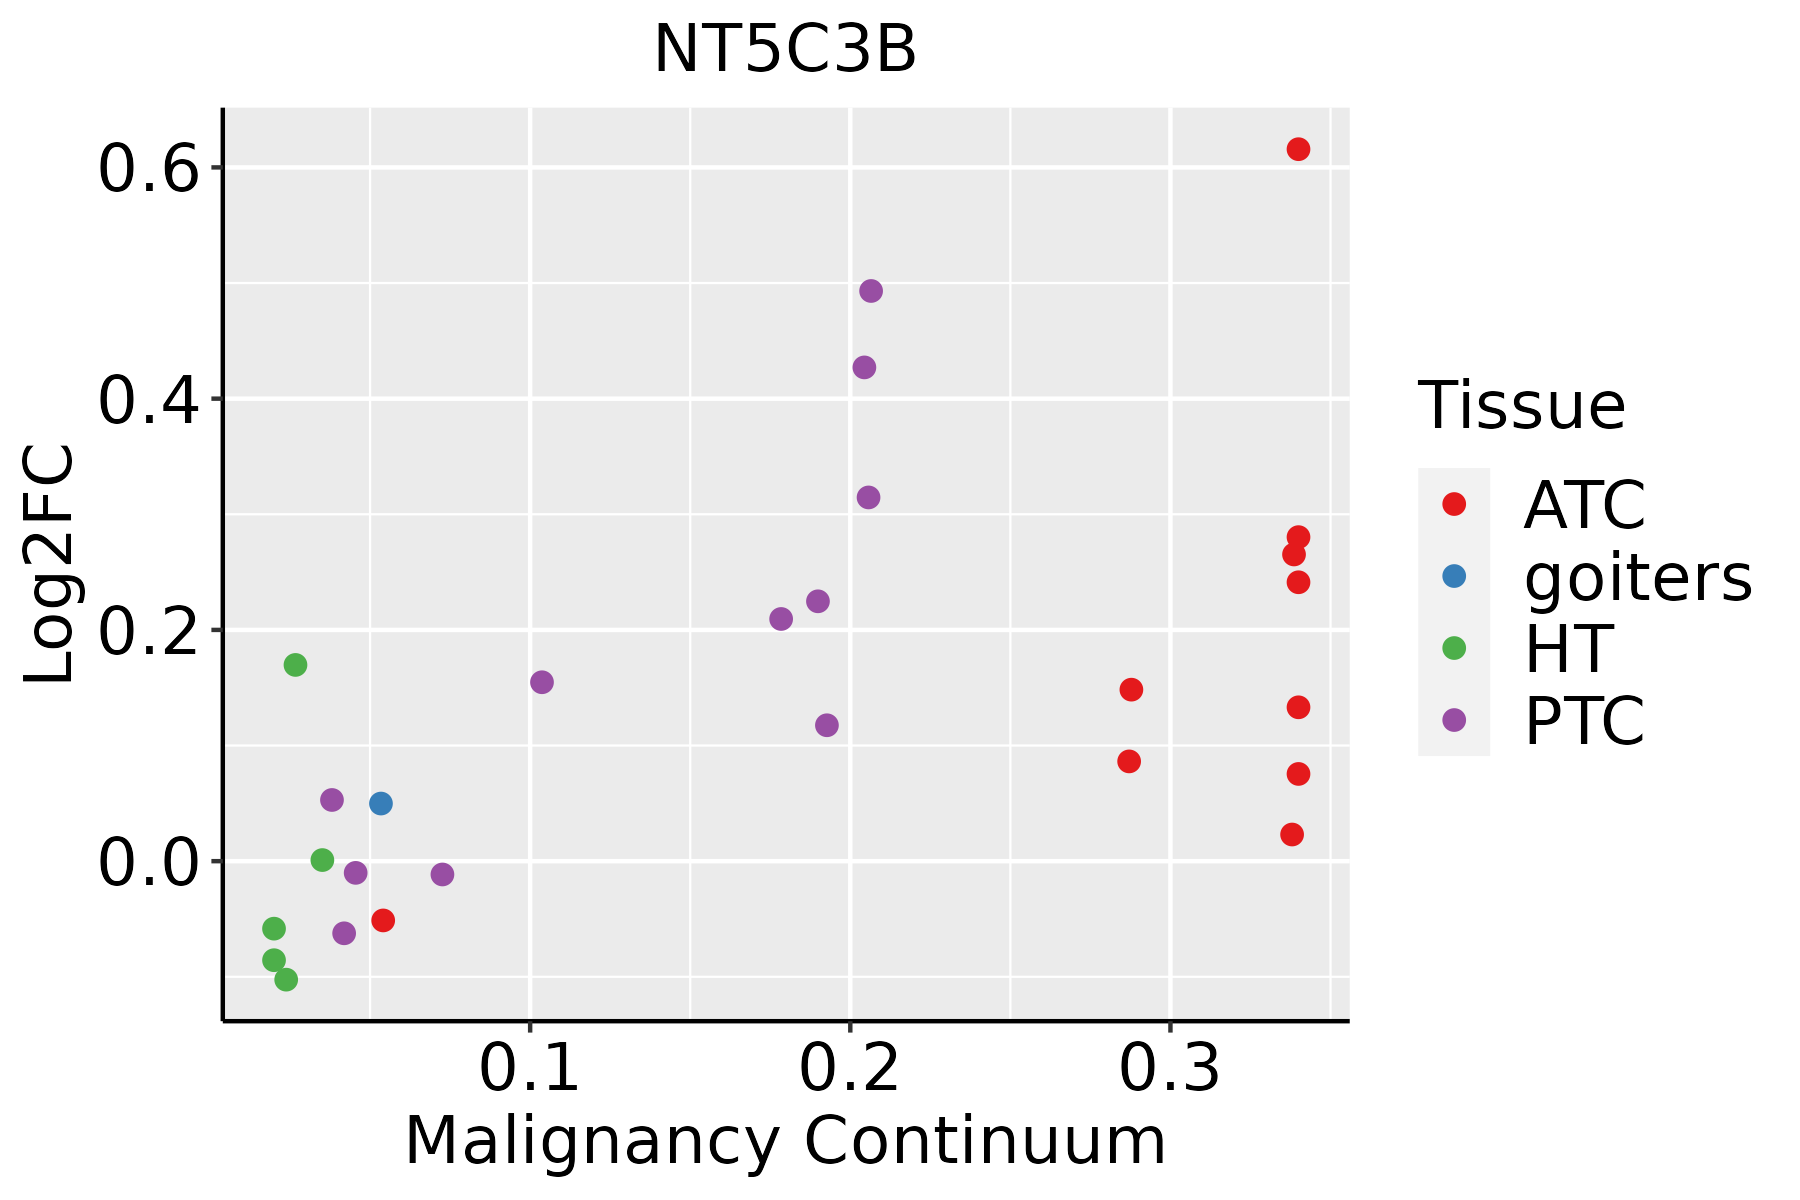 | ATC: Anaplastic thyroid cancer |
| HT: Hashimoto's thyroiditis | ||
| PTC: Papillary thyroid cancer |
| ∗log2FC in expression of this searched gene in stem-like cells from each diseased tissue sample relative to stem-like cells in normal samples in each tissue plotted against the malignancy continuum. Samples are colored based on if they are from different disease stage. |
Top |
Malignant transformation related pathway analysis |
| Find out the enriched GO biological processes and KEGG pathways involved in transition from healthy to precancer to cancer |
| Tissue | Disease Stage | Enriched GO biological Processes |
| Colorectum | AD |  |
| Colorectum | SER |  |
| Colorectum | MSS |  |
| Colorectum | MSI-H |  |
| Colorectum | FAP |  |
| ∗Top 15 enriched GO BP terms are showed in the bar plot of each disease state in each tissue. Each row represents a significant GO biological process which is colored according to the -log10(p.adjust). |
| Page: 1 2 3 4 5 6 7 8 9 |
| GO ID | Tissue | Disease Stage | Description | Gene Ratio | Bg Ratio | pvalue | p.adjust | Count |
| GO:000641727 | Esophagus | HGIN | regulation of translation | 139/2587 | 468/18723 | 1.46e-19 | 7.98e-17 | 139 |
| GO:190331120 | Esophagus | HGIN | regulation of mRNA metabolic process | 91/2587 | 288/18723 | 5.06e-15 | 9.78e-13 | 91 |
| GO:000989626 | Esophagus | HGIN | positive regulation of catabolic process | 126/2587 | 492/18723 | 1.46e-12 | 2.09e-10 | 126 |
| GO:003133126 | Esophagus | HGIN | positive regulation of cellular catabolic process | 112/2587 | 427/18723 | 5.15e-12 | 6.72e-10 | 112 |
| GO:000640120 | Esophagus | HGIN | RNA catabolic process | 77/2587 | 278/18723 | 7.63e-10 | 6.36e-08 | 77 |
| GO:000640220 | Esophagus | HGIN | mRNA catabolic process | 67/2587 | 232/18723 | 1.47e-09 | 1.13e-07 | 67 |
| GO:000095617 | Esophagus | HGIN | nuclear-transcribed mRNA catabolic process | 40/2587 | 112/18723 | 4.44e-09 | 3.03e-07 | 40 |
| GO:003465519 | Esophagus | HGIN | nucleobase-containing compound catabolic process | 98/2587 | 407/18723 | 1.44e-08 | 8.94e-07 | 98 |
| GO:004670017 | Esophagus | HGIN | heterocycle catabolic process | 103/2587 | 445/18723 | 5.44e-08 | 2.99e-06 | 103 |
| GO:004427018 | Esophagus | HGIN | cellular nitrogen compound catabolic process | 103/2587 | 451/18723 | 1.10e-07 | 5.56e-06 | 103 |
| GO:001943917 | Esophagus | HGIN | aromatic compound catabolic process | 105/2587 | 467/18723 | 1.89e-07 | 9.31e-06 | 105 |
| GO:190331310 | Esophagus | HGIN | positive regulation of mRNA metabolic process | 38/2587 | 118/18723 | 2.46e-07 | 1.16e-05 | 38 |
| GO:190136117 | Esophagus | HGIN | organic cyclic compound catabolic process | 106/2587 | 495/18723 | 1.94e-06 | 7.13e-05 | 106 |
| GO:00342496 | Esophagus | HGIN | negative regulation of cellular amide metabolic process | 66/2587 | 273/18723 | 2.74e-06 | 9.60e-05 | 66 |
| GO:00171486 | Esophagus | HGIN | negative regulation of translation | 59/2587 | 245/18723 | 1.03e-05 | 2.96e-04 | 59 |
| GO:006101318 | Esophagus | HGIN | regulation of mRNA catabolic process | 43/2587 | 166/18723 | 2.48e-05 | 6.53e-04 | 43 |
| GO:000028810 | Esophagus | HGIN | nuclear-transcribed mRNA catabolic process, deadenylation-dependent decay | 19/2587 | 56/18723 | 1.10e-04 | 2.33e-03 | 19 |
| GO:006101410 | Esophagus | HGIN | positive regulation of mRNA catabolic process | 24/2587 | 87/18723 | 5.46e-04 | 7.73e-03 | 24 |
| GO:004348818 | Esophagus | HGIN | regulation of mRNA stability | 37/2587 | 158/18723 | 7.53e-04 | 9.97e-03 | 37 |
| GO:004348718 | Esophagus | HGIN | regulation of RNA stability | 39/2587 | 170/18723 | 8.42e-04 | 1.09e-02 | 39 |
| Page: 1 2 3 4 5 6 7 8 9 10 11 12 |
| Pathway ID | Tissue | Disease Stage | Description | Gene Ratio | Bg Ratio | pvalue | p.adjust | qvalue | Count |
| hsa012325 | Esophagus | ESCC | Nucleotide metabolism | 59/4205 | 85/8465 | 1.67e-04 | 6.58e-04 | 3.37e-04 | 59 |
| hsa002405 | Esophagus | ESCC | Pyrimidine metabolism | 41/4205 | 58/8465 | 9.14e-04 | 2.92e-03 | 1.49e-03 | 41 |
| hsa0123212 | Esophagus | ESCC | Nucleotide metabolism | 59/4205 | 85/8465 | 1.67e-04 | 6.58e-04 | 3.37e-04 | 59 |
| hsa0024012 | Esophagus | ESCC | Pyrimidine metabolism | 41/4205 | 58/8465 | 9.14e-04 | 2.92e-03 | 1.49e-03 | 41 |
| hsa01232 | Liver | Cirrhotic | Nucleotide metabolism | 39/2530 | 85/8465 | 1.27e-03 | 6.73e-03 | 4.15e-03 | 39 |
| hsa00240 | Liver | Cirrhotic | Pyrimidine metabolism | 27/2530 | 58/8465 | 5.31e-03 | 1.88e-02 | 1.16e-02 | 27 |
| hsa012321 | Liver | Cirrhotic | Nucleotide metabolism | 39/2530 | 85/8465 | 1.27e-03 | 6.73e-03 | 4.15e-03 | 39 |
| hsa002401 | Liver | Cirrhotic | Pyrimidine metabolism | 27/2530 | 58/8465 | 5.31e-03 | 1.88e-02 | 1.16e-02 | 27 |
| hsa002402 | Liver | HCC | Pyrimidine metabolism | 44/4020 | 58/8465 | 9.34e-06 | 7.11e-05 | 3.95e-05 | 44 |
| hsa012322 | Liver | HCC | Nucleotide metabolism | 59/4020 | 85/8465 | 3.30e-05 | 1.88e-04 | 1.04e-04 | 59 |
| hsa002403 | Liver | HCC | Pyrimidine metabolism | 44/4020 | 58/8465 | 9.34e-06 | 7.11e-05 | 3.95e-05 | 44 |
| hsa012323 | Liver | HCC | Nucleotide metabolism | 59/4020 | 85/8465 | 3.30e-05 | 1.88e-04 | 1.04e-04 | 59 |
| hsa012324 | Oral cavity | OSCC | Nucleotide metabolism | 54/3704 | 85/8465 | 1.78e-04 | 5.95e-04 | 3.03e-04 | 54 |
| hsa002404 | Oral cavity | OSCC | Pyrimidine metabolism | 37/3704 | 58/8465 | 1.62e-03 | 4.45e-03 | 2.26e-03 | 37 |
| hsa0123211 | Oral cavity | OSCC | Nucleotide metabolism | 54/3704 | 85/8465 | 1.78e-04 | 5.95e-04 | 3.03e-04 | 54 |
| hsa0024011 | Oral cavity | OSCC | Pyrimidine metabolism | 37/3704 | 58/8465 | 1.62e-03 | 4.45e-03 | 2.26e-03 | 37 |
| hsa0123221 | Oral cavity | LP | Nucleotide metabolism | 42/2418 | 85/8465 | 3.62e-05 | 2.36e-04 | 1.52e-04 | 42 |
| hsa0024021 | Oral cavity | LP | Pyrimidine metabolism | 28/2418 | 58/8465 | 1.12e-03 | 5.02e-03 | 3.24e-03 | 28 |
| hsa0123231 | Oral cavity | LP | Nucleotide metabolism | 42/2418 | 85/8465 | 3.62e-05 | 2.36e-04 | 1.52e-04 | 42 |
| hsa0024031 | Oral cavity | LP | Pyrimidine metabolism | 28/2418 | 58/8465 | 1.12e-03 | 5.02e-03 | 3.24e-03 | 28 |
| Page: 1 |
Top |
Cell-cell communication analysis |
| Identification of potential cell-cell interactions between two cell types and their ligand-receptor pairs for different disease states |
| Ligand | Receptor | LRpair | Pathway | Tissue | Disease Stage |
| Page: 1 |
Top |
Single-cell gene regulatory network inference analysis |
| Find out the significant the regulons (TFs) and the target genes of each regulon across cell types for different disease states |
| TF | Cell Type | Tissue | Disease Stage | Target Gene | RSS | Regulon Activity |
| ∗The dot plots of a searched regulon are shown for all cell subpopulations in each disease state of each tissue based on the regulon specific score inferred using pySCENIC and by calculating the average expression. |
| Page: 1 |
Top |
Somatic mutation of malignant transformation related genes |
| Annotation of somatic variants for genes involved in malignant transformation |
| Hugo Symbol | Variant Class | Variant Classification | dbSNP RS | HGVSc | HGVSp | HGVSp Short | SWISSPROT | BIOTYPE | SIFT | PolyPhen | Tumor Sample Barcode | Tissue | Histology | Sex | Age | Stage | Therapy Types | Drugs | Outcome |
| NT5C3B | SNV | Missense_Mutation | rs781909203 | c.310N>C | p.Glu104Gln | p.E104Q | Q969T7 | protein_coding | deleterious(0.02) | benign(0.03) | TCGA-A8-A06X-01 | Breast | breast invasive carcinoma | Female | >=65 | I/II | Unknown | Unknown | SD |
| NT5C3B | SNV | Missense_Mutation | c.310G>A | p.Glu104Lys | p.E104K | Q969T7 | protein_coding | deleterious(0.01) | benign(0.031) | TCGA-B6-A2IU-01 | Breast | breast invasive carcinoma | Female | <65 | I/II | Unknown | Unknown | PD | |
| NT5C3B | insertion | Nonsense_Mutation | novel | c.270_271insTGGTGTTCTTCATGGTGACTGGGAGTTGGCT | p.Pro91TrpfsTer6 | p.P91Wfs*6 | Q969T7 | protein_coding | TCGA-A8-A09B-01 | Breast | breast invasive carcinoma | Female | <65 | III/IV | Chemotherapy | 5-fluorouracil | SD | ||
| NT5C3B | SNV | Missense_Mutation | c.164N>A | p.Arg55Gln | p.R55Q | Q969T7 | protein_coding | deleterious(0.02) | possibly_damaging(0.624) | TCGA-C5-A3HE-01 | Cervix | cervical & endocervical cancer | Female | <65 | I/II | Unknown | Unknown | PD | |
| NT5C3B | SNV | Missense_Mutation | c.634N>C | p.Asn212His | p.N212H | Q969T7 | protein_coding | tolerated(0.21) | benign(0.006) | TCGA-CM-6169-01 | Colorectum | colon adenocarcinoma | Male | >=65 | I/II | Ancillary | leucovorin | SD | |
| NT5C3B | SNV | Missense_Mutation | c.662N>A | p.Gly221Asp | p.G221D | Q969T7 | protein_coding | tolerated(1) | benign(0.241) | TCGA-AP-A051-01 | Endometrium | uterine corpus endometrioid carcinoma | Female | >=65 | I/II | Unknown | Unknown | SD | |
| NT5C3B | SNV | Missense_Mutation | novel | c.737A>G | p.Asn246Ser | p.N246S | Q969T7 | protein_coding | tolerated(0.06) | probably_damaging(0.998) | TCGA-AX-A063-01 | Endometrium | uterine corpus endometrioid carcinoma | Female | <65 | I/II | Unknown | Unknown | SD |
| NT5C3B | SNV | Missense_Mutation | rs144780012 | c.781N>T | p.Arg261Trp | p.R261W | Q969T7 | protein_coding | deleterious(0.02) | probably_damaging(0.916) | TCGA-AX-A0J1-01 | Endometrium | uterine corpus endometrioid carcinoma | Female | >=65 | I/II | Unknown | Unknown | SD |
| NT5C3B | SNV | Missense_Mutation | novel | c.835N>T | p.Asp279Tyr | p.D279Y | Q969T7 | protein_coding | deleterious(0) | probably_damaging(0.99) | TCGA-AX-A1CE-01 | Endometrium | uterine corpus endometrioid carcinoma | Female | <65 | I/II | Unspecific | Paclitaxel | SD |
| NT5C3B | SNV | Missense_Mutation | c.220N>T | p.Arg74Trp | p.R74W | Q969T7 | protein_coding | deleterious(0) | possibly_damaging(0.812) | TCGA-B5-A11E-01 | Endometrium | uterine corpus endometrioid carcinoma | Female | <65 | I/II | Unknown | Unknown | SD |
| Page: 1 2 |
Top |
Related drugs of malignant transformation related genes |
| Identification of chemicals and drugs interact with genes involved in malignant transfromation |
| (DGIdb 4.0) |
| Entrez ID | Symbol | Category | Interaction Types | Drug Claim Name | Drug Name | PMIDs |
| Page: 1 |

Copyright 2023-Present -The University of Texas Health Science Center at Houston |