
|
|||||
|
 | |
| |
| |
| |
| |
| |
|
Gene: NT5C2 |
Gene summary for NT5C2 |
| Gene information | Species | Human | Gene symbol | NT5C2 | Gene ID | 22978 |
| Gene name | 5'-nucleotidase, cytosolic II | |
| Gene Alias | GMP | |
| Cytomap | 10q24.32-q24.33 | |
| Gene Type | protein-coding | GO ID | GO:0000255 | UniProtAcc | A8K6K2 |
Top |
Malignant transformation analysis |
| Identification of the aberrant gene expression in precancerous and cancerous lesions by comparing the gene expression of stem-like cells in diseased tissues with normal stem cells |
| Entrez ID | Symbol | Replicates | Species | Organ | Tissue | Adj P-value | Log2FC | Malignancy |
| 22978 | NT5C2 | CCI_1 | Human | Cervix | CC | 2.88e-12 | 1.27e+00 | 0.528 |
| 22978 | NT5C2 | CCI_2 | Human | Cervix | CC | 5.40e-10 | 1.21e+00 | 0.5249 |
| 22978 | NT5C2 | CCI_3 | Human | Cervix | CC | 2.77e-09 | 6.02e-01 | 0.516 |
| 22978 | NT5C2 | sample3 | Human | Cervix | CC | 6.72e-03 | 2.07e-01 | 0.1387 |
| 22978 | NT5C2 | H2 | Human | Cervix | HSIL_HPV | 2.20e-08 | 4.09e-01 | 0.0632 |
| 22978 | NT5C2 | HTA11_3410_2000001011 | Human | Colorectum | AD | 8.97e-12 | -5.70e-01 | 0.0155 |
| 22978 | NT5C2 | HTA11_866_3004761011 | Human | Colorectum | AD | 2.19e-09 | -5.60e-01 | 0.096 |
| 22978 | NT5C2 | HTA11_8622_2000001021 | Human | Colorectum | SER | 1.34e-02 | -7.21e-01 | 0.0528 |
| 22978 | NT5C2 | HTA11_7696_3000711011 | Human | Colorectum | AD | 4.72e-04 | -4.08e-01 | 0.0674 |
| 22978 | NT5C2 | HTA11_6818_2000001021 | Human | Colorectum | AD | 8.73e-03 | -5.60e-01 | 0.0588 |
| 22978 | NT5C2 | HTA11_99999970781_79442 | Human | Colorectum | MSS | 9.57e-21 | -5.14e-01 | 0.294 |
| 22978 | NT5C2 | HTA11_99999973899_84307 | Human | Colorectum | MSS | 5.01e-03 | -5.65e-01 | 0.2585 |
| 22978 | NT5C2 | HTA11_99999974143_84620 | Human | Colorectum | MSS | 2.94e-20 | -6.48e-01 | 0.3005 |
| 22978 | NT5C2 | A001-C-207 | Human | Colorectum | FAP | 2.05e-02 | -1.54e-01 | 0.1278 |
| 22978 | NT5C2 | A015-C-203 | Human | Colorectum | FAP | 4.95e-28 | -3.42e-01 | -0.1294 |
| 22978 | NT5C2 | A015-C-204 | Human | Colorectum | FAP | 1.11e-04 | -3.14e-01 | -0.0228 |
| 22978 | NT5C2 | A014-C-040 | Human | Colorectum | FAP | 1.40e-02 | -3.54e-01 | -0.1184 |
| 22978 | NT5C2 | A002-C-201 | Human | Colorectum | FAP | 1.14e-09 | -3.31e-01 | 0.0324 |
| 22978 | NT5C2 | A002-C-203 | Human | Colorectum | FAP | 7.93e-03 | -1.37e-01 | 0.2786 |
| 22978 | NT5C2 | A001-C-119 | Human | Colorectum | FAP | 9.30e-06 | -4.75e-01 | -0.1557 |
| Page: 1 2 3 4 5 6 7 8 9 10 |
| Tissue | Expression Dynamics | Abbreviation |
| Cervix | 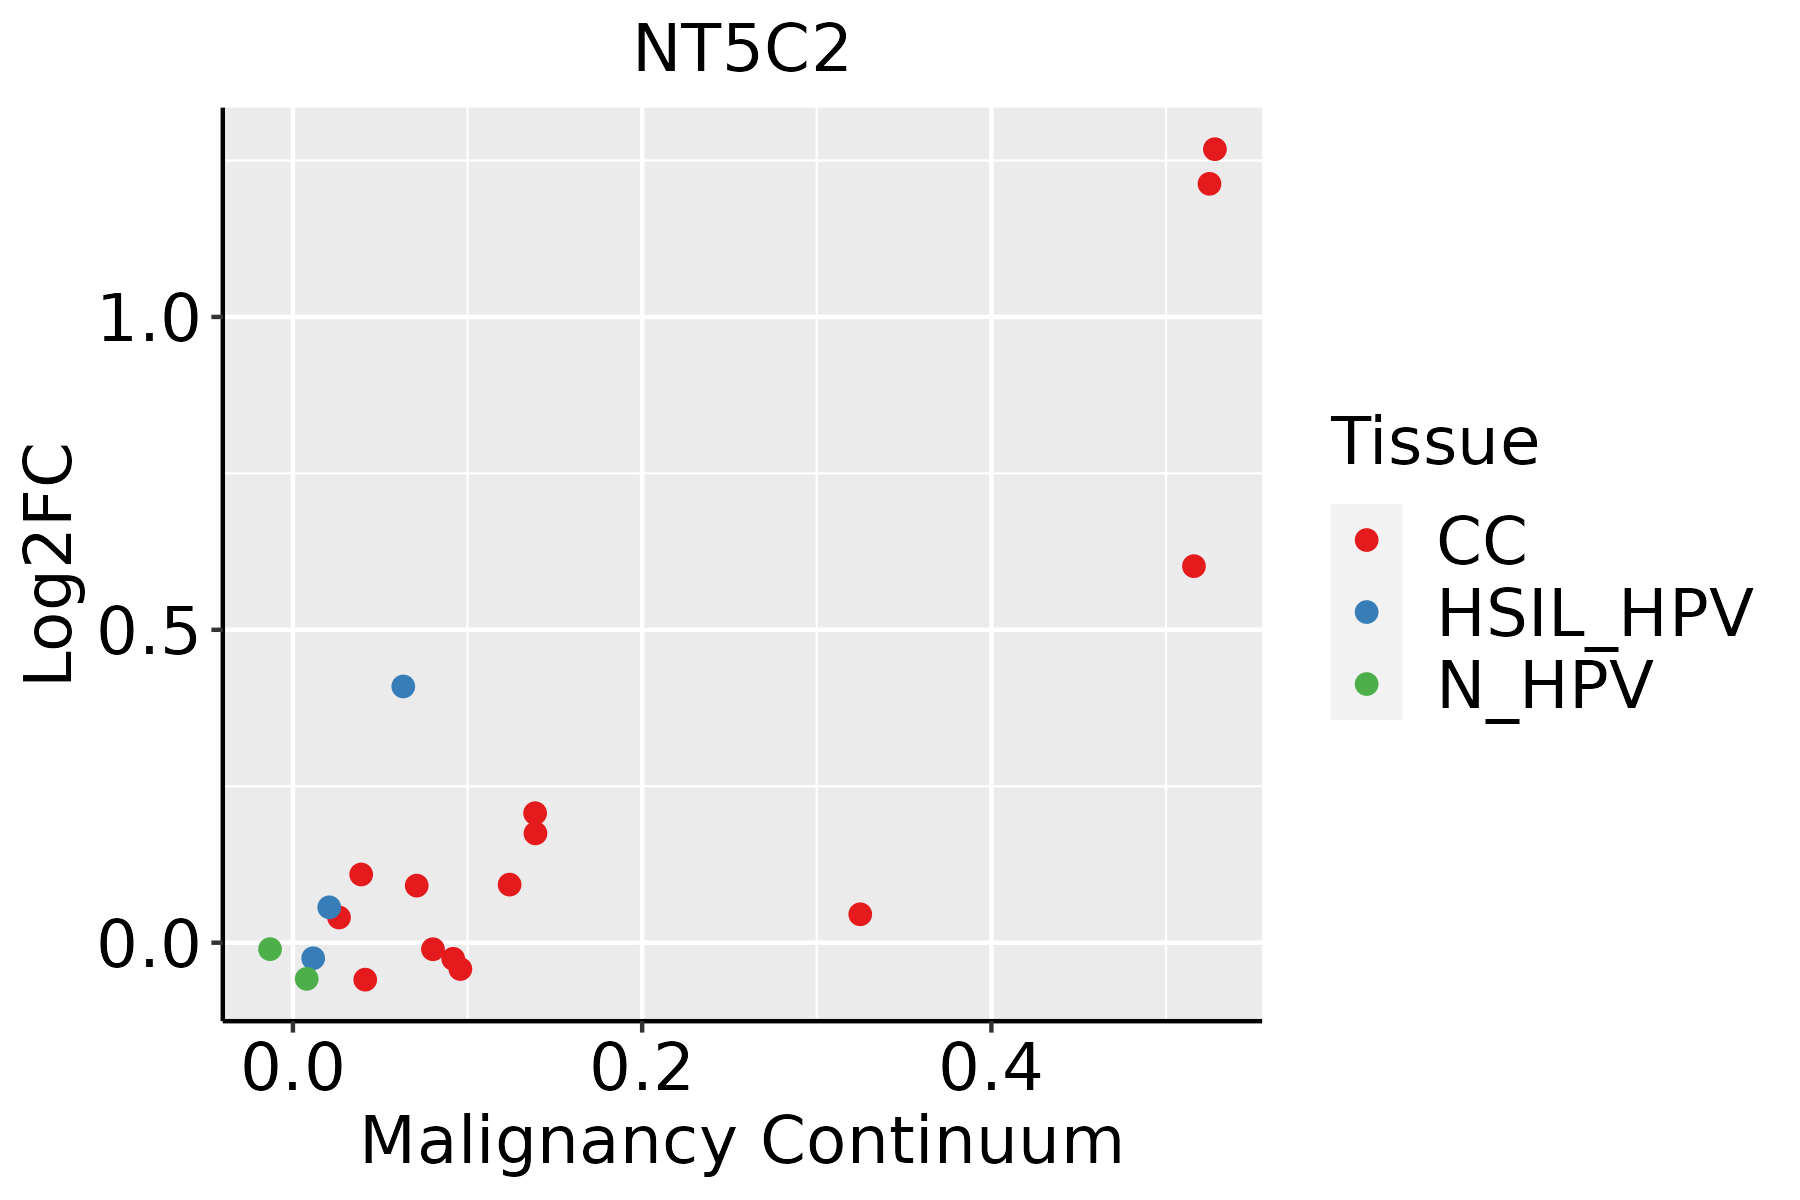 | CC: Cervix cancer |
| HSIL_HPV: HPV-infected high-grade squamous intraepithelial lesions | ||
| N_HPV: HPV-infected normal cervix | ||
| Colorectum (GSE201348) |  | FAP: Familial adenomatous polyposis |
| CRC: Colorectal cancer | ||
| Colorectum (HTA11) |  | AD: Adenomas |
| SER: Sessile serrated lesions | ||
| MSI-H: Microsatellite-high colorectal cancer | ||
| MSS: Microsatellite stable colorectal cancer | ||
| Endometrium |  | AEH: Atypical endometrial hyperplasia |
| EEC: Endometrioid Cancer | ||
| Esophagus | 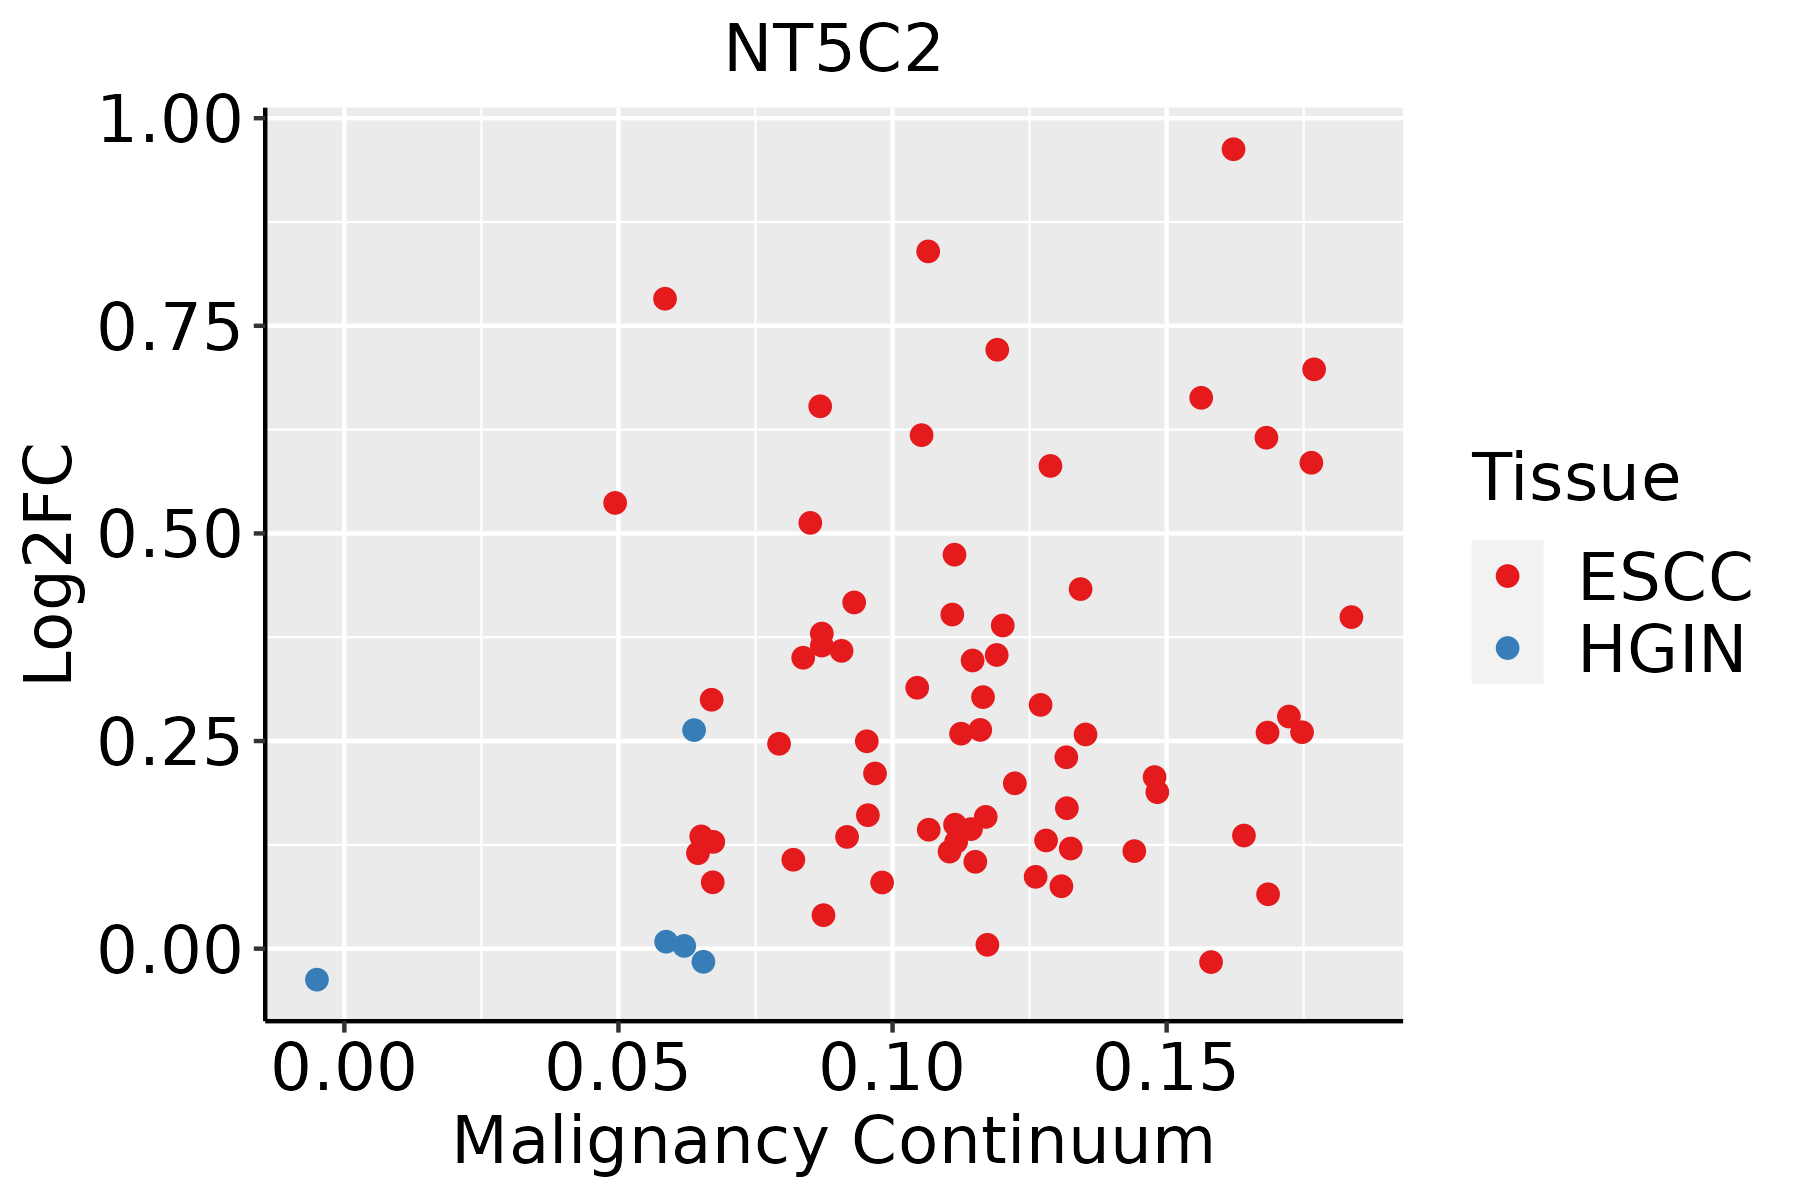 | ESCC: Esophageal squamous cell carcinoma |
| HGIN: High-grade intraepithelial neoplasias | ||
| LGIN: Low-grade intraepithelial neoplasias | ||
| Liver | 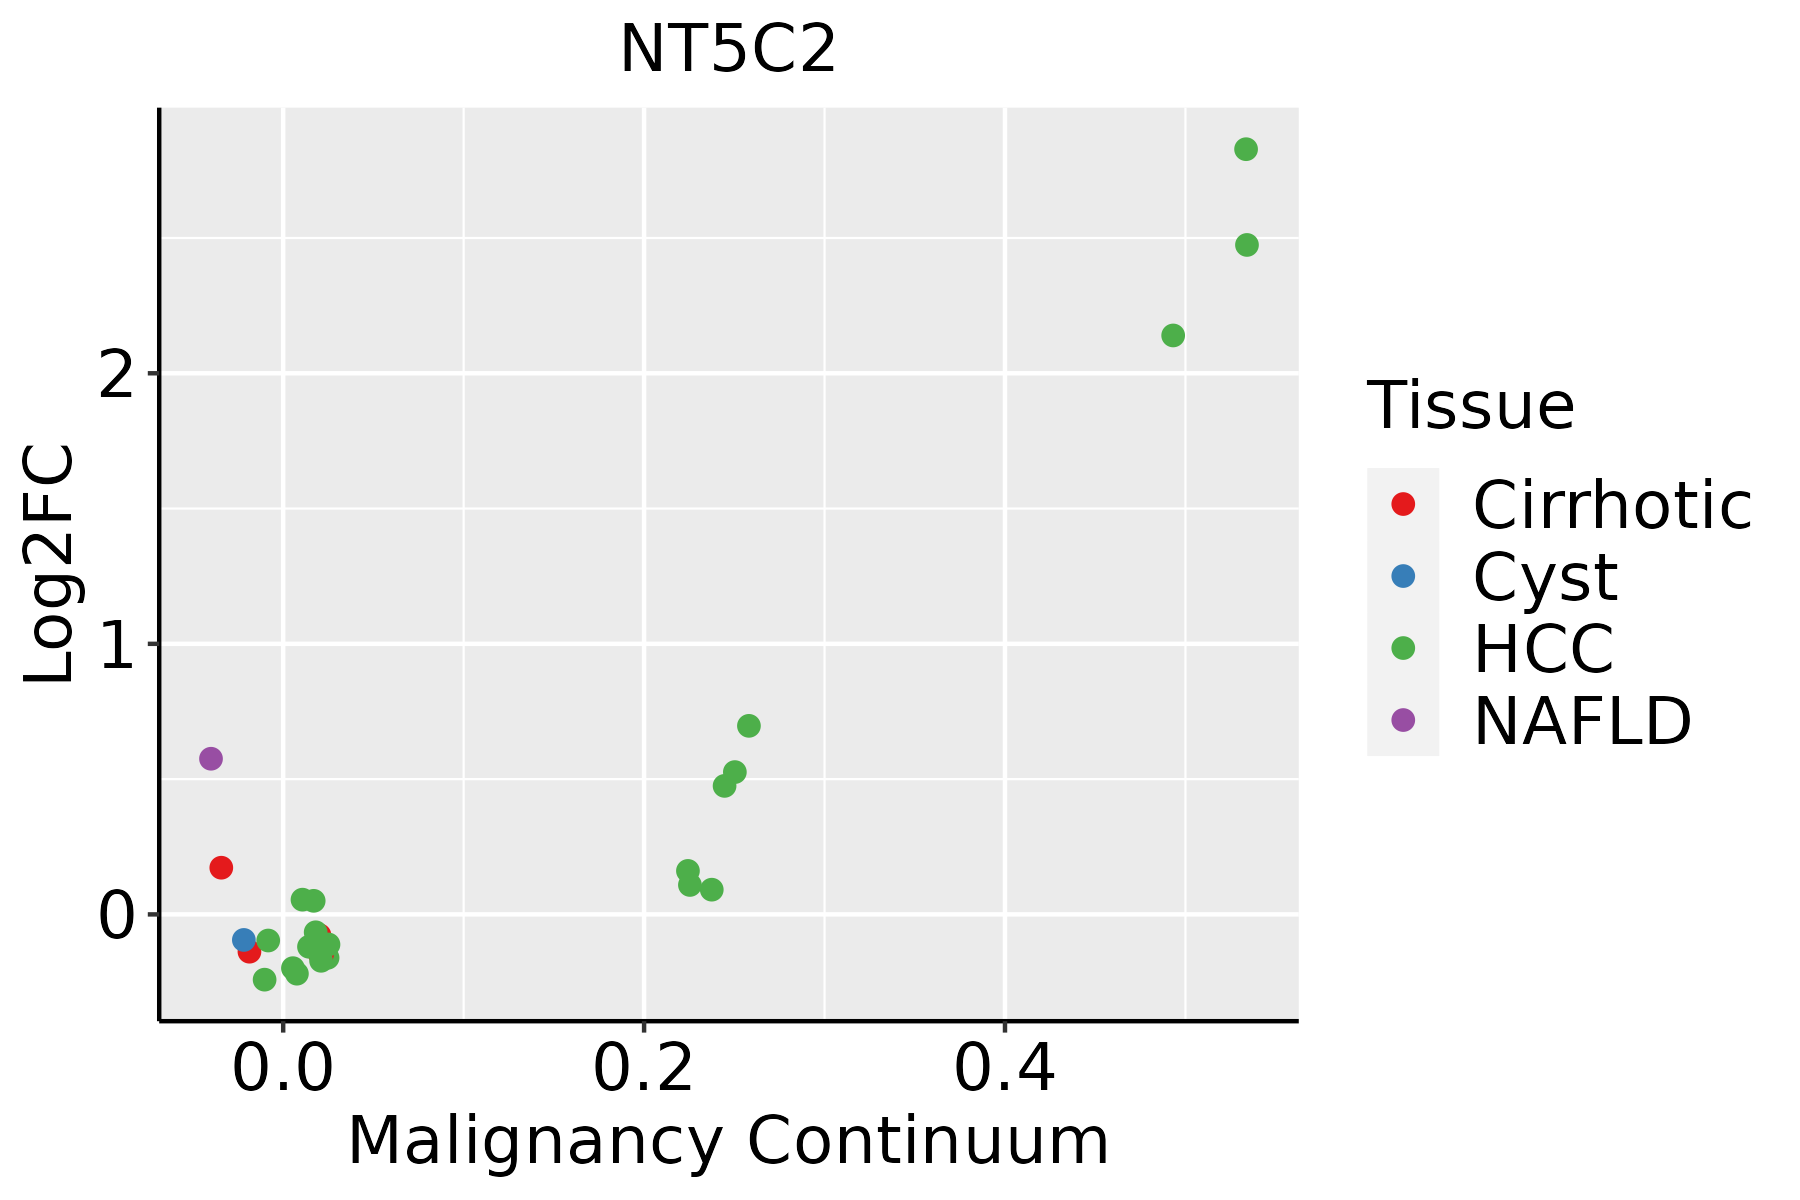 | HCC: Hepatocellular carcinoma |
| NAFLD: Non-alcoholic fatty liver disease | ||
| Lung |  | AAH: Atypical adenomatous hyperplasia |
| AIS: Adenocarcinoma in situ | ||
| IAC: Invasive lung adenocarcinoma | ||
| MIA: Minimally invasive adenocarcinoma | ||
| Oral Cavity |  | EOLP: Erosive Oral lichen planus |
| LP: leukoplakia | ||
| NEOLP: Non-erosive oral lichen planus | ||
| OSCC: Oral squamous cell carcinoma | ||
| Prostate | 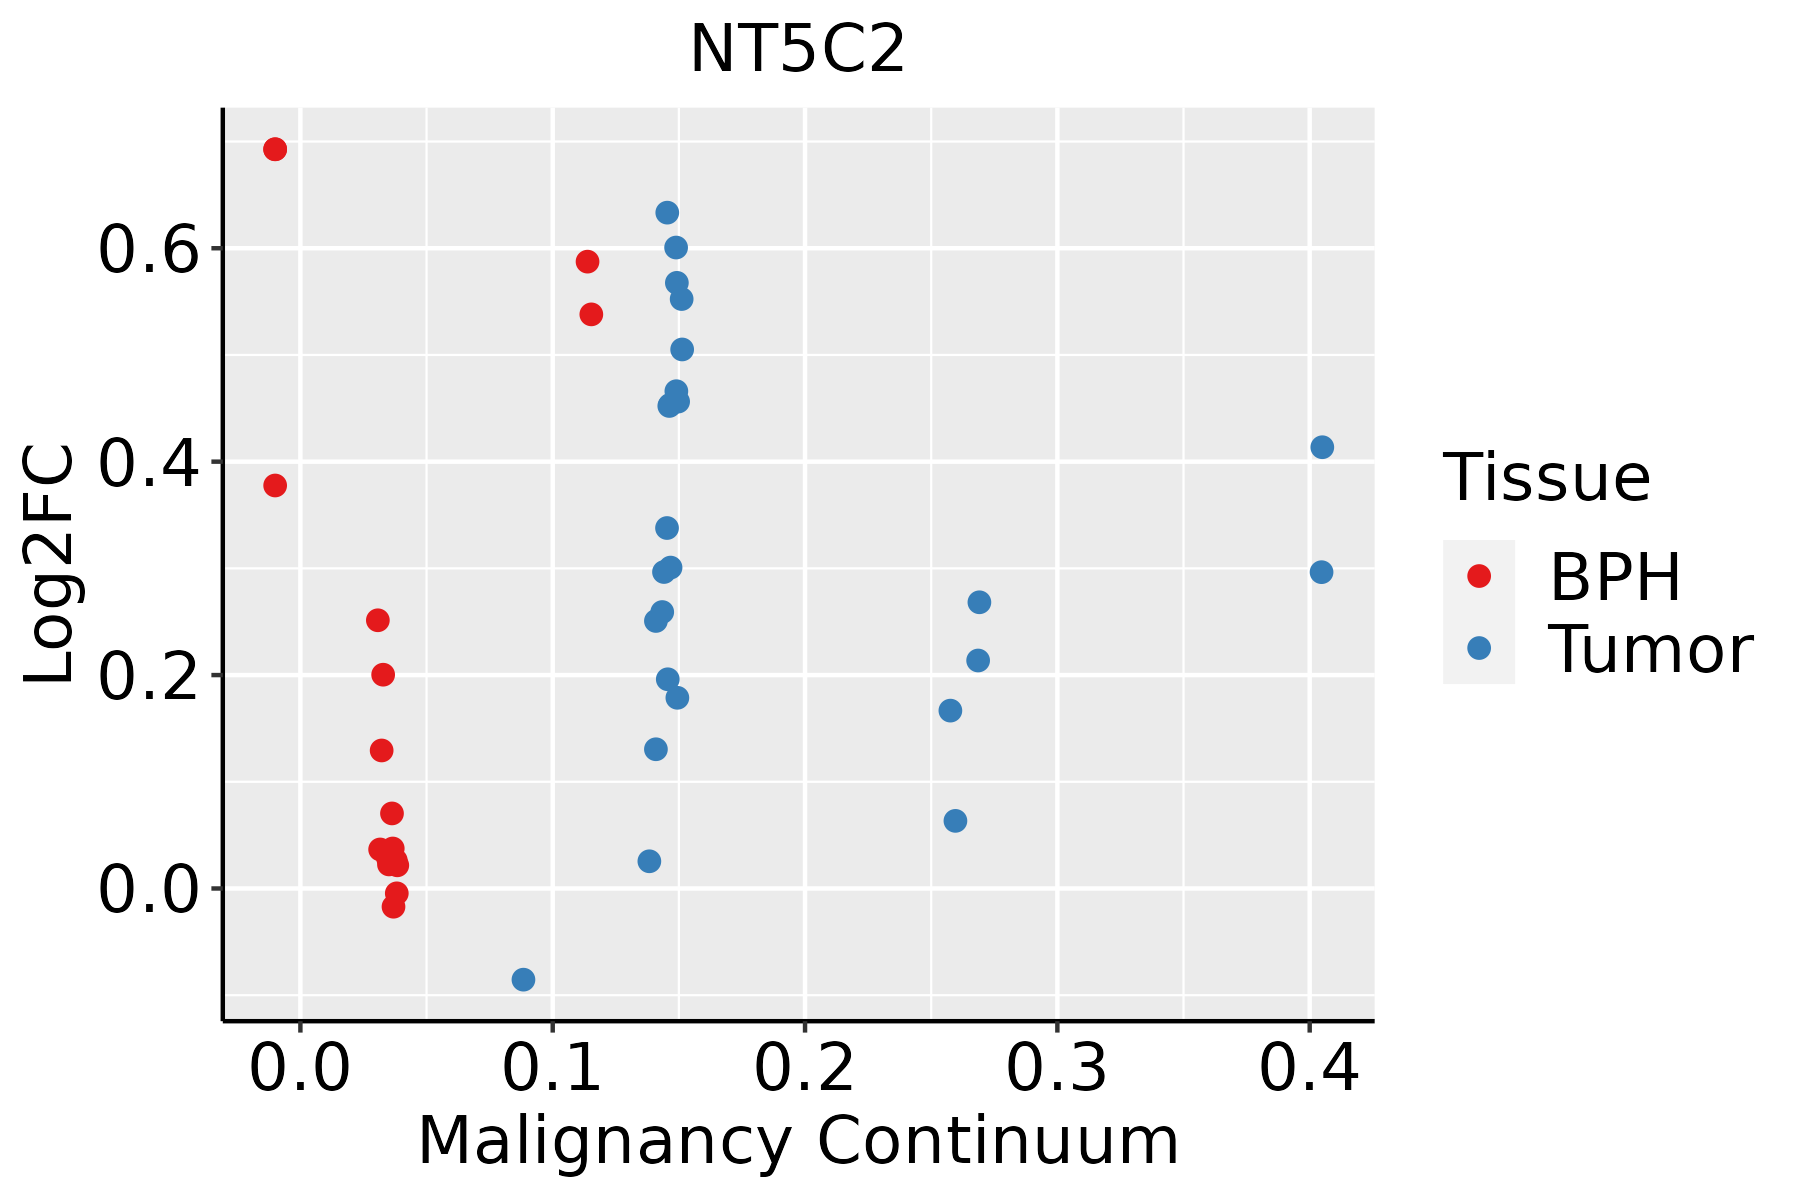 | BPH: Benign Prostatic Hyperplasia |
| Thyroid | 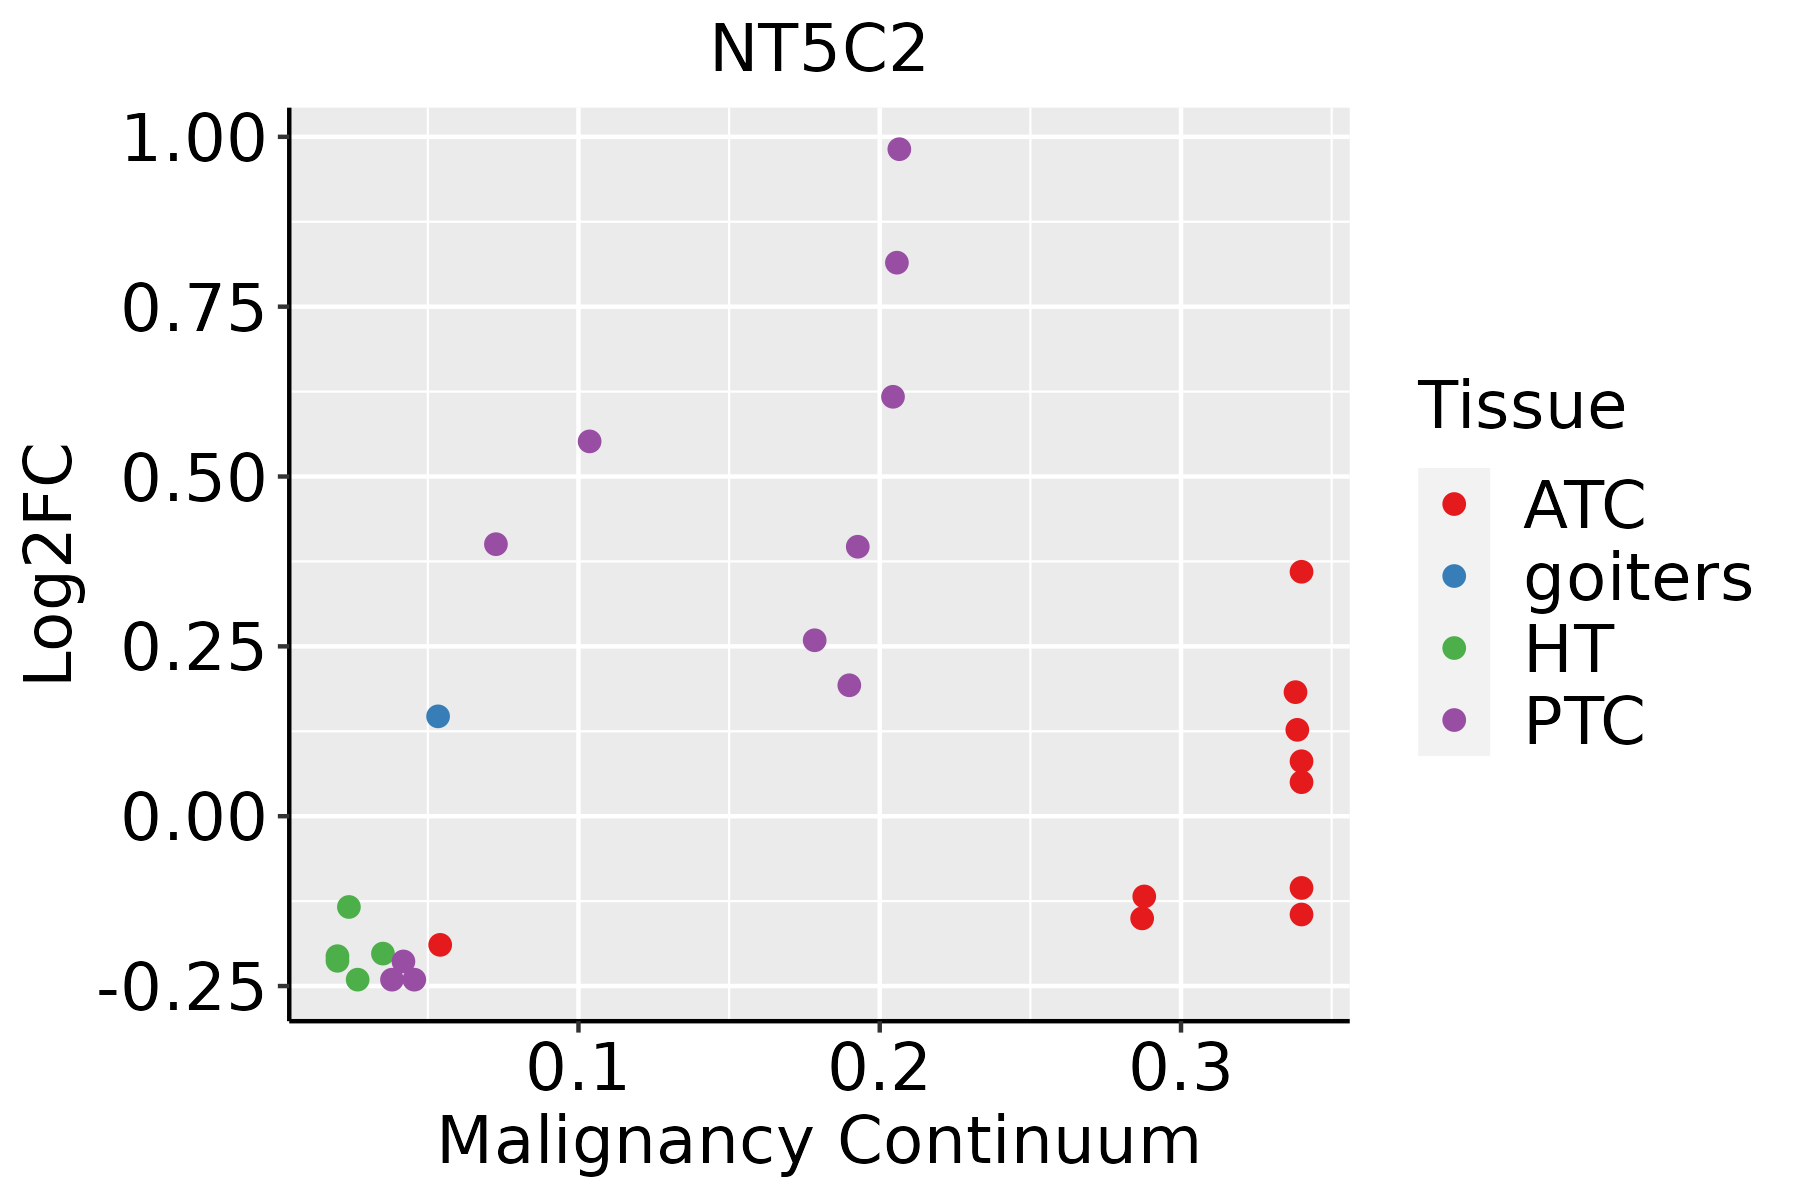 | ATC: Anaplastic thyroid cancer |
| HT: Hashimoto's thyroiditis | ||
| PTC: Papillary thyroid cancer |
| ∗log2FC in expression of this searched gene in stem-like cells from each diseased tissue sample relative to stem-like cells in normal samples in each tissue plotted against the malignancy continuum. Samples are colored based on if they are from different disease stage. |
Top |
Malignant transformation related pathway analysis |
| Find out the enriched GO biological processes and KEGG pathways involved in transition from healthy to precancer to cancer |
| Tissue | Disease Stage | Enriched GO biological Processes |
| Colorectum | AD |  |
| Colorectum | SER |  |
| Colorectum | MSS |  |
| Colorectum | MSI-H |  |
| Colorectum | FAP |  |
| ∗Top 15 enriched GO BP terms are showed in the bar plot of each disease state in each tissue. Each row represents a significant GO biological process which is colored according to the -log10(p.adjust). |
| Page: 1 2 3 4 5 6 7 8 9 |
| GO ID | Tissue | Disease Stage | Description | Gene Ratio | Bg Ratio | pvalue | p.adjust | Count |
| GO:00467008 | Cervix | CC | heterocycle catabolic process | 80/2311 | 445/18723 | 3.23e-04 | 3.42e-03 | 80 |
| GO:00346559 | Cervix | CC | nucleobase-containing compound catabolic process | 74/2311 | 407/18723 | 3.77e-04 | 3.88e-03 | 74 |
| GO:00196939 | Cervix | CC | ribose phosphate metabolic process | 72/2311 | 396/18723 | 4.49e-04 | 4.48e-03 | 72 |
| GO:00092599 | Cervix | CC | ribonucleotide metabolic process | 70/2311 | 385/18723 | 5.35e-04 | 5.18e-03 | 70 |
| GO:00442709 | Cervix | CC | cellular nitrogen compound catabolic process | 79/2311 | 451/18723 | 7.80e-04 | 6.91e-03 | 79 |
| GO:000915010 | Cervix | CC | purine ribonucleotide metabolic process | 66/2311 | 368/18723 | 1.09e-03 | 9.07e-03 | 66 |
| GO:00163117 | Cervix | CC | dephosphorylation | 73/2311 | 417/18723 | 1.23e-03 | 9.87e-03 | 73 |
| GO:00194398 | Cervix | CC | aromatic compound catabolic process | 79/2311 | 467/18723 | 2.14e-03 | 1.54e-02 | 79 |
| GO:000616310 | Cervix | CC | purine nucleotide metabolic process | 67/2311 | 396/18723 | 4.41e-03 | 2.69e-02 | 67 |
| GO:007252110 | Cervix | CC | purine-containing compound metabolic process | 69/2311 | 416/18723 | 6.27e-03 | 3.54e-02 | 69 |
| GO:19013618 | Cervix | CC | organic cyclic compound catabolic process | 80/2311 | 495/18723 | 6.77e-03 | 3.72e-02 | 80 |
| GO:000911710 | Cervix | CC | nucleotide metabolic process | 79/2311 | 489/18723 | 7.16e-03 | 3.85e-02 | 79 |
| GO:0009150 | Colorectum | AD | purine ribonucleotide metabolic process | 142/3918 | 368/18723 | 4.29e-15 | 1.17e-12 | 142 |
| GO:0006163 | Colorectum | AD | purine nucleotide metabolic process | 149/3918 | 396/18723 | 1.08e-14 | 2.80e-12 | 149 |
| GO:0072521 | Colorectum | AD | purine-containing compound metabolic process | 153/3918 | 416/18723 | 4.34e-14 | 1.01e-11 | 153 |
| GO:0009259 | Colorectum | AD | ribonucleotide metabolic process | 144/3918 | 385/18723 | 5.25e-14 | 1.13e-11 | 144 |
| GO:0019693 | Colorectum | AD | ribose phosphate metabolic process | 145/3918 | 396/18723 | 3.01e-13 | 5.71e-11 | 145 |
| GO:0009117 | Colorectum | AD | nucleotide metabolic process | 168/3918 | 489/18723 | 2.20e-12 | 3.36e-10 | 168 |
| GO:0006753 | Colorectum | AD | nucleoside phosphate metabolic process | 169/3918 | 497/18723 | 4.99e-12 | 6.98e-10 | 169 |
| GO:0044270 | Colorectum | AD | cellular nitrogen compound catabolic process | 147/3918 | 451/18723 | 3.35e-09 | 2.23e-07 | 147 |
| Page: 1 2 3 4 5 6 7 8 9 10 11 12 13 14 15 16 17 |
| Pathway ID | Tissue | Disease Stage | Description | Gene Ratio | Bg Ratio | pvalue | p.adjust | qvalue | Count |
| hsa012325 | Esophagus | ESCC | Nucleotide metabolism | 59/4205 | 85/8465 | 1.67e-04 | 6.58e-04 | 3.37e-04 | 59 |
| hsa002405 | Esophagus | ESCC | Pyrimidine metabolism | 41/4205 | 58/8465 | 9.14e-04 | 2.92e-03 | 1.49e-03 | 41 |
| hsa0123212 | Esophagus | ESCC | Nucleotide metabolism | 59/4205 | 85/8465 | 1.67e-04 | 6.58e-04 | 3.37e-04 | 59 |
| hsa0024012 | Esophagus | ESCC | Pyrimidine metabolism | 41/4205 | 58/8465 | 9.14e-04 | 2.92e-03 | 1.49e-03 | 41 |
| hsa01232 | Liver | Cirrhotic | Nucleotide metabolism | 39/2530 | 85/8465 | 1.27e-03 | 6.73e-03 | 4.15e-03 | 39 |
| hsa00240 | Liver | Cirrhotic | Pyrimidine metabolism | 27/2530 | 58/8465 | 5.31e-03 | 1.88e-02 | 1.16e-02 | 27 |
| hsa012321 | Liver | Cirrhotic | Nucleotide metabolism | 39/2530 | 85/8465 | 1.27e-03 | 6.73e-03 | 4.15e-03 | 39 |
| hsa002401 | Liver | Cirrhotic | Pyrimidine metabolism | 27/2530 | 58/8465 | 5.31e-03 | 1.88e-02 | 1.16e-02 | 27 |
| hsa002402 | Liver | HCC | Pyrimidine metabolism | 44/4020 | 58/8465 | 9.34e-06 | 7.11e-05 | 3.95e-05 | 44 |
| hsa012322 | Liver | HCC | Nucleotide metabolism | 59/4020 | 85/8465 | 3.30e-05 | 1.88e-04 | 1.04e-04 | 59 |
| hsa002403 | Liver | HCC | Pyrimidine metabolism | 44/4020 | 58/8465 | 9.34e-06 | 7.11e-05 | 3.95e-05 | 44 |
| hsa012323 | Liver | HCC | Nucleotide metabolism | 59/4020 | 85/8465 | 3.30e-05 | 1.88e-04 | 1.04e-04 | 59 |
| hsa012324 | Oral cavity | OSCC | Nucleotide metabolism | 54/3704 | 85/8465 | 1.78e-04 | 5.95e-04 | 3.03e-04 | 54 |
| hsa002404 | Oral cavity | OSCC | Pyrimidine metabolism | 37/3704 | 58/8465 | 1.62e-03 | 4.45e-03 | 2.26e-03 | 37 |
| hsa0123211 | Oral cavity | OSCC | Nucleotide metabolism | 54/3704 | 85/8465 | 1.78e-04 | 5.95e-04 | 3.03e-04 | 54 |
| hsa0024011 | Oral cavity | OSCC | Pyrimidine metabolism | 37/3704 | 58/8465 | 1.62e-03 | 4.45e-03 | 2.26e-03 | 37 |
| hsa0123221 | Oral cavity | LP | Nucleotide metabolism | 42/2418 | 85/8465 | 3.62e-05 | 2.36e-04 | 1.52e-04 | 42 |
| hsa0024021 | Oral cavity | LP | Pyrimidine metabolism | 28/2418 | 58/8465 | 1.12e-03 | 5.02e-03 | 3.24e-03 | 28 |
| hsa0123231 | Oral cavity | LP | Nucleotide metabolism | 42/2418 | 85/8465 | 3.62e-05 | 2.36e-04 | 1.52e-04 | 42 |
| hsa0024031 | Oral cavity | LP | Pyrimidine metabolism | 28/2418 | 58/8465 | 1.12e-03 | 5.02e-03 | 3.24e-03 | 28 |
| Page: 1 |
Top |
Cell-cell communication analysis |
| Identification of potential cell-cell interactions between two cell types and their ligand-receptor pairs for different disease states |
| Ligand | Receptor | LRpair | Pathway | Tissue | Disease Stage |
| Page: 1 |
Top |
Single-cell gene regulatory network inference analysis |
| Find out the significant the regulons (TFs) and the target genes of each regulon across cell types for different disease states |
| TF | Cell Type | Tissue | Disease Stage | Target Gene | RSS | Regulon Activity |
| ∗The dot plots of a searched regulon are shown for all cell subpopulations in each disease state of each tissue based on the regulon specific score inferred using pySCENIC and by calculating the average expression. |
| Page: 1 |
Top |
Somatic mutation of malignant transformation related genes |
| Annotation of somatic variants for genes involved in malignant transformation |
| Hugo Symbol | Variant Class | Variant Classification | dbSNP RS | HGVSc | HGVSp | HGVSp Short | SWISSPROT | BIOTYPE | SIFT | PolyPhen | Tumor Sample Barcode | Tissue | Histology | Sex | Age | Stage | Therapy Types | Drugs | Outcome |
| NT5C2 | SNV | Missense_Mutation | novel | c.259N>T | p.Leu87Phe | p.L87F | P49902 | protein_coding | deleterious(0.04) | probably_damaging(0.985) | TCGA-AN-A046-01 | Breast | breast invasive carcinoma | Female | >=65 | I/II | Unknown | Unknown | SD |
| NT5C2 | insertion | Nonsense_Mutation | novel | c.1216_1217insAACCACCTTTGTGAGATGGCACAGGAGATAGTTTG | p.Leu406GlnfsTer5 | p.L406Qfs*5 | P49902 | protein_coding | TCGA-A2-A04Y-01 | Breast | breast invasive carcinoma | Female | <65 | I/II | Chemotherapy | cytoxan | SD | ||
| NT5C2 | SNV | Missense_Mutation | c.544G>A | p.Glu182Lys | p.E182K | P49902 | protein_coding | tolerated(0.59) | benign(0.08) | TCGA-DR-A0ZM-01 | Cervix | cervical & endocervical cancer | Female | <65 | III/IV | Unspecific | Cisplatin | SD | |
| NT5C2 | SNV | Missense_Mutation | c.446N>T | p.Arg149Ile | p.R149I | P49902 | protein_coding | deleterious(0) | possibly_damaging(0.574) | TCGA-FU-A3HZ-01 | Cervix | cervical & endocervical cancer | Female | <65 | I/II | Chemotherapy | cisplatin | CR | |
| NT5C2 | insertion | Frame_Shift_Ins | novel | c.1237_1238insAG | p.Arg413GlnfsTer15 | p.R413Qfs*15 | P49902 | protein_coding | TCGA-DS-A1OC-01 | Cervix | cervical & endocervical cancer | Female | <65 | I/II | Chemotherapy | gemcitabine | SD | ||
| NT5C2 | SNV | Missense_Mutation | c.1352N>T | p.Ala451Val | p.A451V | P49902 | protein_coding | deleterious(0) | probably_damaging(0.942) | TCGA-AA-3492-01 | Colorectum | colon adenocarcinoma | Female | >=65 | I/II | Unknown | Unknown | SD | |
| NT5C2 | SNV | Missense_Mutation | c.1168N>A | p.Glu390Lys | p.E390K | P49902 | protein_coding | tolerated(0.08) | probably_damaging(0.941) | TCGA-AA-3510-01 | Colorectum | colon adenocarcinoma | Male | >=65 | I/II | Unknown | Unknown | SD | |
| NT5C2 | SNV | Missense_Mutation | c.1100N>A | p.Arg367Gln | p.R367Q | P49902 | protein_coding | deleterious(0.04) | possibly_damaging(0.704) | TCGA-AA-3510-01 | Colorectum | colon adenocarcinoma | Male | >=65 | I/II | Unknown | Unknown | SD | |
| NT5C2 | SNV | Missense_Mutation | c.1083N>T | p.Lys361Asn | p.K361N | P49902 | protein_coding | deleterious(0) | probably_damaging(1) | TCGA-AA-A00N-01 | Colorectum | colon adenocarcinoma | Male | >=65 | I/II | Unknown | Unknown | PD | |
| NT5C2 | SNV | Missense_Mutation | rs775006132 | c.1172A>G | p.Glu391Gly | p.E391G | P49902 | protein_coding | deleterious(0.02) | probably_damaging(0.968) | TCGA-AZ-4315-01 | Colorectum | colon adenocarcinoma | Male | <65 | I/II | Unknown | Unknown | SD |
| Page: 1 2 3 4 5 6 7 |
Top |
Related drugs of malignant transformation related genes |
| Identification of chemicals and drugs interact with genes involved in malignant transfromation |
| (DGIdb 4.0) |
| Entrez ID | Symbol | Category | Interaction Types | Drug Claim Name | Drug Name | PMIDs |
| 22978 | NT5C2 | ENZYME, CLINICALLY ACTIONABLE, DRUG RESISTANCE | didanosine | DIDANOSINE | 23315321 | |
| 22978 | NT5C2 | ENZYME, CLINICALLY ACTIONABLE, DRUG RESISTANCE | THIOGUANINE | THIOGUANINE | 23377183,23377281 | |
| 22978 | NT5C2 | ENZYME, CLINICALLY ACTIONABLE, DRUG RESISTANCE | gemcitabine | GEMCITABINE | 22838949,24300978 | |
| 22978 | NT5C2 | ENZYME, CLINICALLY ACTIONABLE, DRUG RESISTANCE | mercaptopurine | MERCAPTOPURINE | 15990089 | |
| 22978 | NT5C2 | ENZYME, CLINICALLY ACTIONABLE, DRUG RESISTANCE | MERCAPTOPURINE | MERCAPTOPURINE | 23377183,23377281 | |
| 22978 | NT5C2 | ENZYME, CLINICALLY ACTIONABLE, DRUG RESISTANCE | cytarabine | CYTARABINE |
| Page: 1 |

Copyright 2023-Present -The University of Texas Health Science Center at Houston |