
|
|||||
|
 | |
| |
| |
| |
| |
| |
|
Gene: NSUN6 |
Gene summary for NSUN6 |
| Gene information | Species | Human | Gene symbol | NSUN6 | Gene ID | 221078 |
| Gene name | NOP2/Sun RNA methyltransferase 6 | |
| Gene Alias | 4933414E04Rik | |
| Cytomap | 10p12.31 | |
| Gene Type | protein-coding | GO ID | GO:0001510 | UniProtAcc | Q8TEA1 |
Top |
Malignant transformation analysis |
| Identification of the aberrant gene expression in precancerous and cancerous lesions by comparing the gene expression of stem-like cells in diseased tissues with normal stem cells |
| Entrez ID | Symbol | Replicates | Species | Organ | Tissue | Adj P-value | Log2FC | Malignancy |
| 221078 | NSUN6 | CCI_2 | Human | Cervix | CC | 1.68e-02 | 5.77e-01 | 0.5249 |
| 221078 | NSUN6 | CCI_3 | Human | Cervix | CC | 7.54e-03 | 5.17e-01 | 0.516 |
| 221078 | NSUN6 | LZE5T | Human | Esophagus | ESCC | 6.08e-03 | 2.88e-01 | 0.0514 |
| 221078 | NSUN6 | LZE8T | Human | Esophagus | ESCC | 1.54e-04 | 1.47e-01 | 0.067 |
| 221078 | NSUN6 | LZE20T | Human | Esophagus | ESCC | 5.07e-04 | 1.77e-01 | 0.0662 |
| 221078 | NSUN6 | LZE21D1 | Human | Esophagus | HGIN | 2.38e-02 | 3.43e-01 | 0.0632 |
| 221078 | NSUN6 | LZE22D1 | Human | Esophagus | HGIN | 5.49e-06 | 3.23e-01 | 0.0595 |
| 221078 | NSUN6 | LZE22T | Human | Esophagus | ESCC | 5.67e-04 | 3.16e-01 | 0.068 |
| 221078 | NSUN6 | LZE24T | Human | Esophagus | ESCC | 3.02e-10 | 2.39e-01 | 0.0596 |
| 221078 | NSUN6 | LZE21T | Human | Esophagus | ESCC | 9.06e-08 | 3.02e-01 | 0.0655 |
| 221078 | NSUN6 | P1T-E | Human | Esophagus | ESCC | 1.02e-20 | 9.47e-01 | 0.0875 |
| 221078 | NSUN6 | P2T-E | Human | Esophagus | ESCC | 4.60e-20 | 3.55e-01 | 0.1177 |
| 221078 | NSUN6 | P4T-E | Human | Esophagus | ESCC | 1.88e-06 | 1.83e-01 | 0.1323 |
| 221078 | NSUN6 | P5T-E | Human | Esophagus | ESCC | 4.30e-12 | 1.99e-01 | 0.1327 |
| 221078 | NSUN6 | P8T-E | Human | Esophagus | ESCC | 3.22e-19 | 3.40e-01 | 0.0889 |
| 221078 | NSUN6 | P9T-E | Human | Esophagus | ESCC | 2.85e-04 | 1.16e-01 | 0.1131 |
| 221078 | NSUN6 | P10T-E | Human | Esophagus | ESCC | 1.49e-20 | 2.82e-01 | 0.116 |
| 221078 | NSUN6 | P11T-E | Human | Esophagus | ESCC | 1.86e-02 | 1.27e-01 | 0.1426 |
| 221078 | NSUN6 | P12T-E | Human | Esophagus | ESCC | 2.35e-15 | 3.40e-01 | 0.1122 |
| 221078 | NSUN6 | P15T-E | Human | Esophagus | ESCC | 1.51e-06 | 1.32e-01 | 0.1149 |
| Page: 1 2 3 4 5 |
| Tissue | Expression Dynamics | Abbreviation |
| Cervix | 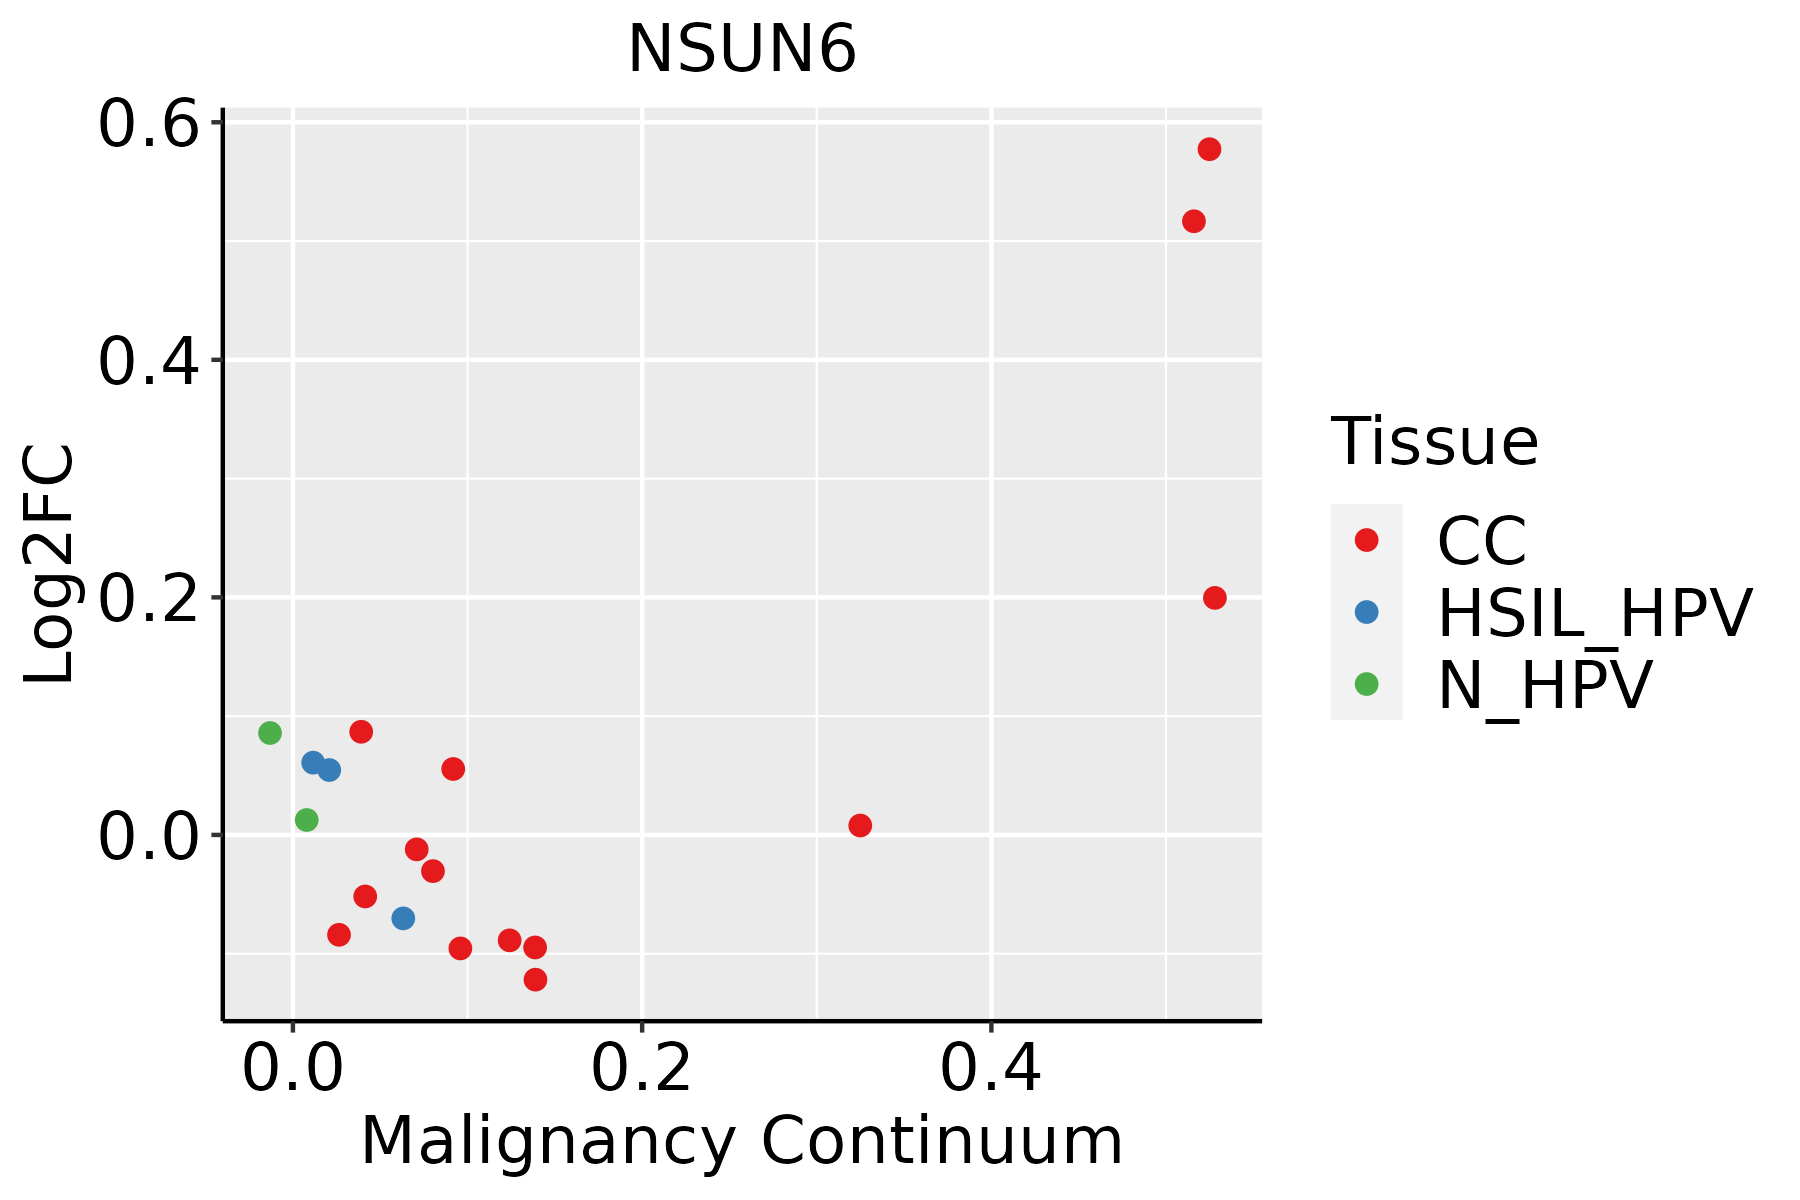 | CC: Cervix cancer |
| HSIL_HPV: HPV-infected high-grade squamous intraepithelial lesions | ||
| N_HPV: HPV-infected normal cervix | ||
| Esophagus |  | ESCC: Esophageal squamous cell carcinoma |
| HGIN: High-grade intraepithelial neoplasias | ||
| LGIN: Low-grade intraepithelial neoplasias | ||
| Liver | 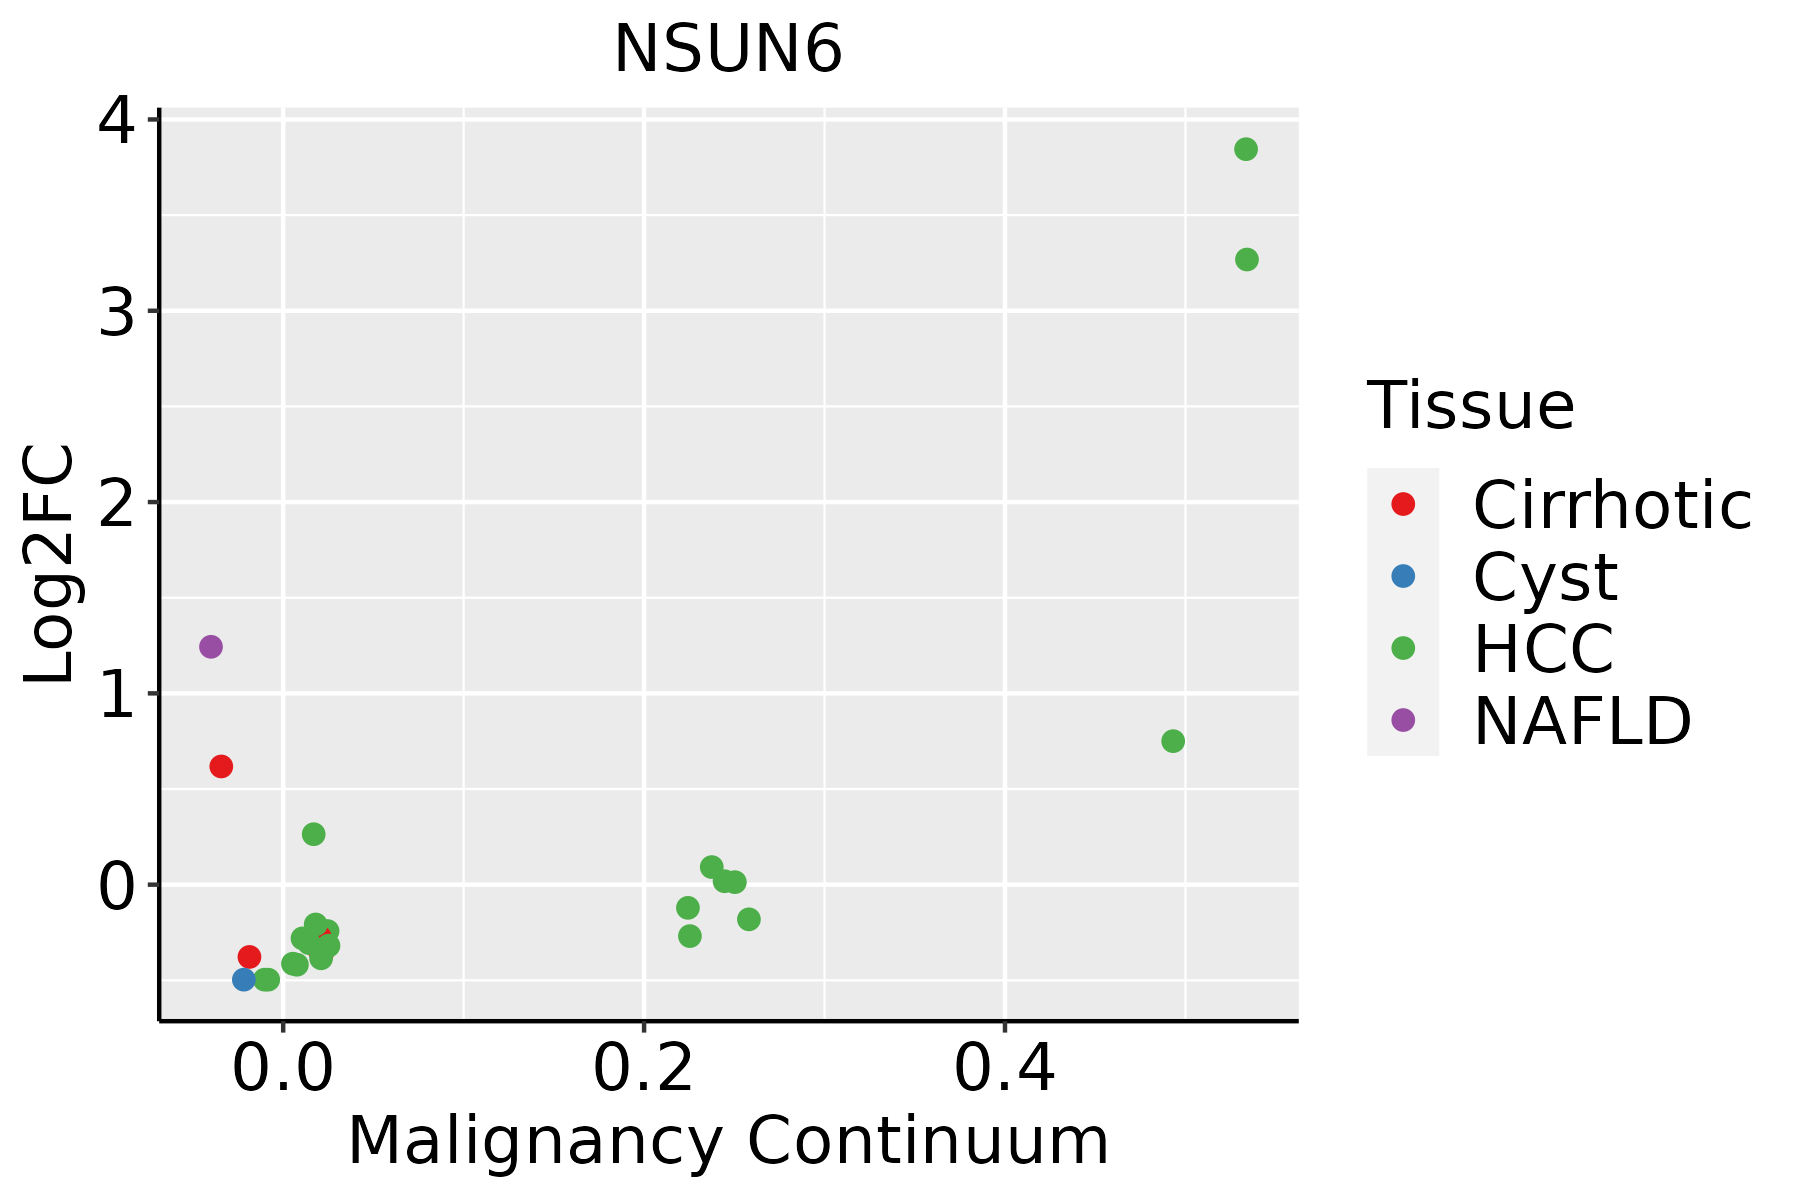 | HCC: Hepatocellular carcinoma |
| NAFLD: Non-alcoholic fatty liver disease | ||
| Thyroid | 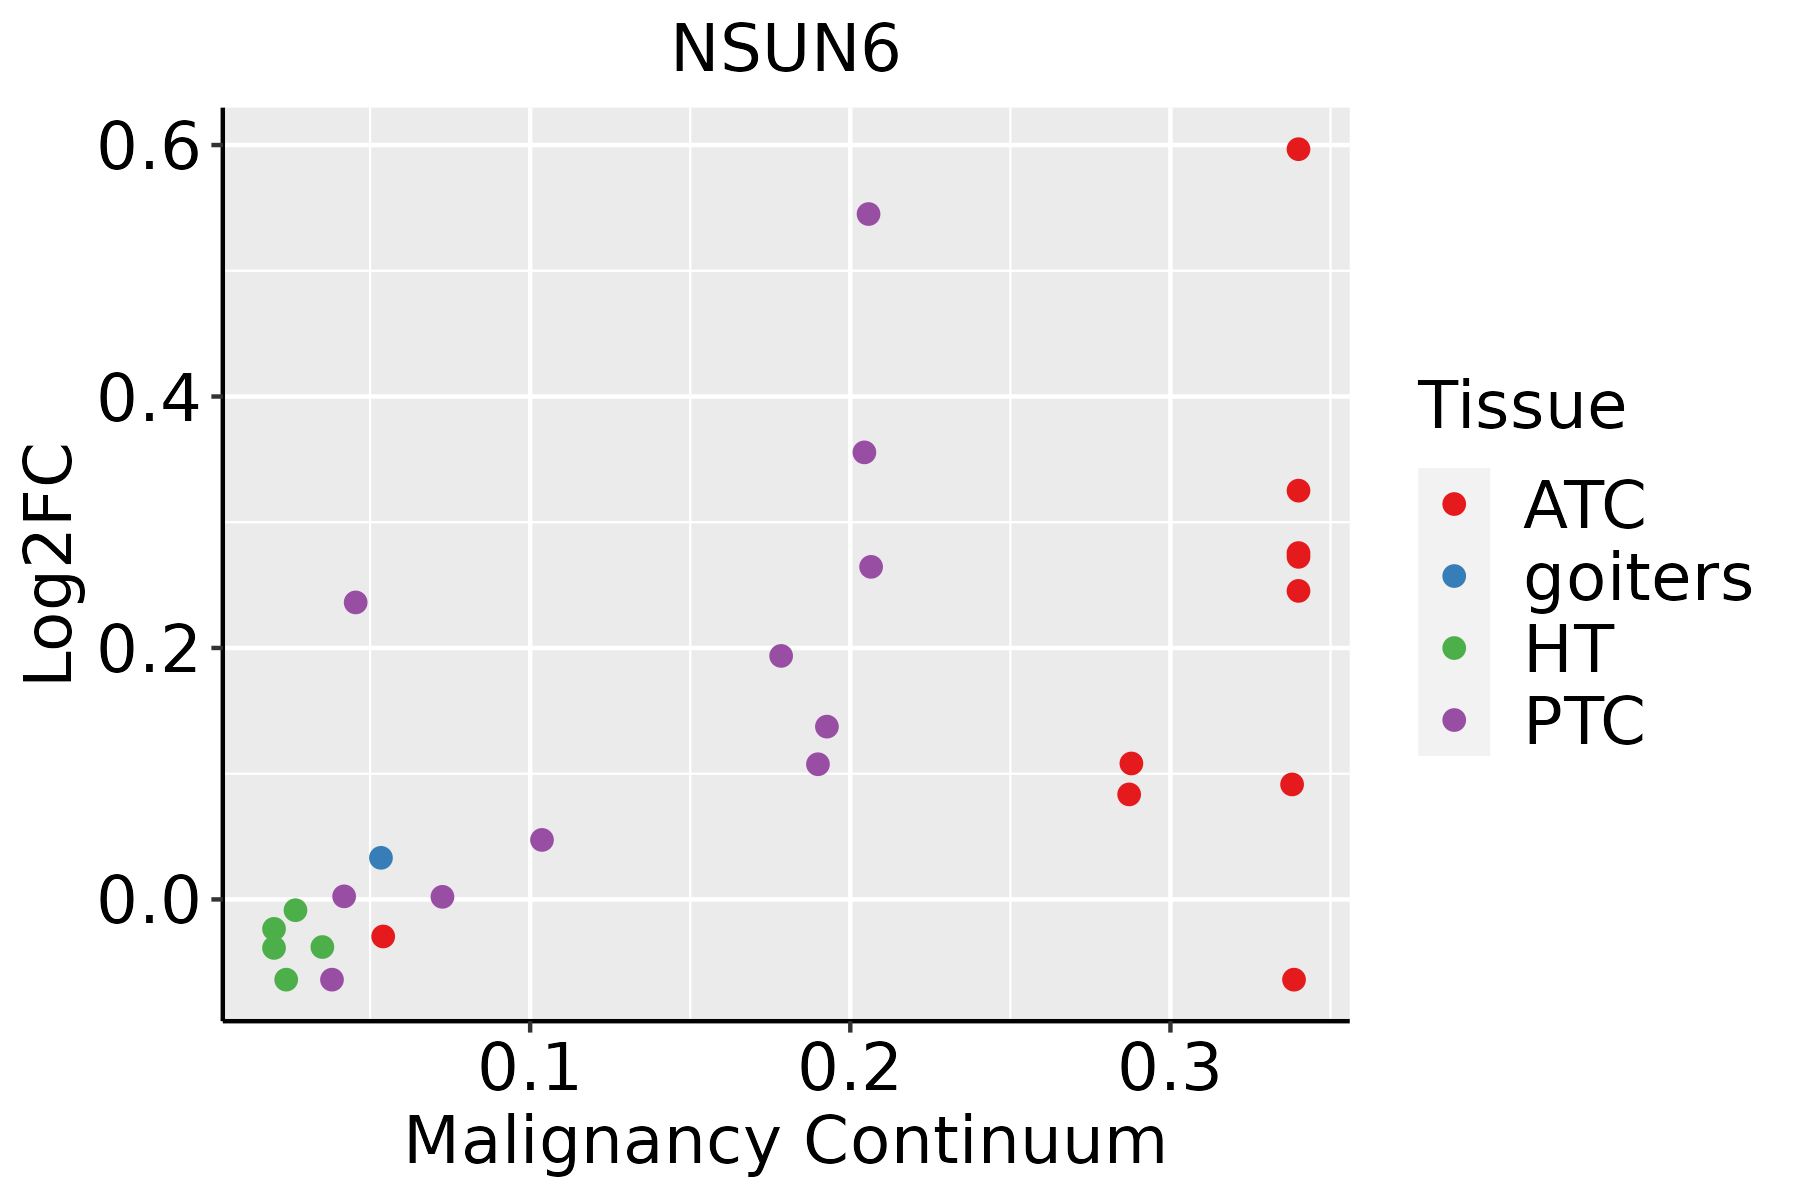 | ATC: Anaplastic thyroid cancer |
| HT: Hashimoto's thyroiditis | ||
| PTC: Papillary thyroid cancer |
| ∗log2FC in expression of this searched gene in stem-like cells from each diseased tissue sample relative to stem-like cells in normal samples in each tissue plotted against the malignancy continuum. Samples are colored based on if they are from different disease stage. |
Top |
Malignant transformation related pathway analysis |
| Find out the enriched GO biological processes and KEGG pathways involved in transition from healthy to precancer to cancer |
| Tissue | Disease Stage | Enriched GO biological Processes |
| Colorectum | AD |  |
| Colorectum | SER |  |
| Colorectum | MSS |  |
| Colorectum | MSI-H |  |
| Colorectum | FAP |  |
| ∗Top 15 enriched GO BP terms are showed in the bar plot of each disease state in each tissue. Each row represents a significant GO biological process which is colored according to the -log10(p.adjust). |
| Page: 1 2 3 4 5 6 7 8 9 |
| GO ID | Tissue | Disease Stage | Description | Gene Ratio | Bg Ratio | pvalue | p.adjust | Count |
| GO:003447010 | Esophagus | HGIN | ncRNA processing | 97/2587 | 395/18723 | 5.92e-09 | 3.90e-07 | 97 |
| GO:00346606 | Esophagus | HGIN | ncRNA metabolic process | 104/2587 | 485/18723 | 2.26e-06 | 8.23e-05 | 104 |
| GO:003447015 | Esophagus | ESCC | ncRNA processing | 300/8552 | 395/18723 | 3.09e-35 | 3.26e-32 | 300 |
| GO:003466012 | Esophagus | ESCC | ncRNA metabolic process | 346/8552 | 485/18723 | 4.35e-31 | 2.51e-28 | 346 |
| GO:00434143 | Esophagus | ESCC | macromolecule methylation | 199/8552 | 316/18723 | 3.44e-10 | 9.57e-09 | 199 |
| GO:00080333 | Esophagus | ESCC | tRNA processing | 92/8552 | 127/18723 | 7.83e-10 | 1.93e-08 | 92 |
| GO:00063992 | Esophagus | ESCC | tRNA metabolic process | 122/8552 | 179/18723 | 9.03e-10 | 2.19e-08 | 122 |
| GO:00322592 | Esophagus | ESCC | methylation | 222/8552 | 364/18723 | 2.26e-09 | 5.09e-08 | 222 |
| GO:00094512 | Esophagus | ESCC | RNA modification | 114/8552 | 167/18723 | 2.76e-09 | 6.04e-08 | 114 |
| GO:00015101 | Esophagus | ESCC | RNA methylation | 58/8552 | 83/18723 | 6.87e-06 | 6.94e-05 | 58 |
| GO:00064002 | Esophagus | ESCC | tRNA modification | 62/8552 | 90/18723 | 7.02e-06 | 7.04e-05 | 62 |
| GO:00304881 | Esophagus | ESCC | tRNA methylation | 30/8552 | 41/18723 | 3.27e-04 | 1.93e-03 | 30 |
| GO:00344704 | Liver | NAFLD | ncRNA processing | 57/1882 | 395/18723 | 3.34e-03 | 2.93e-02 | 57 |
| GO:0043414 | Liver | NAFLD | macromolecule methylation | 47/1882 | 316/18723 | 4.08e-03 | 3.41e-02 | 47 |
| GO:00344701 | Liver | Cirrhotic | ncRNA processing | 158/4634 | 395/18723 | 1.09e-11 | 6.96e-10 | 158 |
| GO:00346603 | Liver | Cirrhotic | ncRNA metabolic process | 173/4634 | 485/18723 | 3.64e-08 | 1.21e-06 | 173 |
| GO:00344702 | Liver | HCC | ncRNA processing | 293/7958 | 395/18723 | 4.26e-38 | 6.76e-35 | 293 |
| GO:00346601 | Liver | HCC | ncRNA metabolic process | 332/7958 | 485/18723 | 1.48e-31 | 7.80e-29 | 332 |
| GO:0008033 | Liver | HCC | tRNA processing | 87/7958 | 127/18723 | 2.66e-09 | 7.23e-08 | 87 |
| GO:00434141 | Liver | HCC | macromolecule methylation | 183/7958 | 316/18723 | 2.00e-08 | 4.72e-07 | 183 |
| Page: 1 2 |
| Pathway ID | Tissue | Disease Stage | Description | Gene Ratio | Bg Ratio | pvalue | p.adjust | qvalue | Count |
| Page: 1 |
Top |
Cell-cell communication analysis |
| Identification of potential cell-cell interactions between two cell types and their ligand-receptor pairs for different disease states |
| Ligand | Receptor | LRpair | Pathway | Tissue | Disease Stage |
| Page: 1 |
Top |
Single-cell gene regulatory network inference analysis |
| Find out the significant the regulons (TFs) and the target genes of each regulon across cell types for different disease states |
| TF | Cell Type | Tissue | Disease Stage | Target Gene | RSS | Regulon Activity |
| ∗The dot plots of a searched regulon are shown for all cell subpopulations in each disease state of each tissue based on the regulon specific score inferred using pySCENIC and by calculating the average expression. |
| Page: 1 |
Top |
Somatic mutation of malignant transformation related genes |
| Annotation of somatic variants for genes involved in malignant transformation |
| Hugo Symbol | Variant Class | Variant Classification | dbSNP RS | HGVSc | HGVSp | HGVSp Short | SWISSPROT | BIOTYPE | SIFT | PolyPhen | Tumor Sample Barcode | Tissue | Histology | Sex | Age | Stage | Therapy Types | Drugs | Outcome |
| NSUN6 | SNV | Missense_Mutation | c.265C>T | p.His89Tyr | p.H89Y | Q8TEA1 | protein_coding | deleterious(0) | possibly_damaging(0.892) | TCGA-A8-A06R-01 | Breast | breast invasive carcinoma | Female | >=65 | I/II | Chemotherapy | 5-fluorouracil | CR | |
| NSUN6 | SNV | Missense_Mutation | c.496N>C | p.Asp166His | p.D166H | Q8TEA1 | protein_coding | deleterious(0.05) | benign(0.326) | TCGA-C8-A26Y-01 | Breast | breast invasive carcinoma | Female | >=65 | I/II | Unknown | Unknown | SD | |
| NSUN6 | SNV | Missense_Mutation | novel | c.1304A>G | p.Asp435Gly | p.D435G | Q8TEA1 | protein_coding | deleterious(0.04) | possibly_damaging(0.76) | TCGA-2W-A8YY-01 | Cervix | cervical & endocervical cancer | Female | <65 | I/II | Chemotherapy | cisplatin | CR |
| NSUN6 | SNV | Missense_Mutation | rs776437135 | c.1135N>A | p.Glu379Lys | p.E379K | Q8TEA1 | protein_coding | deleterious(0) | probably_damaging(0.997) | TCGA-AA-3510-01 | Colorectum | colon adenocarcinoma | Male | >=65 | I/II | Unknown | Unknown | SD |
| NSUN6 | SNV | Missense_Mutation | c.406N>A | p.Val136Met | p.V136M | Q8TEA1 | protein_coding | tolerated(0.27) | benign(0.007) | TCGA-CM-5861-01 | Colorectum | colon adenocarcinoma | Female | <65 | I/II | Unknown | Unknown | PD | |
| NSUN6 | SNV | Missense_Mutation | novel | c.29N>A | p.Arg10Lys | p.R10K | Q8TEA1 | protein_coding | tolerated(0.53) | benign(0.005) | TCGA-AG-A002-01 | Colorectum | rectum adenocarcinoma | Male | <65 | I/II | Unknown | Unknown | SD |
| NSUN6 | SNV | Missense_Mutation | novel | c.1364N>A | p.Ser455Tyr | p.S455Y | Q8TEA1 | protein_coding | deleterious(0.01) | possibly_damaging(0.492) | TCGA-A5-A1OF-01 | Endometrium | uterine corpus endometrioid carcinoma | Female | <65 | I/II | Unknown | Unknown | SD |
| NSUN6 | SNV | Missense_Mutation | novel | c.305N>A | p.Gly102Glu | p.G102E | Q8TEA1 | protein_coding | tolerated(0.07) | benign(0.189) | TCGA-A5-A1OF-01 | Endometrium | uterine corpus endometrioid carcinoma | Female | <65 | I/II | Unknown | Unknown | SD |
| NSUN6 | SNV | Missense_Mutation | novel | c.778N>A | p.Gly260Arg | p.G260R | Q8TEA1 | protein_coding | deleterious(0) | probably_damaging(1) | TCGA-A5-A1OH-01 | Endometrium | uterine corpus endometrioid carcinoma | Female | >=65 | III/IV | Chemotherapy | carboplatin | CR |
| NSUN6 | SNV | Missense_Mutation | novel | c.1301N>T | p.Thr434Ile | p.T434I | Q8TEA1 | protein_coding | tolerated(0.44) | benign(0) | TCGA-AJ-A3EK-01 | Endometrium | uterine corpus endometrioid carcinoma | Female | <65 | I/II | Chemotherapy | carboplatin | CR |
| Page: 1 2 3 4 5 6 |
Top |
Related drugs of malignant transformation related genes |
| Identification of chemicals and drugs interact with genes involved in malignant transfromation |
| (DGIdb 4.0) |
| Entrez ID | Symbol | Category | Interaction Types | Drug Claim Name | Drug Name | PMIDs |
| Page: 1 |

Copyright 2023-Present -The University of Texas Health Science Center at Houston |