
|
|||||
|
 | |
| |
| |
| |
| |
| |
|
Gene: NSRP1 |
Gene summary for NSRP1 |
| Gene information | Species | Human | Gene symbol | NSRP1 | Gene ID | 84081 |
| Gene name | nuclear speckle splicing regulatory protein 1 | |
| Gene Alias | CCDC55 | |
| Cytomap | 17q11.2 | |
| Gene Type | protein-coding | GO ID | GO:0000375 | UniProtAcc | A0A024QZ33 |
Top |
Malignant transformation analysis |
| Identification of the aberrant gene expression in precancerous and cancerous lesions by comparing the gene expression of stem-like cells in diseased tissues with normal stem cells |
| Entrez ID | Symbol | Replicates | Species | Organ | Tissue | Adj P-value | Log2FC | Malignancy |
| 84081 | NSRP1 | LZE2T | Human | Esophagus | ESCC | 5.57e-03 | 5.59e-02 | 0.082 |
| 84081 | NSRP1 | LZE4T | Human | Esophagus | ESCC | 8.67e-11 | 2.40e-01 | 0.0811 |
| 84081 | NSRP1 | LZE7T | Human | Esophagus | ESCC | 2.63e-06 | 3.53e-01 | 0.0667 |
| 84081 | NSRP1 | LZE8T | Human | Esophagus | ESCC | 4.03e-06 | 6.01e-02 | 0.067 |
| 84081 | NSRP1 | LZE20T | Human | Esophagus | ESCC | 3.79e-05 | -4.57e-02 | 0.0662 |
| 84081 | NSRP1 | LZE22D1 | Human | Esophagus | HGIN | 4.97e-02 | 8.66e-02 | 0.0595 |
| 84081 | NSRP1 | LZE22T | Human | Esophagus | ESCC | 1.19e-04 | 3.88e-01 | 0.068 |
| 84081 | NSRP1 | LZE24T | Human | Esophagus | ESCC | 2.23e-14 | 4.68e-01 | 0.0596 |
| 84081 | NSRP1 | LZE22D3 | Human | Esophagus | HGIN | 8.94e-04 | 2.08e-01 | 0.0653 |
| 84081 | NSRP1 | LZE21T | Human | Esophagus | ESCC | 6.12e-04 | 2.22e-01 | 0.0655 |
| 84081 | NSRP1 | LZE6T | Human | Esophagus | ESCC | 1.54e-07 | 4.23e-03 | 0.0845 |
| 84081 | NSRP1 | P1T-E | Human | Esophagus | ESCC | 9.90e-03 | 3.21e-01 | 0.0875 |
| 84081 | NSRP1 | P2T-E | Human | Esophagus | ESCC | 2.62e-17 | 2.90e-01 | 0.1177 |
| 84081 | NSRP1 | P4T-E | Human | Esophagus | ESCC | 1.20e-20 | 3.84e-01 | 0.1323 |
| 84081 | NSRP1 | P5T-E | Human | Esophagus | ESCC | 1.73e-18 | 2.04e-01 | 0.1327 |
| 84081 | NSRP1 | P8T-E | Human | Esophagus | ESCC | 2.15e-23 | 4.79e-01 | 0.0889 |
| 84081 | NSRP1 | P9T-E | Human | Esophagus | ESCC | 2.53e-15 | 3.91e-01 | 0.1131 |
| 84081 | NSRP1 | P10T-E | Human | Esophagus | ESCC | 1.42e-11 | 2.22e-01 | 0.116 |
| 84081 | NSRP1 | P11T-E | Human | Esophagus | ESCC | 7.02e-08 | 4.51e-01 | 0.1426 |
| 84081 | NSRP1 | P12T-E | Human | Esophagus | ESCC | 1.17e-15 | 3.56e-01 | 0.1122 |
| Page: 1 2 3 4 5 6 7 |
| Tissue | Expression Dynamics | Abbreviation |
| Esophagus | 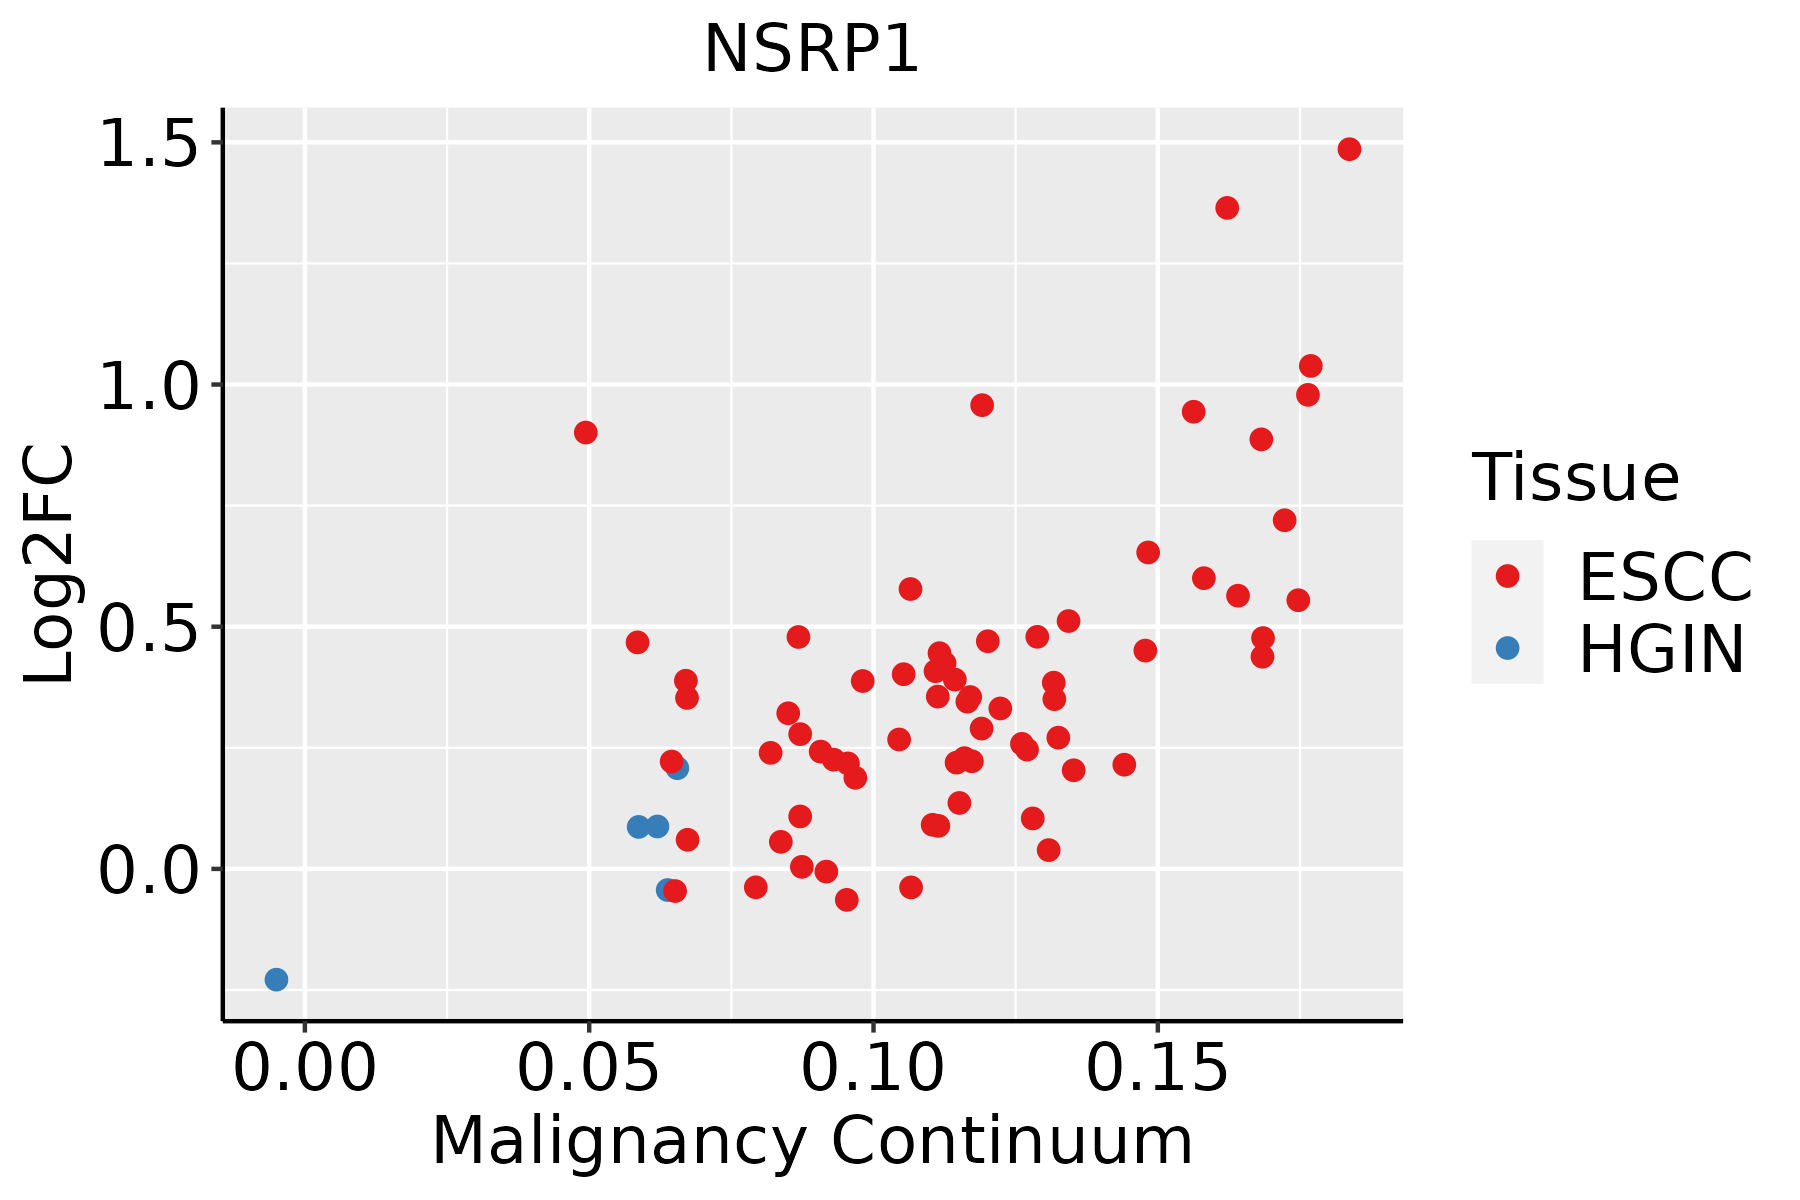 | ESCC: Esophageal squamous cell carcinoma |
| HGIN: High-grade intraepithelial neoplasias | ||
| LGIN: Low-grade intraepithelial neoplasias | ||
| Liver |  | HCC: Hepatocellular carcinoma |
| NAFLD: Non-alcoholic fatty liver disease | ||
| Lung | 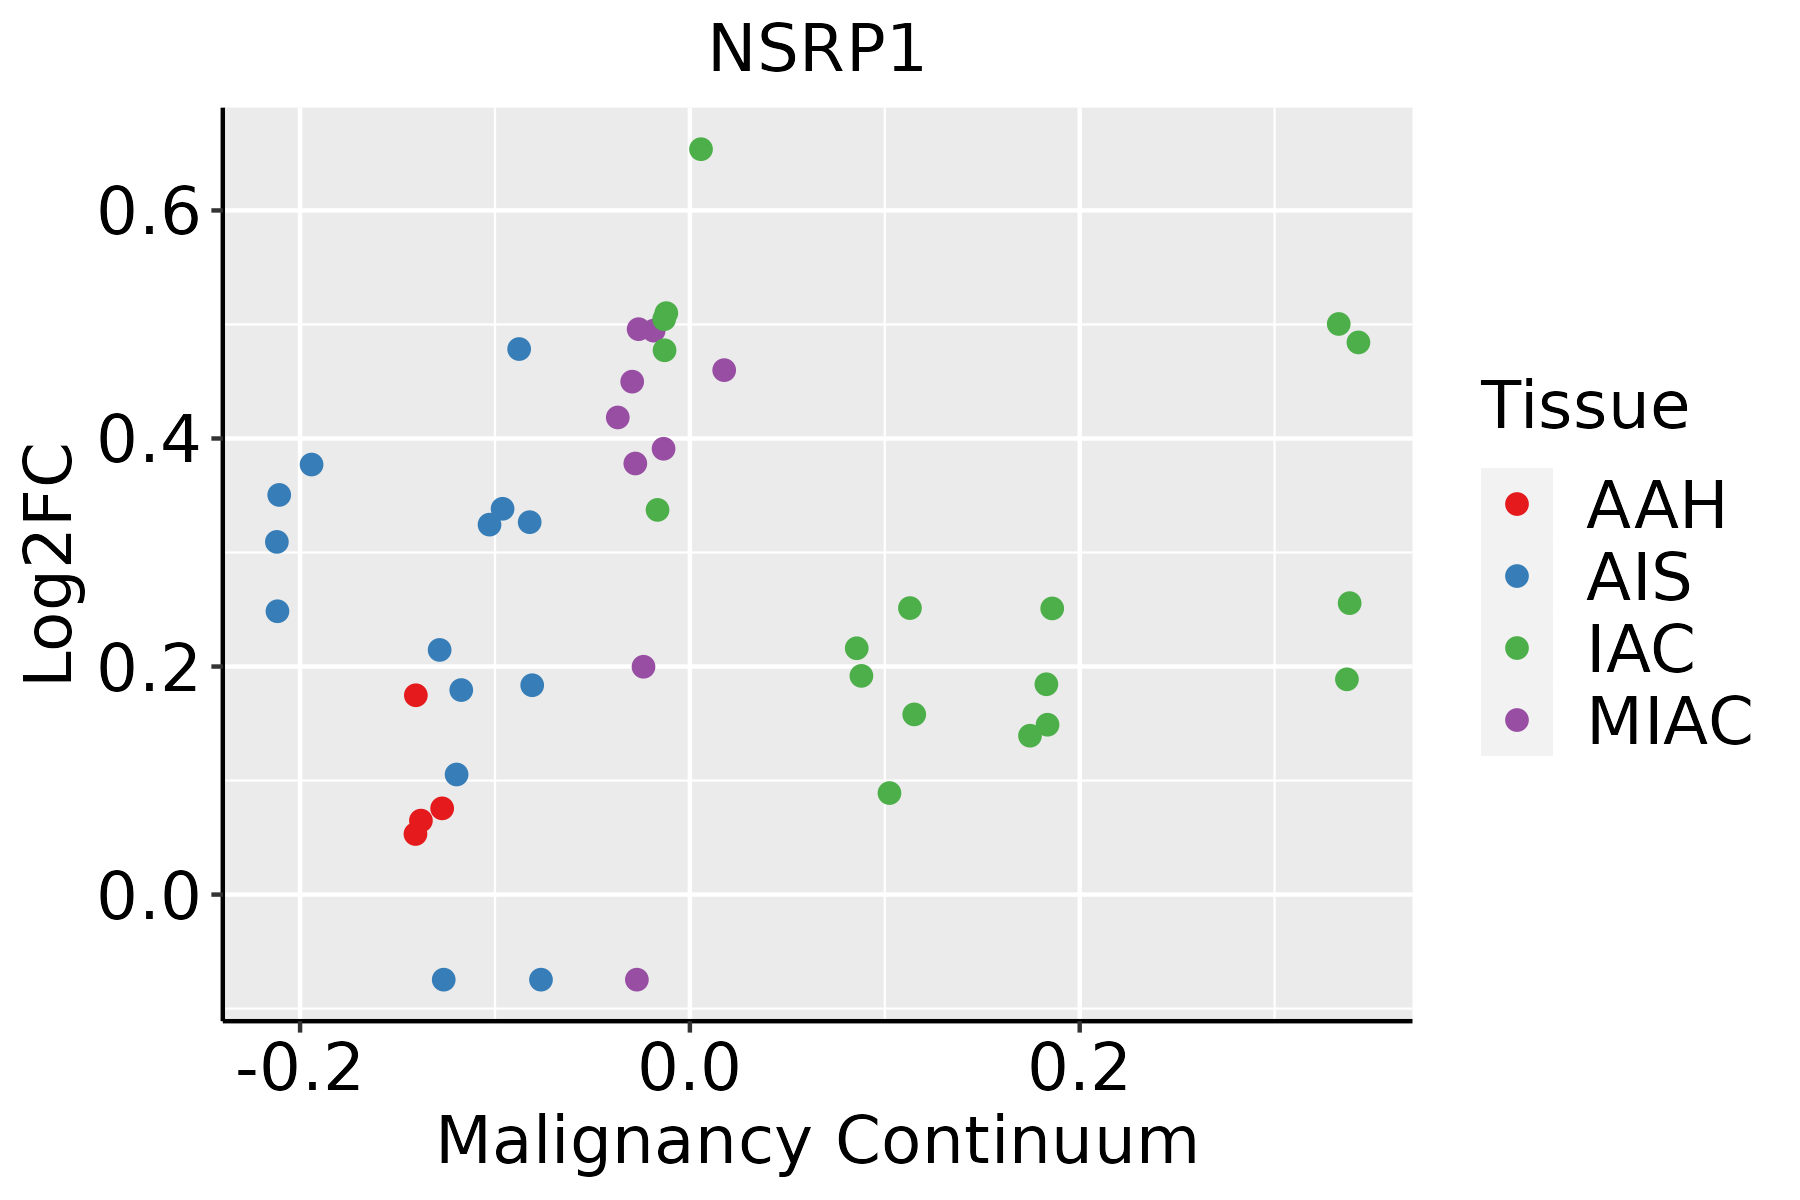 | AAH: Atypical adenomatous hyperplasia |
| AIS: Adenocarcinoma in situ | ||
| IAC: Invasive lung adenocarcinoma | ||
| MIA: Minimally invasive adenocarcinoma | ||
| Oral Cavity | 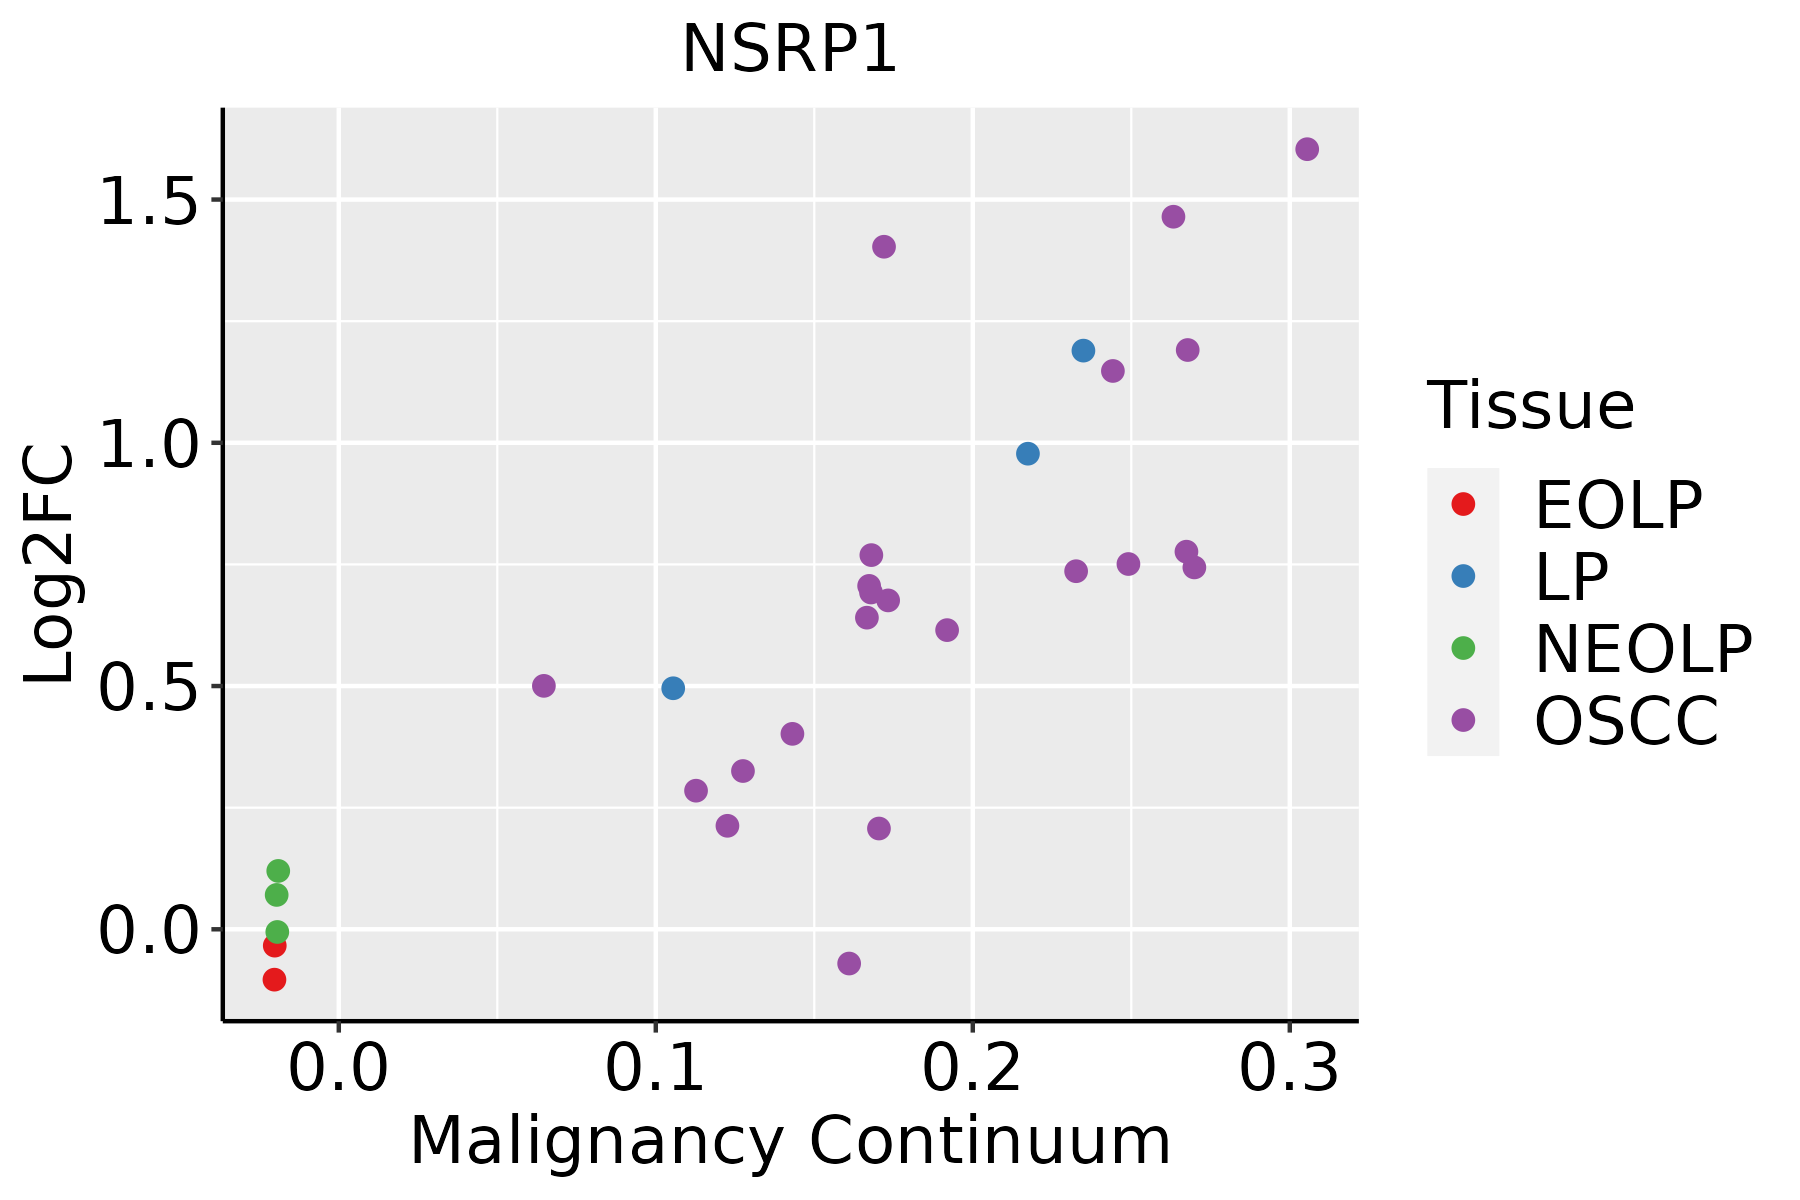 | EOLP: Erosive Oral lichen planus |
| LP: leukoplakia | ||
| NEOLP: Non-erosive oral lichen planus | ||
| OSCC: Oral squamous cell carcinoma | ||
| Skin | 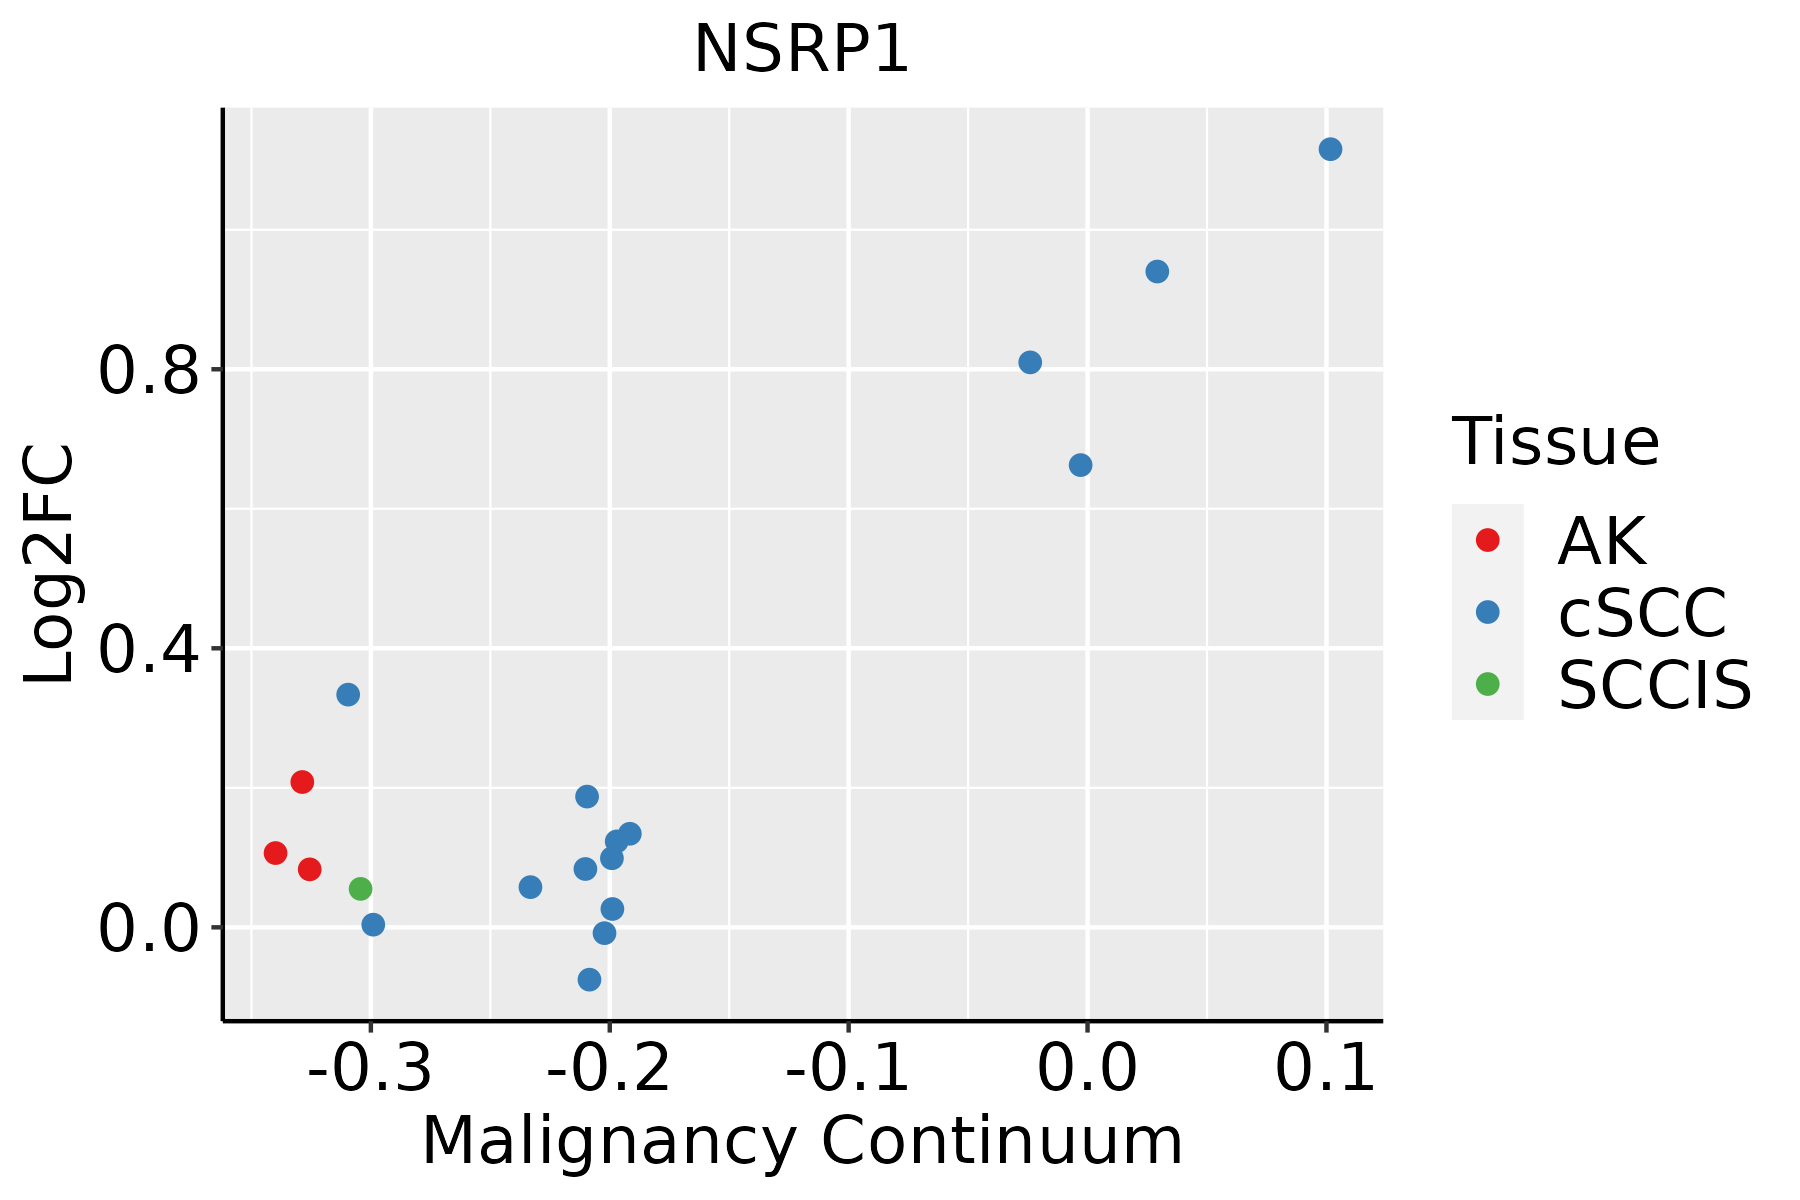 | AK: Actinic keratosis |
| cSCC: Cutaneous squamous cell carcinoma | ||
| SCCIS:squamous cell carcinoma in situ | ||
| Thyroid | 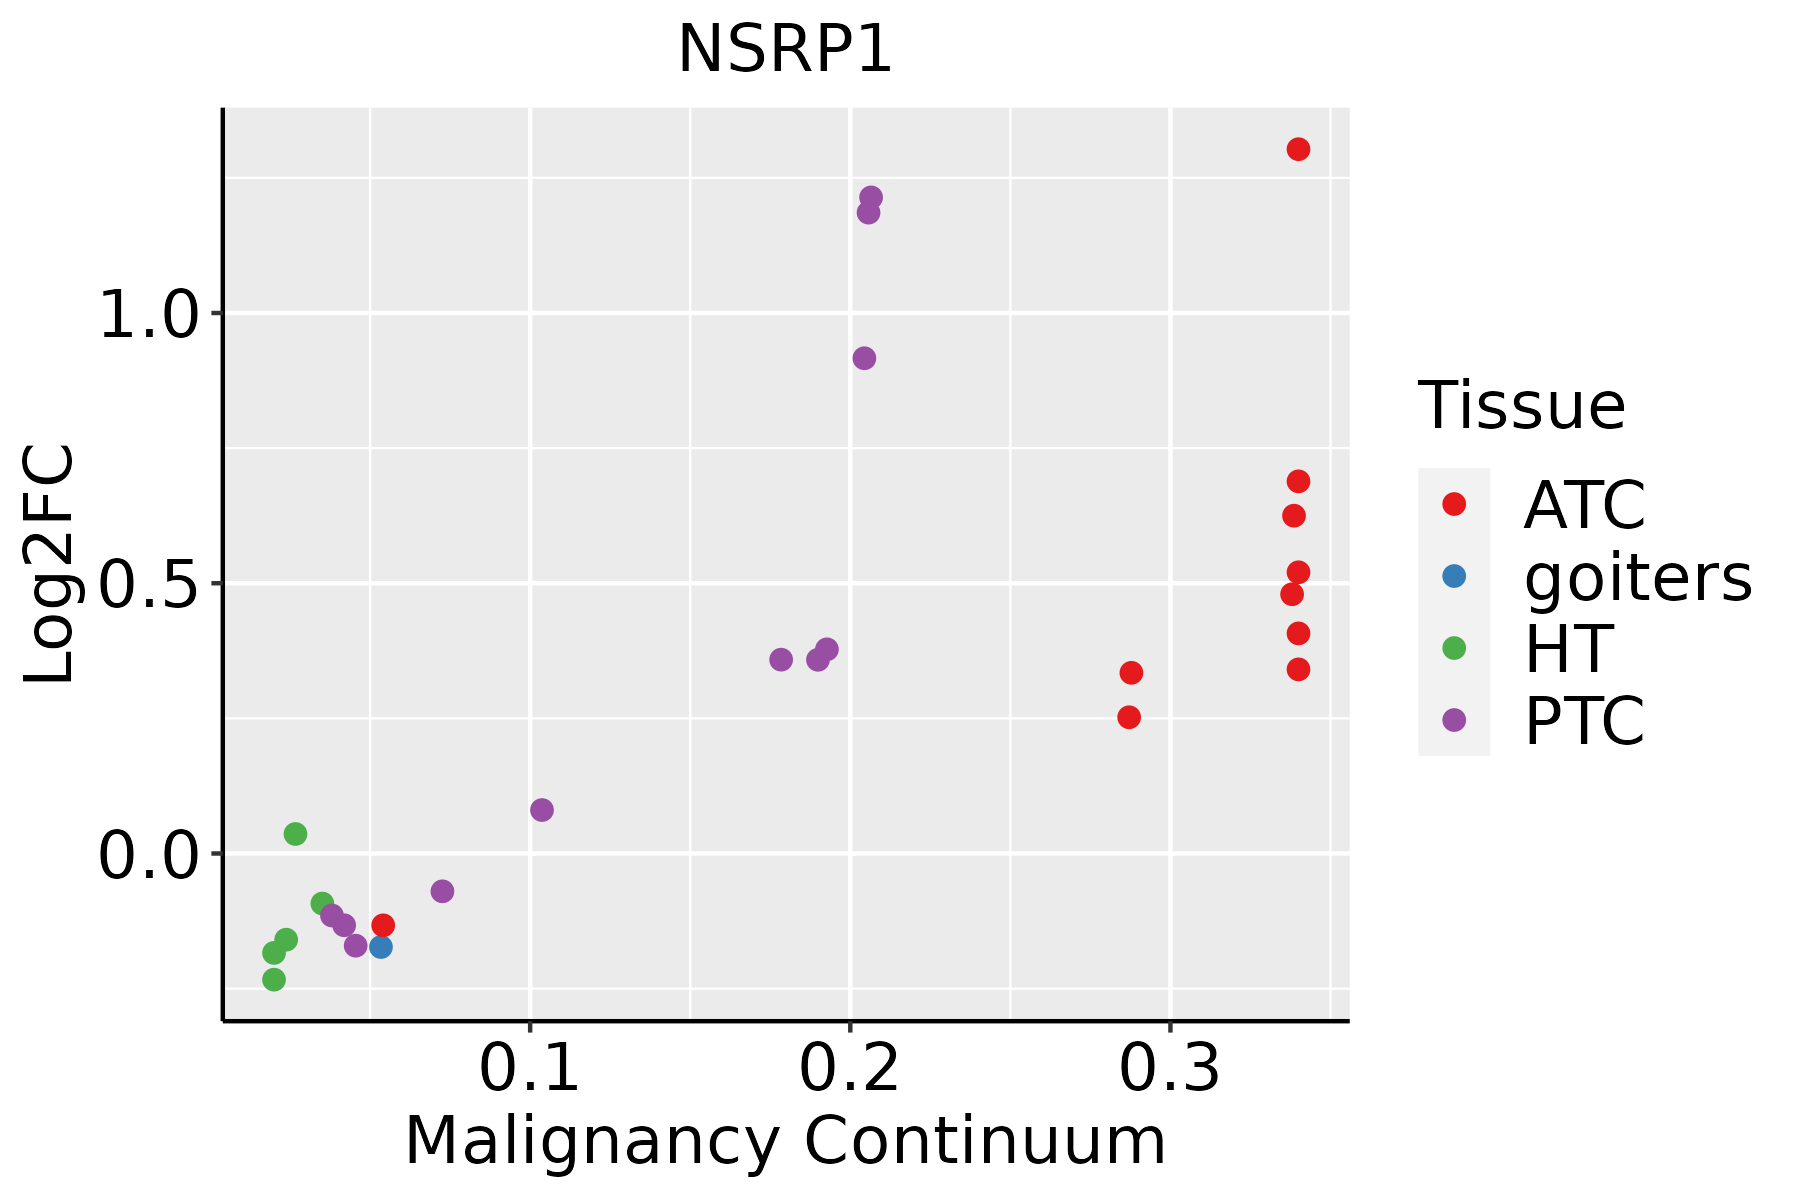 | ATC: Anaplastic thyroid cancer |
| HT: Hashimoto's thyroiditis | ||
| PTC: Papillary thyroid cancer |
| ∗log2FC in expression of this searched gene in stem-like cells from each diseased tissue sample relative to stem-like cells in normal samples in each tissue plotted against the malignancy continuum. Samples are colored based on if they are from different disease stage. |
Top |
Malignant transformation related pathway analysis |
| Find out the enriched GO biological processes and KEGG pathways involved in transition from healthy to precancer to cancer |
| Tissue | Disease Stage | Enriched GO biological Processes |
| Colorectum | AD |  |
| Colorectum | SER |  |
| Colorectum | MSS |  |
| Colorectum | MSI-H |  |
| Colorectum | FAP |  |
| ∗Top 15 enriched GO BP terms are showed in the bar plot of each disease state in each tissue. Each row represents a significant GO biological process which is colored according to the -log10(p.adjust). |
| Page: 1 2 3 4 5 6 7 8 9 |
| GO ID | Tissue | Disease Stage | Description | Gene Ratio | Bg Ratio | pvalue | p.adjust | Count |
| GO:000838026 | Esophagus | HGIN | RNA splicing | 160/2587 | 434/18723 | 3.74e-34 | 1.12e-30 | 160 |
| GO:000037520 | Esophagus | HGIN | RNA splicing, via transesterification reactions | 115/2587 | 324/18723 | 3.16e-23 | 3.80e-20 | 115 |
| GO:000037720 | Esophagus | HGIN | RNA splicing, via transesterification reactions with bulged adenosine as nucleophile | 113/2587 | 320/18723 | 1.24e-22 | 9.26e-20 | 113 |
| GO:000039820 | Esophagus | HGIN | mRNA splicing, via spliceosome | 113/2587 | 320/18723 | 1.24e-22 | 9.26e-20 | 113 |
| GO:004348427 | Esophagus | HGIN | regulation of RNA splicing | 59/2587 | 148/18723 | 3.61e-15 | 7.22e-13 | 59 |
| GO:190331120 | Esophagus | HGIN | regulation of mRNA metabolic process | 91/2587 | 288/18723 | 5.06e-15 | 9.78e-13 | 91 |
| GO:005068419 | Esophagus | HGIN | regulation of mRNA processing | 55/2587 | 137/18723 | 2.17e-14 | 3.94e-12 | 55 |
| GO:004802426 | Esophagus | HGIN | regulation of mRNA splicing, via spliceosome | 42/2587 | 101/18723 | 6.35e-12 | 7.78e-10 | 42 |
| GO:000038018 | Esophagus | HGIN | alternative mRNA splicing, via spliceosome | 32/2587 | 77/18723 | 2.06e-09 | 1.54e-07 | 32 |
| GO:000038118 | Esophagus | HGIN | regulation of alternative mRNA splicing, via spliceosome | 22/2587 | 60/18723 | 7.92e-06 | 2.40e-04 | 22 |
| GO:000170118 | Esophagus | HGIN | in utero embryonic development | 77/2587 | 367/18723 | 9.56e-05 | 2.05e-03 | 77 |
| GO:0008380111 | Esophagus | ESCC | RNA splicing | 336/8552 | 434/18723 | 1.74e-42 | 3.67e-39 | 336 |
| GO:0000375111 | Esophagus | ESCC | RNA splicing, via transesterification reactions | 248/8552 | 324/18723 | 3.05e-30 | 1.49e-27 | 248 |
| GO:0000377111 | Esophagus | ESCC | RNA splicing, via transesterification reactions with bulged adenosine as nucleophile | 244/8552 | 320/18723 | 2.52e-29 | 1.07e-26 | 244 |
| GO:0000398111 | Esophagus | ESCC | mRNA splicing, via spliceosome | 244/8552 | 320/18723 | 2.52e-29 | 1.07e-26 | 244 |
| GO:1903311110 | Esophagus | ESCC | regulation of mRNA metabolic process | 210/8552 | 288/18723 | 3.25e-21 | 5.56e-19 | 210 |
| GO:0043484111 | Esophagus | ESCC | regulation of RNA splicing | 116/8552 | 148/18723 | 3.18e-16 | 2.38e-14 | 116 |
| GO:0050684110 | Esophagus | ESCC | regulation of mRNA processing | 109/8552 | 137/18723 | 3.51e-16 | 2.59e-14 | 109 |
| GO:000170119 | Esophagus | ESCC | in utero embryonic development | 243/8552 | 367/18723 | 1.00e-15 | 6.86e-14 | 243 |
| GO:0048024111 | Esophagus | ESCC | regulation of mRNA splicing, via spliceosome | 78/8552 | 101/18723 | 8.72e-11 | 2.66e-09 | 78 |
| Page: 1 2 3 4 5 6 7 8 9 |
| Pathway ID | Tissue | Disease Stage | Description | Gene Ratio | Bg Ratio | pvalue | p.adjust | qvalue | Count |
| Page: 1 |
Top |
Cell-cell communication analysis |
| Identification of potential cell-cell interactions between two cell types and their ligand-receptor pairs for different disease states |
| Ligand | Receptor | LRpair | Pathway | Tissue | Disease Stage |
| Page: 1 |
Top |
Single-cell gene regulatory network inference analysis |
| Find out the significant the regulons (TFs) and the target genes of each regulon across cell types for different disease states |
| TF | Cell Type | Tissue | Disease Stage | Target Gene | RSS | Regulon Activity |
| ∗The dot plots of a searched regulon are shown for all cell subpopulations in each disease state of each tissue based on the regulon specific score inferred using pySCENIC and by calculating the average expression. |
| Page: 1 |
Top |
Somatic mutation of malignant transformation related genes |
| Annotation of somatic variants for genes involved in malignant transformation |
| Hugo Symbol | Variant Class | Variant Classification | dbSNP RS | HGVSc | HGVSp | HGVSp Short | SWISSPROT | BIOTYPE | SIFT | PolyPhen | Tumor Sample Barcode | Tissue | Histology | Sex | Age | Stage | Therapy Types | Drugs | Outcome |
| NSRP1 | SNV | Missense_Mutation | c.1672N>C | p.Asp558His | p.D558H | Q9H0G5 | protein_coding | deleterious(0) | probably_damaging(0.962) | TCGA-3C-AALI-01 | Breast | breast invasive carcinoma | Female | <65 | I/II | Unspecific | Poly E | Complete Response | |
| NSRP1 | SNV | Missense_Mutation | rs146547631 | c.868N>T | p.Arg290Trp | p.R290W | Q9H0G5 | protein_coding | deleterious(0.01) | benign(0.001) | TCGA-D8-A1XL-01 | Breast | breast invasive carcinoma | Female | <65 | I/II | Chemotherapy | doxorubicine+cyclophosphamide+tamoxifen | SD |
| NSRP1 | insertion | In_Frame_Ins | novel | c.732_733insAAG | p.Pro244_Asp245insLys | p.P244_D245insK | Q9H0G5 | protein_coding | TCGA-AC-A8OP-01 | Breast | breast invasive carcinoma | Female | >=65 | I/II | Unknown | Unknown | SD | ||
| NSRP1 | SNV | Missense_Mutation | novel | c.991N>A | p.His331Asn | p.H331N | Q9H0G5 | protein_coding | tolerated(0.27) | benign(0.014) | TCGA-C5-A1BK-01 | Cervix | cervical & endocervical cancer | Female | <65 | I/II | Unknown | Unknown | SD |
| NSRP1 | SNV | Missense_Mutation | novel | c.1585G>A | p.Glu529Lys | p.E529K | Q9H0G5 | protein_coding | tolerated(0.07) | benign(0.003) | TCGA-JW-A5VL-01 | Cervix | cervical & endocervical cancer | Female | <65 | I/II | Unknown | Unknown | SD |
| NSRP1 | SNV | Missense_Mutation | c.412N>C | p.Asp138His | p.D138H | Q9H0G5 | protein_coding | deleterious(0.02) | possibly_damaging(0.601) | TCGA-Q1-A73O-01 | Cervix | cervical & endocervical cancer | Female | <65 | I/II | Chemotherapy | cisplatin | CR | |
| NSRP1 | SNV | Missense_Mutation | c.7N>G | p.Ile3Val | p.I3V | Q9H0G5 | protein_coding | tolerated(0.44) | benign(0.005) | TCGA-A6-4105-01 | Colorectum | colon adenocarcinoma | Male | >=65 | I/II | Unknown | Unknown | PD | |
| NSRP1 | SNV | Missense_Mutation | c.1660G>C | p.Glu554Gln | p.E554Q | Q9H0G5 | protein_coding | deleterious(0) | possibly_damaging(0.707) | TCGA-AA-3966-01 | Colorectum | colon adenocarcinoma | Female | >=65 | I/II | Unknown | Unknown | SD | |
| NSRP1 | SNV | Missense_Mutation | rs372875096 | c.923N>A | p.Arg308Gln | p.R308Q | Q9H0G5 | protein_coding | tolerated(0.2) | benign(0.001) | TCGA-AZ-4315-01 | Colorectum | colon adenocarcinoma | Male | <65 | I/II | Unknown | Unknown | SD |
| NSRP1 | SNV | Missense_Mutation | novel | c.395N>C | p.Met132Thr | p.M132T | Q9H0G5 | protein_coding | tolerated(0.09) | benign(0.285) | TCGA-CA-6717-01 | Colorectum | colon adenocarcinoma | Male | <65 | I/II | Chemotherapy | oxaliplatin | CR |
| Page: 1 2 3 4 5 6 |
Top |
Related drugs of malignant transformation related genes |
| Identification of chemicals and drugs interact with genes involved in malignant transfromation |
| (DGIdb 4.0) |
| Entrez ID | Symbol | Category | Interaction Types | Drug Claim Name | Drug Name | PMIDs |
| Page: 1 |

Copyright 2023-Present -The University of Texas Health Science Center at Houston |