
|
|||||
|
 | |
| |
| |
| |
| |
| |
|
Gene: NSMF |
Gene summary for NSMF |
| Gene information | Species | Human | Gene symbol | NSMF | Gene ID | 26012 |
| Gene name | NMDA receptor synaptonuclear signaling and neuronal migration factor | |
| Gene Alias | HH9 | |
| Cytomap | 9q34.3 | |
| Gene Type | protein-coding | GO ID | GO:0000902 | UniProtAcc | Q6X4W1 |
Top |
Malignant transformation analysis |
| Identification of the aberrant gene expression in precancerous and cancerous lesions by comparing the gene expression of stem-like cells in diseased tissues with normal stem cells |
| Entrez ID | Symbol | Replicates | Species | Organ | Tissue | Adj P-value | Log2FC | Malignancy |
| 26012 | NSMF | LZE21T | Human | Esophagus | ESCC | 3.18e-04 | 2.35e-01 | 0.0655 |
| 26012 | NSMF | P1T-E | Human | Esophagus | ESCC | 7.51e-04 | 1.20e-01 | 0.0875 |
| 26012 | NSMF | P2T-E | Human | Esophagus | ESCC | 3.83e-13 | 1.92e-01 | 0.1177 |
| 26012 | NSMF | P4T-E | Human | Esophagus | ESCC | 3.88e-05 | 1.52e-01 | 0.1323 |
| 26012 | NSMF | P5T-E | Human | Esophagus | ESCC | 5.61e-05 | 8.85e-02 | 0.1327 |
| 26012 | NSMF | P8T-E | Human | Esophagus | ESCC | 6.22e-04 | 1.08e-01 | 0.0889 |
| 26012 | NSMF | P9T-E | Human | Esophagus | ESCC | 4.87e-09 | 7.13e-02 | 0.1131 |
| 26012 | NSMF | P10T-E | Human | Esophagus | ESCC | 2.09e-02 | 4.10e-02 | 0.116 |
| 26012 | NSMF | P12T-E | Human | Esophagus | ESCC | 8.58e-05 | 4.17e-02 | 0.1122 |
| 26012 | NSMF | P15T-E | Human | Esophagus | ESCC | 8.62e-05 | 4.68e-02 | 0.1149 |
| 26012 | NSMF | P16T-E | Human | Esophagus | ESCC | 1.40e-04 | 3.65e-02 | 0.1153 |
| 26012 | NSMF | P21T-E | Human | Esophagus | ESCC | 3.05e-11 | 2.35e-01 | 0.1617 |
| 26012 | NSMF | P22T-E | Human | Esophagus | ESCC | 4.30e-12 | 1.54e-01 | 0.1236 |
| 26012 | NSMF | P24T-E | Human | Esophagus | ESCC | 3.06e-03 | 1.08e-01 | 0.1287 |
| 26012 | NSMF | P26T-E | Human | Esophagus | ESCC | 5.12e-06 | 6.67e-02 | 0.1276 |
| 26012 | NSMF | P27T-E | Human | Esophagus | ESCC | 1.85e-02 | 1.09e-02 | 0.1055 |
| 26012 | NSMF | P28T-E | Human | Esophagus | ESCC | 9.93e-30 | 5.77e-01 | 0.1149 |
| 26012 | NSMF | P30T-E | Human | Esophagus | ESCC | 3.63e-10 | 2.91e-01 | 0.137 |
| 26012 | NSMF | P31T-E | Human | Esophagus | ESCC | 3.71e-11 | 1.54e-01 | 0.1251 |
| 26012 | NSMF | P32T-E | Human | Esophagus | ESCC | 3.22e-08 | 1.54e-01 | 0.1666 |
| Page: 1 2 3 |
| Tissue | Expression Dynamics | Abbreviation |
| Esophagus |  | ESCC: Esophageal squamous cell carcinoma |
| HGIN: High-grade intraepithelial neoplasias | ||
| LGIN: Low-grade intraepithelial neoplasias | ||
| Liver | 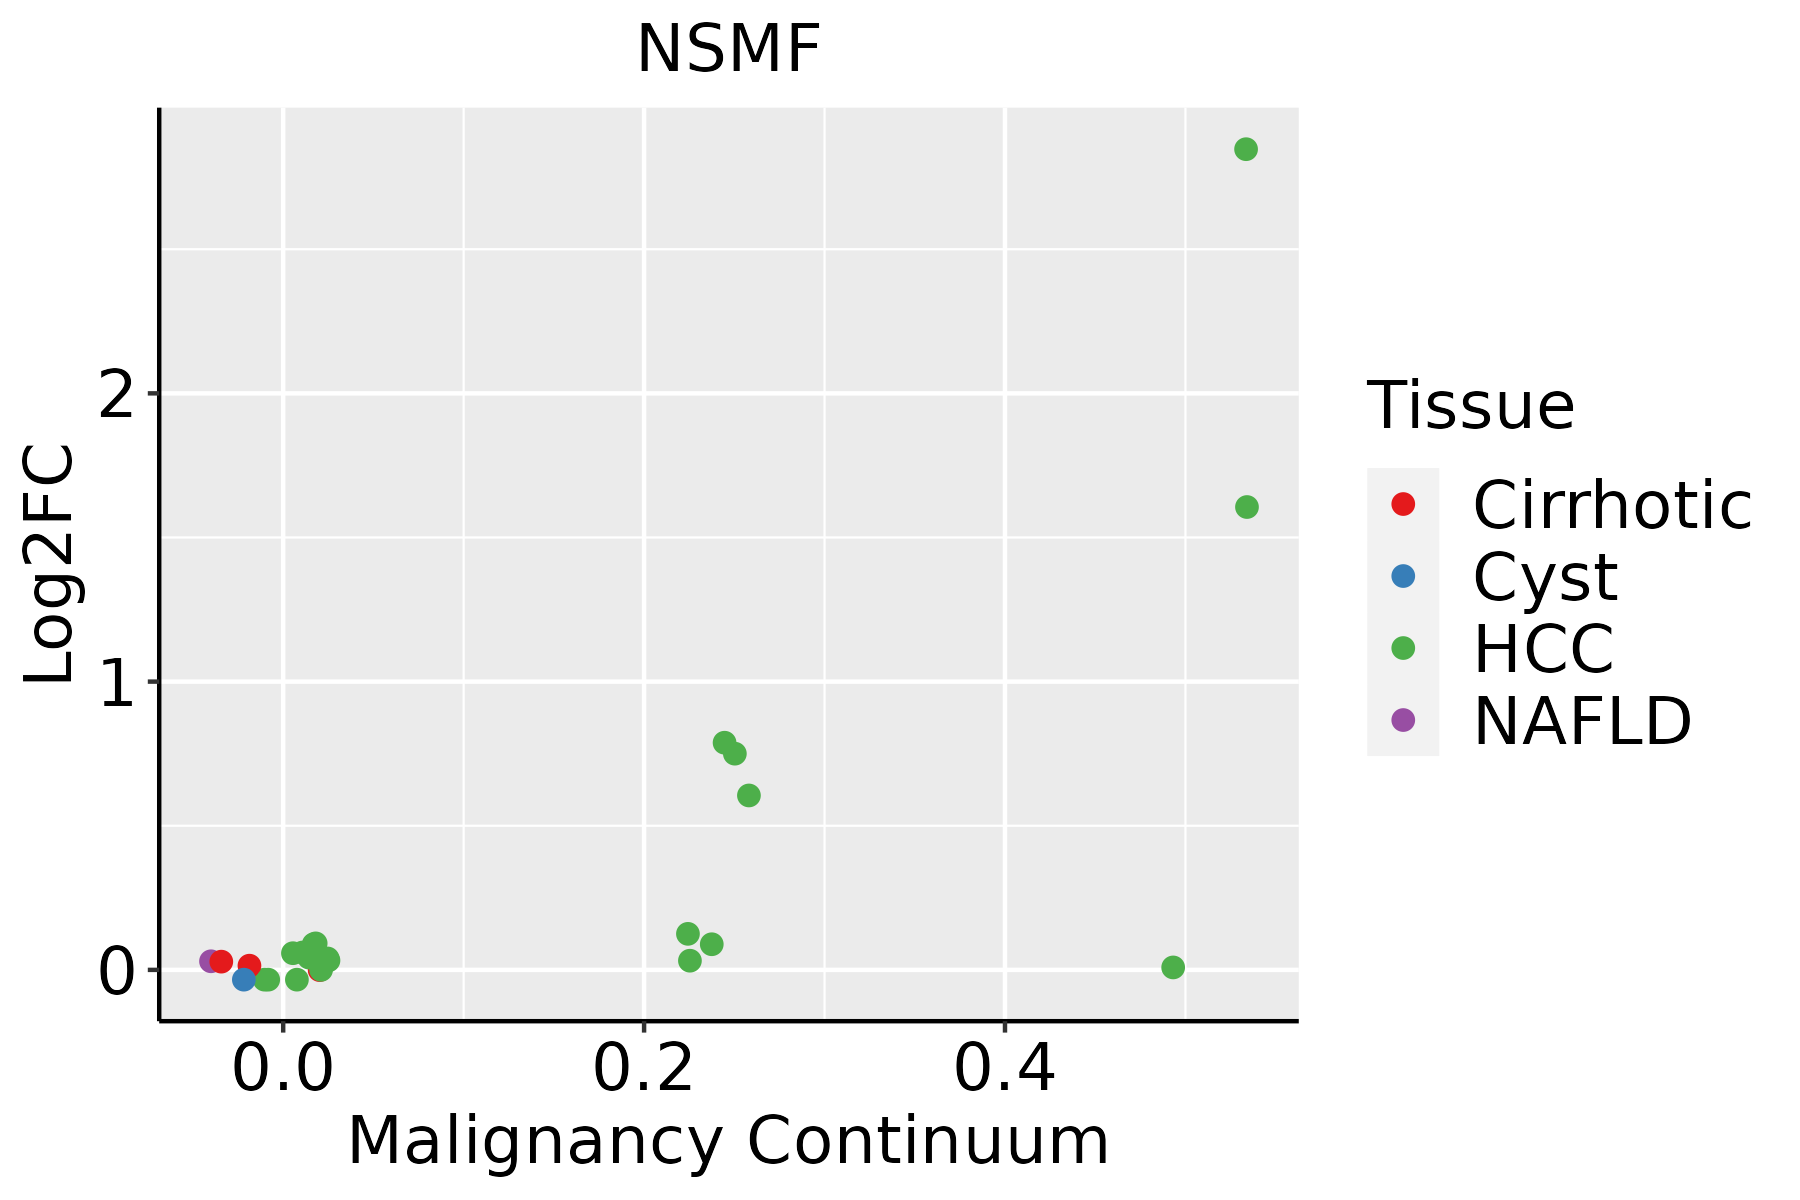 | HCC: Hepatocellular carcinoma |
| NAFLD: Non-alcoholic fatty liver disease | ||
| Oral Cavity |  | EOLP: Erosive Oral lichen planus |
| LP: leukoplakia | ||
| NEOLP: Non-erosive oral lichen planus | ||
| OSCC: Oral squamous cell carcinoma |
| ∗log2FC in expression of this searched gene in stem-like cells from each diseased tissue sample relative to stem-like cells in normal samples in each tissue plotted against the malignancy continuum. Samples are colored based on if they are from different disease stage. |
Top |
Malignant transformation related pathway analysis |
| Find out the enriched GO biological processes and KEGG pathways involved in transition from healthy to precancer to cancer |
| Tissue | Disease Stage | Enriched GO biological Processes |
| Colorectum | AD |  |
| Colorectum | SER |  |
| Colorectum | MSS |  |
| Colorectum | MSI-H |  |
| Colorectum | FAP |  |
| ∗Top 15 enriched GO BP terms are showed in the bar plot of each disease state in each tissue. Each row represents a significant GO biological process which is colored according to the -log10(p.adjust). |
| Page: 1 2 3 4 5 6 7 8 9 |
| GO ID | Tissue | Disease Stage | Description | Gene Ratio | Bg Ratio | pvalue | p.adjust | Count |
| GO:007121419 | Esophagus | ESCC | cellular response to abiotic stimulus | 206/8552 | 331/18723 | 7.52e-10 | 1.88e-08 | 206 |
| GO:010400419 | Esophagus | ESCC | cellular response to environmental stimulus | 206/8552 | 331/18723 | 7.52e-10 | 1.88e-08 | 206 |
| GO:001631110 | Esophagus | ESCC | dephosphorylation | 251/8552 | 417/18723 | 1.26e-09 | 2.99e-08 | 251 |
| GO:000647018 | Esophagus | ESCC | protein dephosphorylation | 177/8552 | 281/18723 | 3.13e-09 | 6.72e-08 | 177 |
| GO:0070997111 | Esophagus | ESCC | neuron death | 216/8552 | 361/18723 | 3.49e-08 | 6.45e-07 | 216 |
| GO:0035304111 | Esophagus | ESCC | regulation of protein dephosphorylation | 66/8552 | 90/18723 | 8.82e-08 | 1.48e-06 | 66 |
| GO:0035303111 | Esophagus | ESCC | regulation of dephosphorylation | 88/8552 | 128/18723 | 1.04e-07 | 1.71e-06 | 88 |
| GO:0051402110 | Esophagus | ESCC | neuron apoptotic process | 148/8552 | 246/18723 | 3.08e-06 | 3.47e-05 | 148 |
| GO:1901214111 | Esophagus | ESCC | regulation of neuron death | 186/8552 | 319/18723 | 3.35e-06 | 3.73e-05 | 186 |
| GO:00432007 | Esophagus | ESCC | response to amino acid | 74/8552 | 116/18723 | 6.23e-05 | 4.76e-04 | 74 |
| GO:000110110 | Esophagus | ESCC | response to acid chemical | 84/8552 | 135/18723 | 7.70e-05 | 5.74e-04 | 84 |
| GO:00712305 | Esophagus | ESCC | cellular response to amino acid stimulus | 48/8552 | 71/18723 | 1.55e-04 | 1.03e-03 | 48 |
| GO:001097516 | Esophagus | ESCC | regulation of neuron projection development | 240/8552 | 445/18723 | 2.48e-04 | 1.53e-03 | 240 |
| GO:004352317 | Esophagus | ESCC | regulation of neuron apoptotic process | 122/8552 | 212/18723 | 3.21e-04 | 1.90e-03 | 122 |
| GO:00712296 | Esophagus | ESCC | cellular response to acid chemical | 52/8552 | 80/18723 | 3.79e-04 | 2.20e-03 | 52 |
| GO:00353074 | Esophagus | ESCC | positive regulation of protein dephosphorylation | 31/8552 | 45/18723 | 1.40e-03 | 6.62e-03 | 31 |
| GO:00353066 | Esophagus | ESCC | positive regulation of dephosphorylation | 38/8552 | 59/18723 | 2.86e-03 | 1.21e-02 | 38 |
| GO:001635816 | Esophagus | ESCC | dendrite development | 130/8552 | 243/18723 | 8.33e-03 | 2.95e-02 | 130 |
| GO:001631121 | Liver | HCC | dephosphorylation | 230/7958 | 417/18723 | 1.00e-07 | 1.96e-06 | 230 |
| GO:007099722 | Liver | HCC | neuron death | 202/7958 | 361/18723 | 1.44e-07 | 2.70e-06 | 202 |
| Page: 1 2 3 |
| Pathway ID | Tissue | Disease Stage | Description | Gene Ratio | Bg Ratio | pvalue | p.adjust | qvalue | Count |
| Page: 1 |
Top |
Cell-cell communication analysis |
| Identification of potential cell-cell interactions between two cell types and their ligand-receptor pairs for different disease states |
| Ligand | Receptor | LRpair | Pathway | Tissue | Disease Stage |
| Page: 1 |
Top |
Single-cell gene regulatory network inference analysis |
| Find out the significant the regulons (TFs) and the target genes of each regulon across cell types for different disease states |
| TF | Cell Type | Tissue | Disease Stage | Target Gene | RSS | Regulon Activity |
| ∗The dot plots of a searched regulon are shown for all cell subpopulations in each disease state of each tissue based on the regulon specific score inferred using pySCENIC and by calculating the average expression. |
| Page: 1 |
Top |
Somatic mutation of malignant transformation related genes |
| Annotation of somatic variants for genes involved in malignant transformation |
| Hugo Symbol | Variant Class | Variant Classification | dbSNP RS | HGVSc | HGVSp | HGVSp Short | SWISSPROT | BIOTYPE | SIFT | PolyPhen | Tumor Sample Barcode | Tissue | Histology | Sex | Age | Stage | Therapy Types | Drugs | Outcome |
| NSMF | SNV | Missense_Mutation | c.700N>A | p.Gln234Lys | p.Q234K | Q6X4W1 | protein_coding | deleterious_low_confidence(0.01) | probably_damaging(0.937) | TCGA-A2-A25A-01 | Breast | breast invasive carcinoma | Female | <65 | I/II | Unspecific | Cytoxan | SD | |
| NSMF | SNV | Missense_Mutation | novel | c.205N>T | p.Arg69Cys | p.R69C | Q6X4W1 | protein_coding | deleterious_low_confidence(0) | probably_damaging(0.995) | TCGA-2W-A8YY-01 | Cervix | cervical & endocervical cancer | Female | <65 | I/II | Chemotherapy | cisplatin | CR |
| NSMF | SNV | Missense_Mutation | novel | c.909N>A | p.His303Gln | p.H303Q | Q6X4W1 | protein_coding | deleterious_low_confidence(0.01) | probably_damaging(0.986) | TCGA-EA-A3Y4-01 | Cervix | cervical & endocervical cancer | Female | <65 | I/II | Unknown | Unknown | SD |
| NSMF | SNV | Missense_Mutation | c.831N>C | p.Gln277His | p.Q277H | Q6X4W1 | protein_coding | deleterious_low_confidence(0.01) | possibly_damaging(0.526) | TCGA-EK-A2R8-01 | Cervix | cervical & endocervical cancer | Female | <65 | I/II | Unknown | Unknown | SD | |
| NSMF | SNV | Missense_Mutation | c.1568T>C | p.Leu523Pro | p.L523P | Q6X4W1 | protein_coding | deleterious_low_confidence(0) | probably_damaging(0.996) | TCGA-AD-5900-01 | Colorectum | colon adenocarcinoma | Male | >=65 | I/II | Unknown | Unknown | SD | |
| NSMF | SNV | Missense_Mutation | rs756007746 | c.229N>A | p.Gly77Ser | p.G77S | Q6X4W1 | protein_coding | tolerated_low_confidence(0.11) | probably_damaging(0.997) | TCGA-CK-5916-01 | Colorectum | colon adenocarcinoma | Female | >=65 | I/II | Unknown | Unknown | PD |
| NSMF | SNV | Missense_Mutation | rs755038279 | c.1015N>A | p.Asp339Asn | p.D339N | Q6X4W1 | protein_coding | tolerated_low_confidence(0.14) | benign(0.003) | TCGA-EI-6917-01 | Colorectum | rectum adenocarcinoma | Male | <65 | III/IV | Chemotherapy | 5fluorouracil+oxaciplatina+l-folinian | SD |
| NSMF | SNV | Missense_Mutation | rs372063291 | c.1537N>T | p.Arg513Cys | p.R513C | Q6X4W1 | protein_coding | deleterious(0) | probably_damaging(0.995) | TCGA-F5-6814-01 | Colorectum | rectum adenocarcinoma | Male | <65 | I/II | Unknown | Unknown | SD |
| NSMF | insertion | Frame_Shift_Ins | novel | c.196dupC | p.Gln66ProfsTer25 | p.Q66Pfs*25 | Q6X4W1 | protein_coding | TCGA-G4-6588-01 | Colorectum | colon adenocarcinoma | Female | <65 | I/II | Unknown | Unknown | SD | ||
| NSMF | SNV | Missense_Mutation | rs746582516 | c.418N>T | p.Arg140Cys | p.R140C | Q6X4W1 | protein_coding | deleterious_low_confidence(0.04) | probably_damaging(0.995) | TCGA-A5-A1OF-01 | Endometrium | uterine corpus endometrioid carcinoma | Female | <65 | I/II | Unknown | Unknown | SD |
| Page: 1 2 3 4 5 |
Top |
Related drugs of malignant transformation related genes |
| Identification of chemicals and drugs interact with genes involved in malignant transfromation |
| (DGIdb 4.0) |
| Entrez ID | Symbol | Category | Interaction Types | Drug Claim Name | Drug Name | PMIDs |
| Page: 1 |

Copyright 2023-Present -The University of Texas Health Science Center at Houston |