
|
|||||
|
 | |
| |
| |
| |
| |
| |
|
Gene: NSMCE4A |
Gene summary for NSMCE4A |
| Gene information | Species | Human | Gene symbol | NSMCE4A | Gene ID | 54780 |
| Gene name | NSE4 homolog A, SMC5-SMC6 complex component | |
| Gene Alias | C10orf86 | |
| Cytomap | 10q26.13 | |
| Gene Type | protein-coding | GO ID | GO:0006139 | UniProtAcc | Q9NXX6 |
Top |
Malignant transformation analysis |
| Identification of the aberrant gene expression in precancerous and cancerous lesions by comparing the gene expression of stem-like cells in diseased tissues with normal stem cells |
| Entrez ID | Symbol | Replicates | Species | Organ | Tissue | Adj P-value | Log2FC | Malignancy |
| 54780 | NSMCE4A | LZE4T | Human | Esophagus | ESCC | 9.18e-10 | 2.84e-01 | 0.0811 |
| 54780 | NSMCE4A | LZE5T | Human | Esophagus | ESCC | 8.61e-04 | 1.84e-01 | 0.0514 |
| 54780 | NSMCE4A | LZE20T | Human | Esophagus | ESCC | 3.85e-04 | 1.12e-01 | 0.0662 |
| 54780 | NSMCE4A | LZE22T | Human | Esophagus | ESCC | 4.85e-02 | 1.84e-01 | 0.068 |
| 54780 | NSMCE4A | LZE24T | Human | Esophagus | ESCC | 6.71e-40 | 1.13e+00 | 0.0596 |
| 54780 | NSMCE4A | P1T-E | Human | Esophagus | ESCC | 2.18e-13 | 4.14e-01 | 0.0875 |
| 54780 | NSMCE4A | P2T-E | Human | Esophagus | ESCC | 8.41e-36 | 8.44e-01 | 0.1177 |
| 54780 | NSMCE4A | P4T-E | Human | Esophagus | ESCC | 9.75e-34 | 8.77e-01 | 0.1323 |
| 54780 | NSMCE4A | P5T-E | Human | Esophagus | ESCC | 2.64e-29 | 7.61e-01 | 0.1327 |
| 54780 | NSMCE4A | P8T-E | Human | Esophagus | ESCC | 7.45e-23 | 4.39e-01 | 0.0889 |
| 54780 | NSMCE4A | P9T-E | Human | Esophagus | ESCC | 2.31e-12 | 2.71e-01 | 0.1131 |
| 54780 | NSMCE4A | P10T-E | Human | Esophagus | ESCC | 2.46e-20 | 1.61e-01 | 0.116 |
| 54780 | NSMCE4A | P11T-E | Human | Esophagus | ESCC | 2.50e-09 | 2.66e-01 | 0.1426 |
| 54780 | NSMCE4A | P12T-E | Human | Esophagus | ESCC | 4.92e-57 | 1.15e+00 | 0.1122 |
| 54780 | NSMCE4A | P15T-E | Human | Esophagus | ESCC | 2.05e-22 | 5.16e-01 | 0.1149 |
| 54780 | NSMCE4A | P16T-E | Human | Esophagus | ESCC | 5.55e-26 | 5.77e-01 | 0.1153 |
| 54780 | NSMCE4A | P17T-E | Human | Esophagus | ESCC | 2.01e-04 | 3.46e-01 | 0.1278 |
| 54780 | NSMCE4A | P19T-E | Human | Esophagus | ESCC | 8.88e-11 | 6.94e-01 | 0.1662 |
| 54780 | NSMCE4A | P20T-E | Human | Esophagus | ESCC | 4.27e-12 | 4.36e-01 | 0.1124 |
| 54780 | NSMCE4A | P21T-E | Human | Esophagus | ESCC | 6.72e-22 | 4.16e-01 | 0.1617 |
| Page: 1 2 3 4 5 6 |
| Tissue | Expression Dynamics | Abbreviation |
| Esophagus |  | ESCC: Esophageal squamous cell carcinoma |
| HGIN: High-grade intraepithelial neoplasias | ||
| LGIN: Low-grade intraepithelial neoplasias | ||
| Liver | 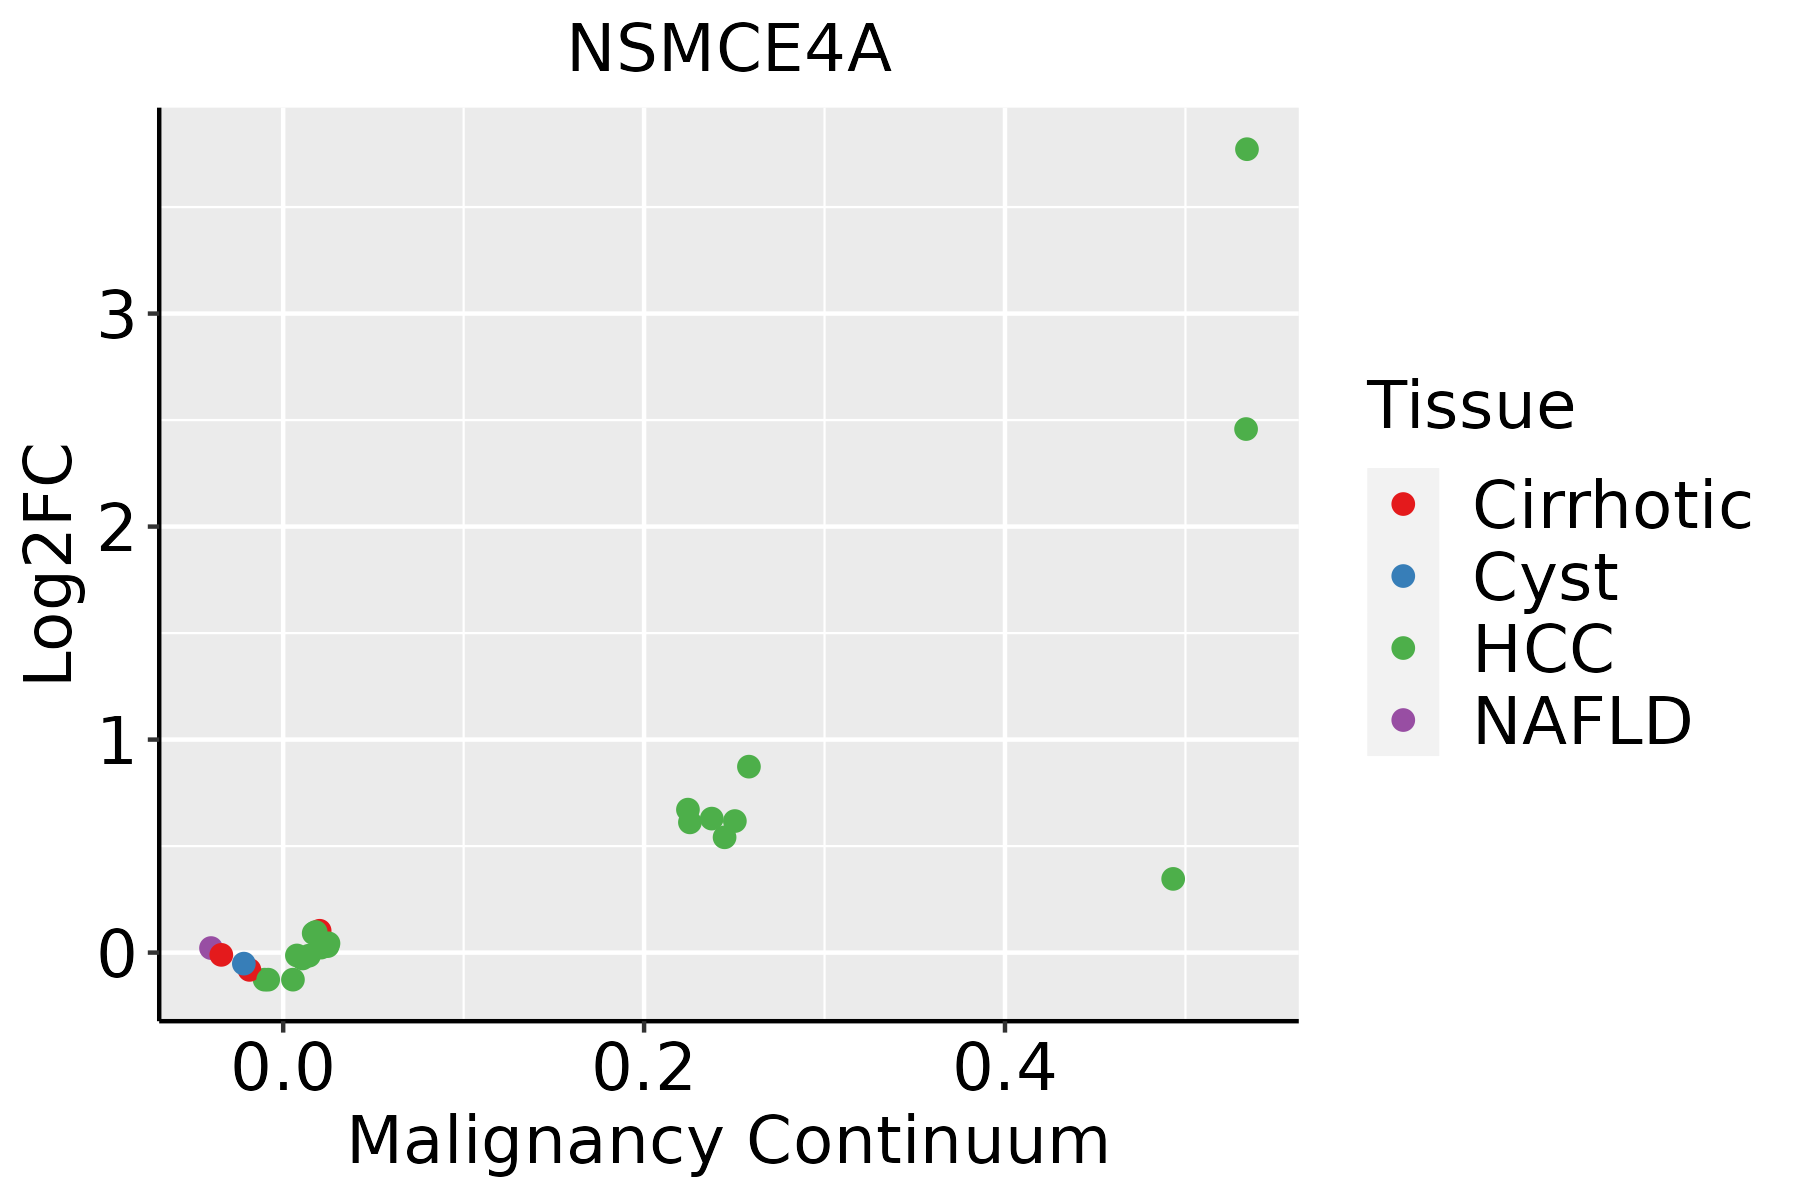 | HCC: Hepatocellular carcinoma |
| NAFLD: Non-alcoholic fatty liver disease | ||
| Oral Cavity |  | EOLP: Erosive Oral lichen planus |
| LP: leukoplakia | ||
| NEOLP: Non-erosive oral lichen planus | ||
| OSCC: Oral squamous cell carcinoma | ||
| Skin |  | AK: Actinic keratosis |
| cSCC: Cutaneous squamous cell carcinoma | ||
| SCCIS:squamous cell carcinoma in situ | ||
| Thyroid | 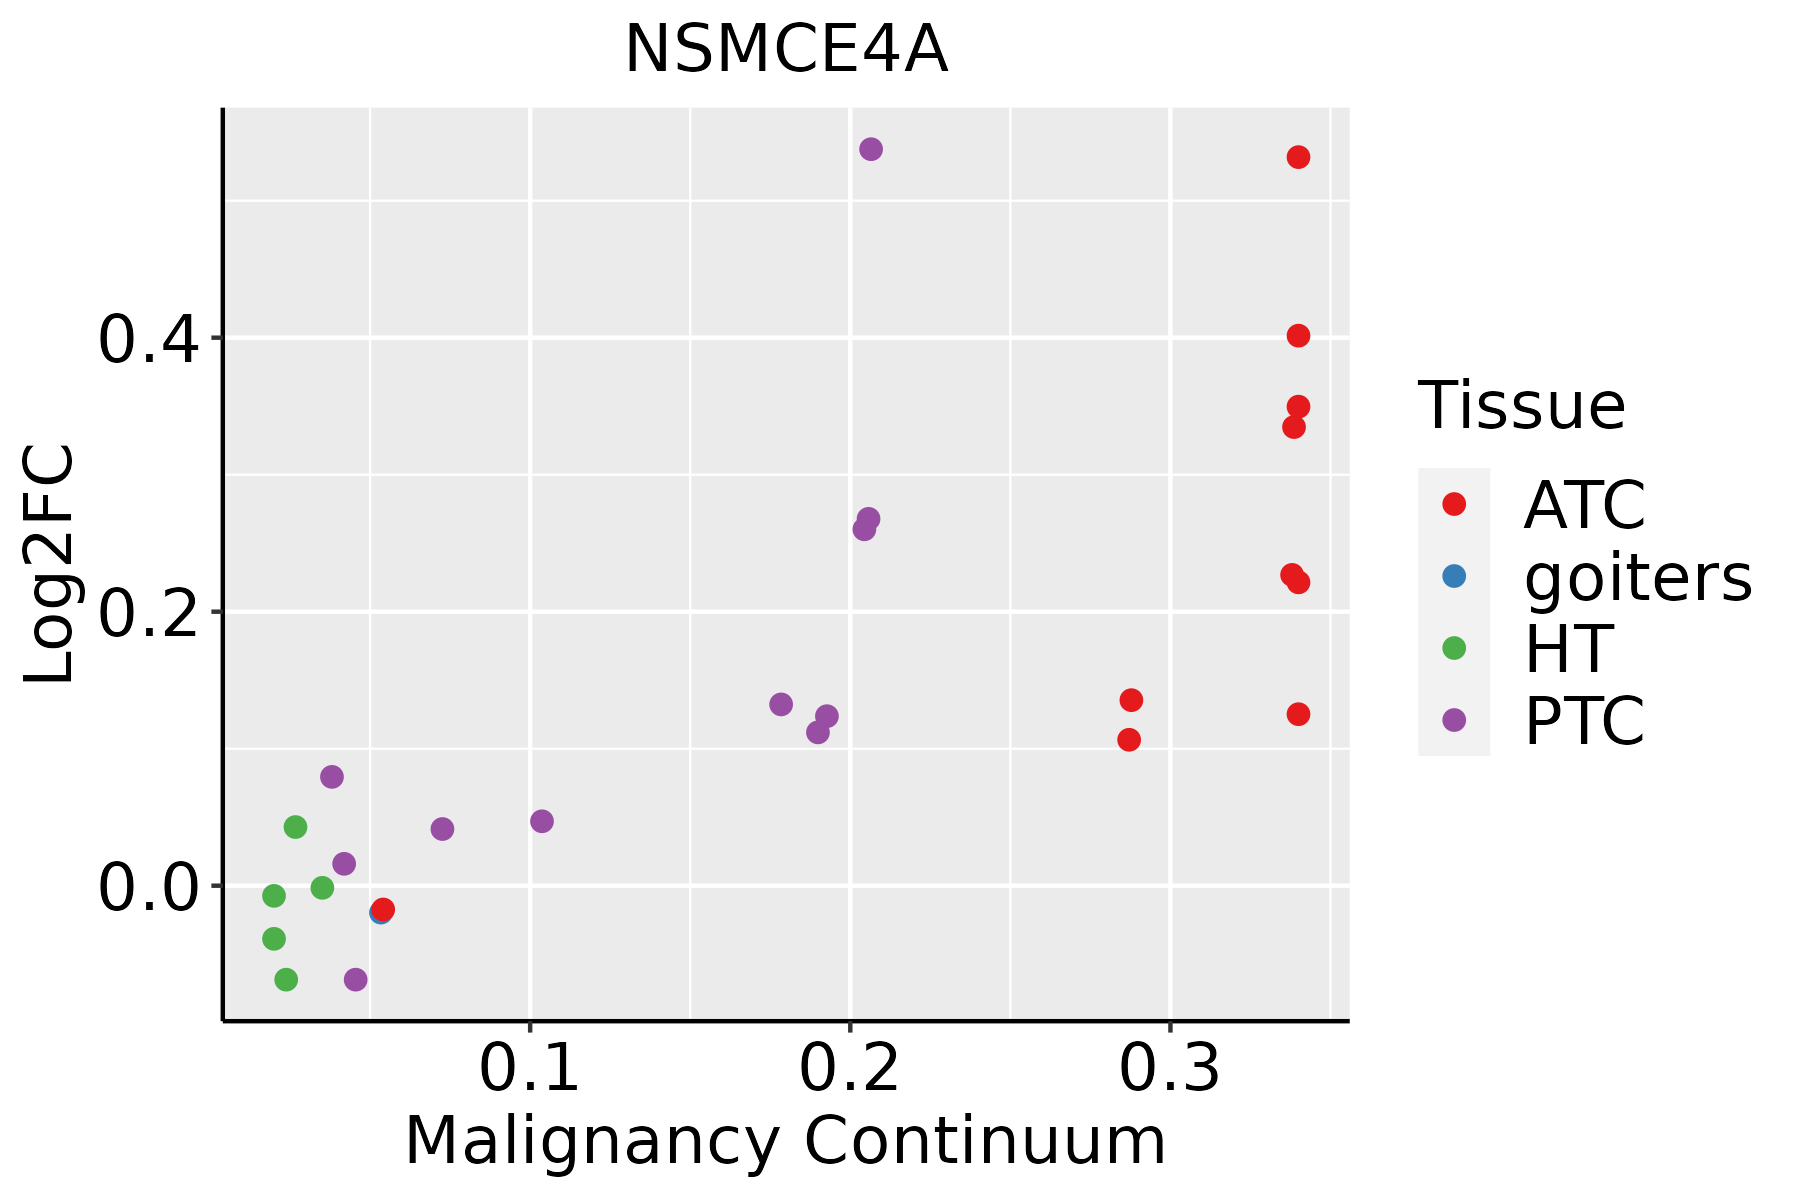 | ATC: Anaplastic thyroid cancer |
| HT: Hashimoto's thyroiditis | ||
| PTC: Papillary thyroid cancer |
| ∗log2FC in expression of this searched gene in stem-like cells from each diseased tissue sample relative to stem-like cells in normal samples in each tissue plotted against the malignancy continuum. Samples are colored based on if they are from different disease stage. |
Top |
Malignant transformation related pathway analysis |
| Find out the enriched GO biological processes and KEGG pathways involved in transition from healthy to precancer to cancer |
| Tissue | Disease Stage | Enriched GO biological Processes |
| Colorectum | AD |  |
| Colorectum | SER |  |
| Colorectum | MSS |  |
| Colorectum | MSI-H |  |
| Colorectum | FAP |  |
| ∗Top 15 enriched GO BP terms are showed in the bar plot of each disease state in each tissue. Each row represents a significant GO biological process which is colored according to the -log10(p.adjust). |
| Page: 1 2 3 4 5 6 7 8 9 |
| GO ID | Tissue | Disease Stage | Description | Gene Ratio | Bg Ratio | pvalue | p.adjust | Count |
| GO:2001020110 | Esophagus | ESCC | regulation of response to DNA damage stimulus | 145/8552 | 219/18723 | 5.97e-10 | 1.50e-08 | 145 |
| GO:20010228 | Esophagus | ESCC | positive regulation of response to DNA damage stimulus | 69/8552 | 105/18723 | 2.66e-05 | 2.22e-04 | 69 |
| GO:00063101 | Esophagus | ESCC | DNA recombination | 168/8552 | 305/18723 | 5.58e-04 | 3.05e-03 | 168 |
| GO:200102011 | Liver | Cirrhotic | regulation of response to DNA damage stimulus | 75/4634 | 219/18723 | 9.75e-04 | 6.89e-03 | 75 |
| GO:200102021 | Liver | HCC | regulation of response to DNA damage stimulus | 128/7958 | 219/18723 | 1.31e-06 | 1.90e-05 | 128 |
| GO:200102211 | Liver | HCC | positive regulation of response to DNA damage stimulus | 64/7958 | 105/18723 | 1.03e-04 | 8.88e-04 | 64 |
| GO:200102017 | Oral cavity | OSCC | regulation of response to DNA damage stimulus | 131/7305 | 219/18723 | 3.21e-10 | 8.72e-09 | 131 |
| GO:20010227 | Oral cavity | OSCC | positive regulation of response to DNA damage stimulus | 63/7305 | 105/18723 | 1.05e-05 | 1.11e-04 | 63 |
| GO:0006310 | Oral cavity | OSCC | DNA recombination | 147/7305 | 305/18723 | 6.33e-04 | 3.56e-03 | 147 |
| GO:200102018 | Oral cavity | LP | regulation of response to DNA damage stimulus | 82/4623 | 219/18723 | 1.71e-05 | 2.97e-04 | 82 |
| GO:2001020111 | Skin | cSCC | regulation of response to DNA damage stimulus | 87/4864 | 219/18723 | 5.38e-06 | 7.75e-05 | 87 |
| GO:2001020112 | Thyroid | PTC | regulation of response to DNA damage stimulus | 113/5968 | 219/18723 | 9.37e-10 | 2.77e-08 | 113 |
| GO:20010229 | Thyroid | PTC | positive regulation of response to DNA damage stimulus | 53/5968 | 105/18723 | 5.51e-05 | 4.89e-04 | 53 |
| GO:200102026 | Thyroid | ATC | regulation of response to DNA damage stimulus | 121/6293 | 219/18723 | 3.22e-11 | 1.08e-09 | 121 |
| GO:200102214 | Thyroid | ATC | positive regulation of response to DNA damage stimulus | 59/6293 | 105/18723 | 1.62e-06 | 1.97e-05 | 59 |
| Page: 1 |
| Pathway ID | Tissue | Disease Stage | Description | Gene Ratio | Bg Ratio | pvalue | p.adjust | qvalue | Count |
| Page: 1 |
Top |
Cell-cell communication analysis |
| Identification of potential cell-cell interactions between two cell types and their ligand-receptor pairs for different disease states |
| Ligand | Receptor | LRpair | Pathway | Tissue | Disease Stage |
| Page: 1 |
Top |
Single-cell gene regulatory network inference analysis |
| Find out the significant the regulons (TFs) and the target genes of each regulon across cell types for different disease states |
| TF | Cell Type | Tissue | Disease Stage | Target Gene | RSS | Regulon Activity |
| ∗The dot plots of a searched regulon are shown for all cell subpopulations in each disease state of each tissue based on the regulon specific score inferred using pySCENIC and by calculating the average expression. |
| Page: 1 |
Top |
Somatic mutation of malignant transformation related genes |
| Annotation of somatic variants for genes involved in malignant transformation |
| Hugo Symbol | Variant Class | Variant Classification | dbSNP RS | HGVSc | HGVSp | HGVSp Short | SWISSPROT | BIOTYPE | SIFT | PolyPhen | Tumor Sample Barcode | Tissue | Histology | Sex | Age | Stage | Therapy Types | Drugs | Outcome |
| NSMCE4A | SNV | Missense_Mutation | c.652N>G | p.Leu218Val | p.L218V | Q9NXX6 | protein_coding | tolerated(0.16) | benign(0.381) | TCGA-B6-A0X1-01 | Breast | breast invasive carcinoma | Female | <65 | I/II | Unknown | Unknown | PD | |
| NSMCE4A | SNV | Missense_Mutation | c.886N>A | p.His296Asn | p.H296N | Q9NXX6 | protein_coding | tolerated(1) | benign(0.009) | TCGA-C8-A12T-01 | Breast | breast invasive carcinoma | Female | <65 | I/II | Unknown | Unknown | SD | |
| NSMCE4A | SNV | Missense_Mutation | novel | c.604N>A | p.Gly202Ser | p.G202S | Q9NXX6 | protein_coding | deleterious(0.04) | possibly_damaging(0.794) | TCGA-A6-2672-01 | Colorectum | colon adenocarcinoma | Female | >=65 | III/IV | Unknown | Unknown | SD |
| NSMCE4A | SNV | Missense_Mutation | rs149182759 | c.524N>T | p.Pro175Leu | p.P175L | Q9NXX6 | protein_coding | tolerated(0.69) | benign(0.23) | TCGA-AA-3950-01 | Colorectum | colon adenocarcinoma | Female | >=65 | I/II | Unknown | Unknown | SD |
| NSMCE4A | SNV | Missense_Mutation | c.541C>A | p.Leu181Ile | p.L181I | Q9NXX6 | protein_coding | tolerated(0.19) | benign(0.074) | TCGA-AZ-6598-01 | Colorectum | colon adenocarcinoma | Female | >=65 | I/II | Unknown | Unknown | SD | |
| NSMCE4A | SNV | Missense_Mutation | c.1012N>C | p.Asn338His | p.N338H | Q9NXX6 | protein_coding | deleterious(0.04) | possibly_damaging(0.638) | TCGA-CA-6718-01 | Colorectum | colon adenocarcinoma | Male | <65 | I/II | Unknown | Unknown | PD | |
| NSMCE4A | SNV | Missense_Mutation | novel | c.953G>T | p.Arg318Ile | p.R318I | Q9NXX6 | protein_coding | deleterious(0) | probably_damaging(0.989) | TCGA-AJ-A5DW-01 | Endometrium | uterine corpus endometrioid carcinoma | Female | <65 | I/II | Unknown | Unknown | SD |
| NSMCE4A | SNV | Missense_Mutation | novel | c.532G>A | p.Ala178Thr | p.A178T | Q9NXX6 | protein_coding | tolerated(0.4) | benign(0.09) | TCGA-AJ-A5DW-01 | Endometrium | uterine corpus endometrioid carcinoma | Female | <65 | I/II | Unknown | Unknown | SD |
| NSMCE4A | SNV | Missense_Mutation | rs569424180 | c.295N>C | p.Asn99His | p.N99H | Q9NXX6 | protein_coding | deleterious(0.03) | probably_damaging(0.997) | TCGA-AX-A05S-01 | Endometrium | uterine corpus endometrioid carcinoma | Female | >=65 | III/IV | Unspecific | Carboplatin & Paclitaxel | PD |
| NSMCE4A | SNV | Missense_Mutation | novel | c.1140N>C | p.Gln380His | p.Q380H | Q9NXX6 | protein_coding | deleterious_low_confidence(0.01) | benign(0.088) | TCGA-AX-A1CE-01 | Endometrium | uterine corpus endometrioid carcinoma | Female | <65 | I/II | Unspecific | Paclitaxel | SD |
| Page: 1 2 |
Top |
Related drugs of malignant transformation related genes |
| Identification of chemicals and drugs interact with genes involved in malignant transfromation |
| (DGIdb 4.0) |
| Entrez ID | Symbol | Category | Interaction Types | Drug Claim Name | Drug Name | PMIDs |
| Page: 1 |

Copyright 2023-Present -The University of Texas Health Science Center at Houston |