
|
|||||
|
 | |
| |
| |
| |
| |
| |
|
Gene: NSMCE3 |
Gene summary for NSMCE3 |
| Gene information | Species | Human | Gene symbol | NSMCE3 | Gene ID | 56160 |
| Gene name | NSE3 homolog, SMC5-SMC6 complex component | |
| Gene Alias | HCA4 | |
| Cytomap | 15q13.1 | |
| Gene Type | protein-coding | GO ID | GO:0000122 | UniProtAcc | Q96MG7 |
Top |
Malignant transformation analysis |
| Identification of the aberrant gene expression in precancerous and cancerous lesions by comparing the gene expression of stem-like cells in diseased tissues with normal stem cells |
| Entrez ID | Symbol | Replicates | Species | Organ | Tissue | Adj P-value | Log2FC | Malignancy |
| 56160 | NSMCE3 | LZE24T | Human | Esophagus | ESCC | 2.35e-05 | 2.39e-01 | 0.0596 |
| 56160 | NSMCE3 | P2T-E | Human | Esophagus | ESCC | 5.54e-25 | 4.26e-01 | 0.1177 |
| 56160 | NSMCE3 | P4T-E | Human | Esophagus | ESCC | 1.57e-29 | 5.75e-01 | 0.1323 |
| 56160 | NSMCE3 | P5T-E | Human | Esophagus | ESCC | 1.24e-17 | 2.83e-01 | 0.1327 |
| 56160 | NSMCE3 | P8T-E | Human | Esophagus | ESCC | 5.21e-07 | 1.13e-01 | 0.0889 |
| 56160 | NSMCE3 | P9T-E | Human | Esophagus | ESCC | 3.65e-20 | 4.28e-01 | 0.1131 |
| 56160 | NSMCE3 | P10T-E | Human | Esophagus | ESCC | 5.74e-31 | 5.42e-01 | 0.116 |
| 56160 | NSMCE3 | P11T-E | Human | Esophagus | ESCC | 2.38e-07 | 2.54e-01 | 0.1426 |
| 56160 | NSMCE3 | P12T-E | Human | Esophagus | ESCC | 1.32e-09 | 2.63e-01 | 0.1122 |
| 56160 | NSMCE3 | P15T-E | Human | Esophagus | ESCC | 9.04e-14 | 2.96e-01 | 0.1149 |
| 56160 | NSMCE3 | P16T-E | Human | Esophagus | ESCC | 3.75e-17 | 2.02e-01 | 0.1153 |
| 56160 | NSMCE3 | P17T-E | Human | Esophagus | ESCC | 1.29e-02 | 1.18e-01 | 0.1278 |
| 56160 | NSMCE3 | P19T-E | Human | Esophagus | ESCC | 7.26e-03 | 2.10e-01 | 0.1662 |
| 56160 | NSMCE3 | P20T-E | Human | Esophagus | ESCC | 1.21e-05 | 1.19e-01 | 0.1124 |
| 56160 | NSMCE3 | P21T-E | Human | Esophagus | ESCC | 7.75e-05 | 9.40e-02 | 0.1617 |
| 56160 | NSMCE3 | P22T-E | Human | Esophagus | ESCC | 7.19e-19 | 2.81e-01 | 0.1236 |
| 56160 | NSMCE3 | P23T-E | Human | Esophagus | ESCC | 2.79e-09 | 1.53e-01 | 0.108 |
| 56160 | NSMCE3 | P24T-E | Human | Esophagus | ESCC | 6.72e-05 | 1.46e-01 | 0.1287 |
| 56160 | NSMCE3 | P26T-E | Human | Esophagus | ESCC | 4.35e-36 | 5.88e-01 | 0.1276 |
| 56160 | NSMCE3 | P27T-E | Human | Esophagus | ESCC | 1.89e-03 | 1.25e-01 | 0.1055 |
| Page: 1 2 3 4 5 |
| Tissue | Expression Dynamics | Abbreviation |
| Esophagus | 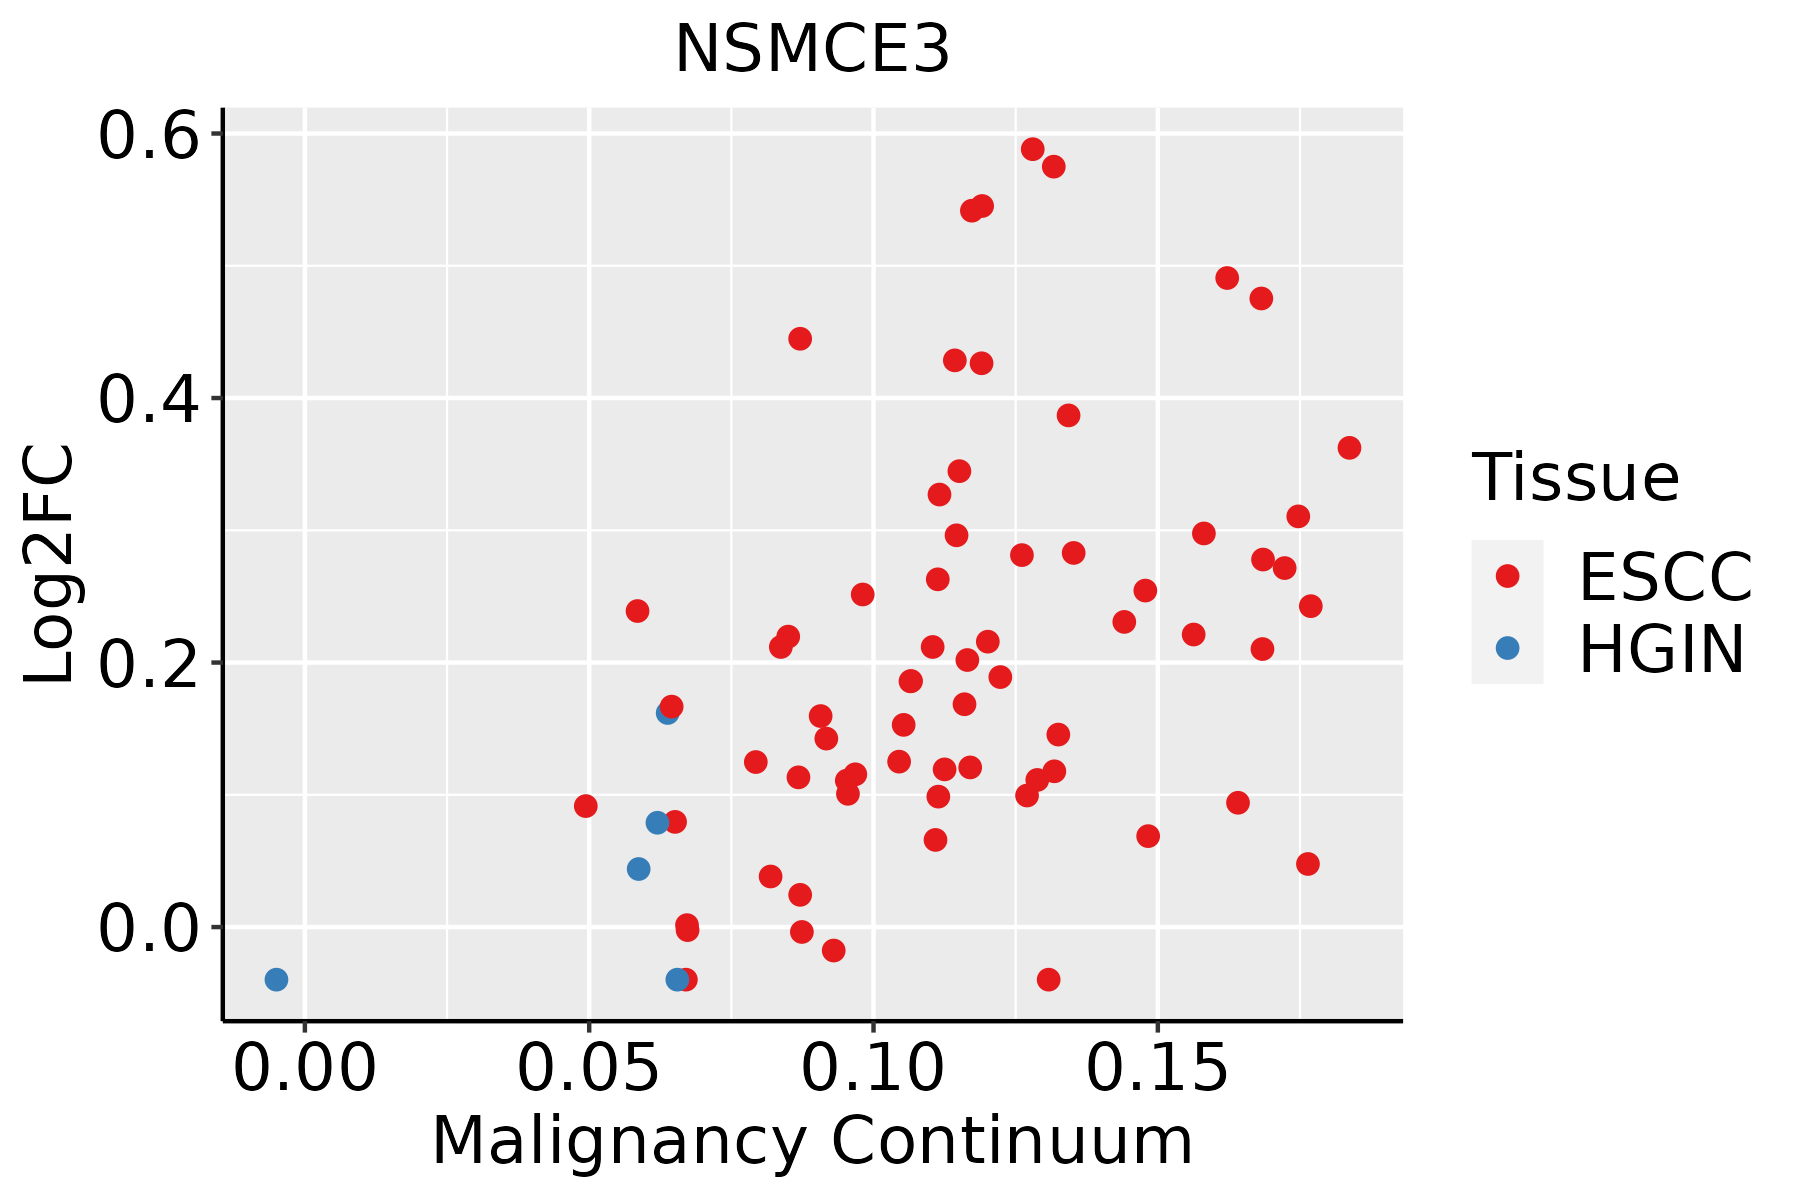 | ESCC: Esophageal squamous cell carcinoma |
| HGIN: High-grade intraepithelial neoplasias | ||
| LGIN: Low-grade intraepithelial neoplasias | ||
| Liver | 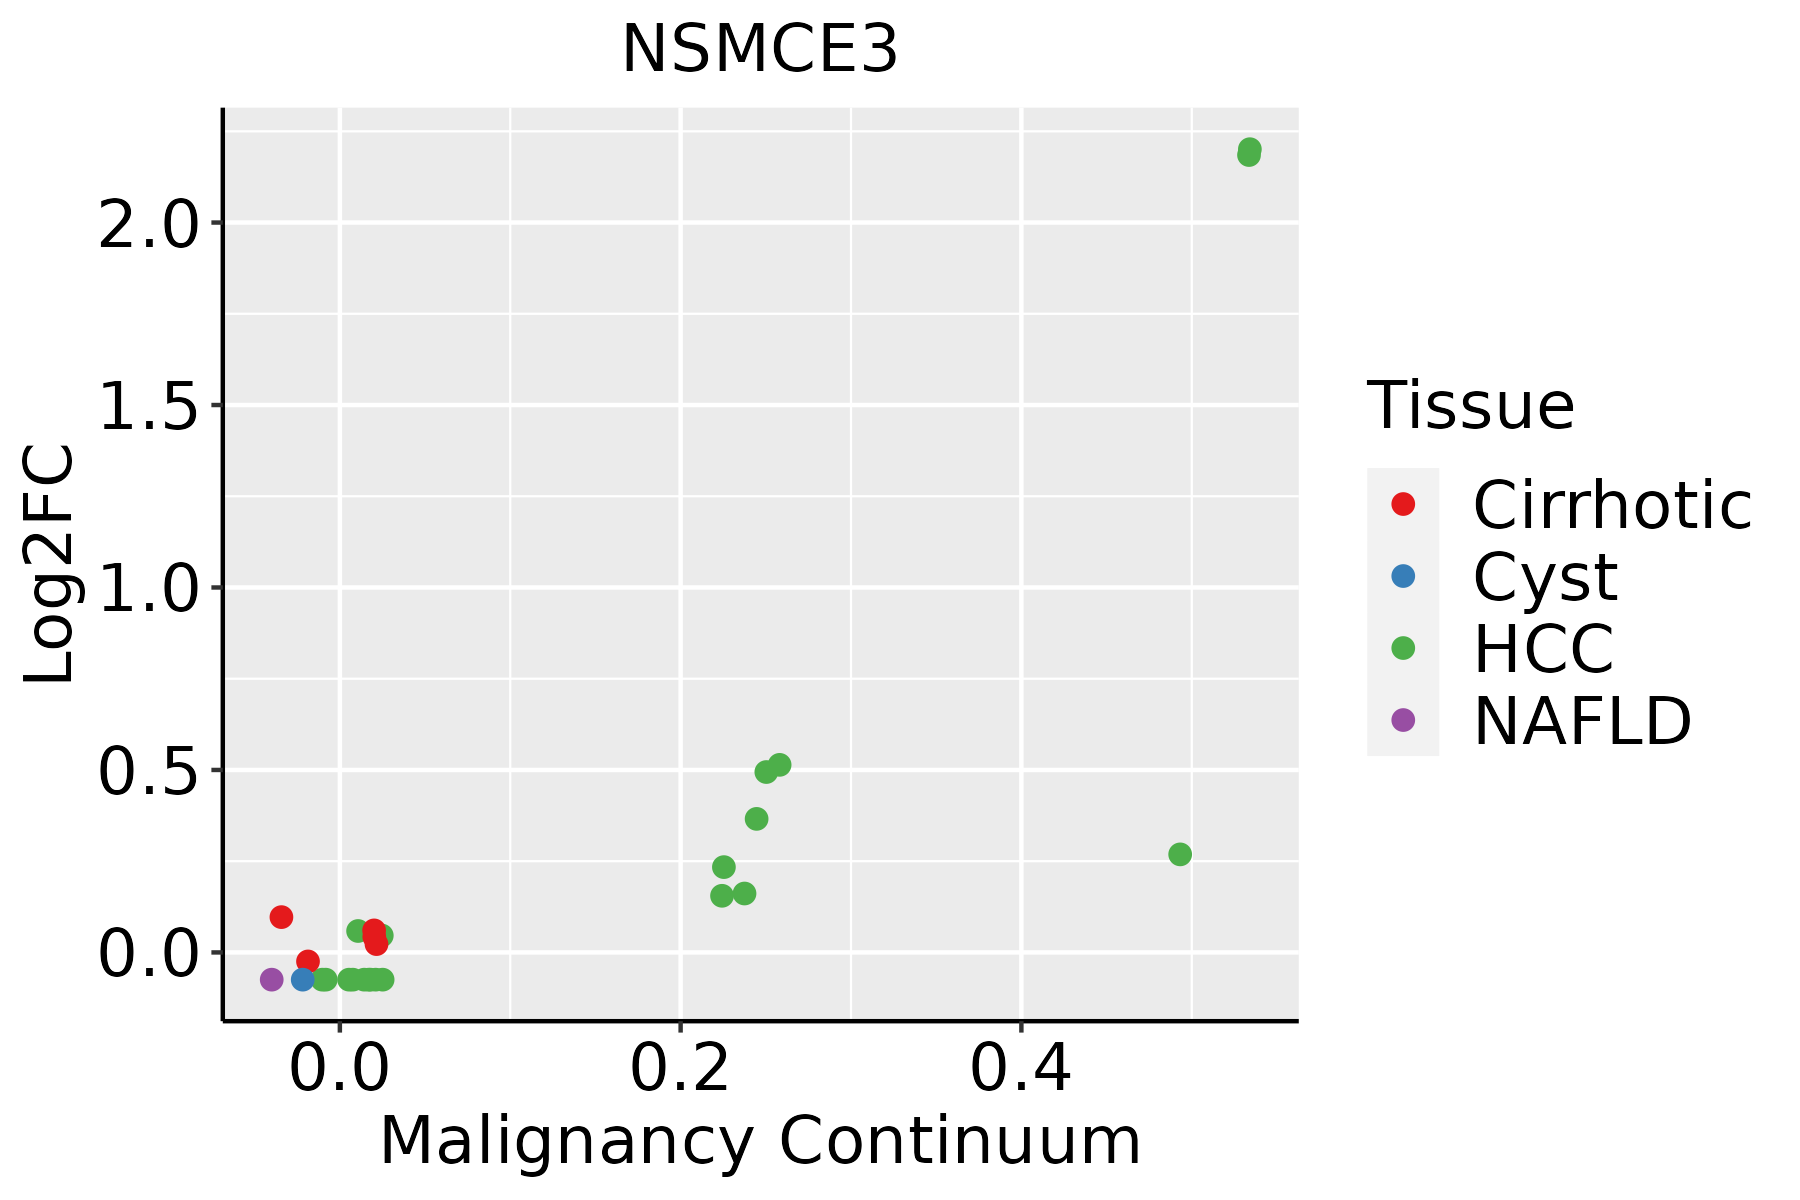 | HCC: Hepatocellular carcinoma |
| NAFLD: Non-alcoholic fatty liver disease | ||
| Oral Cavity | 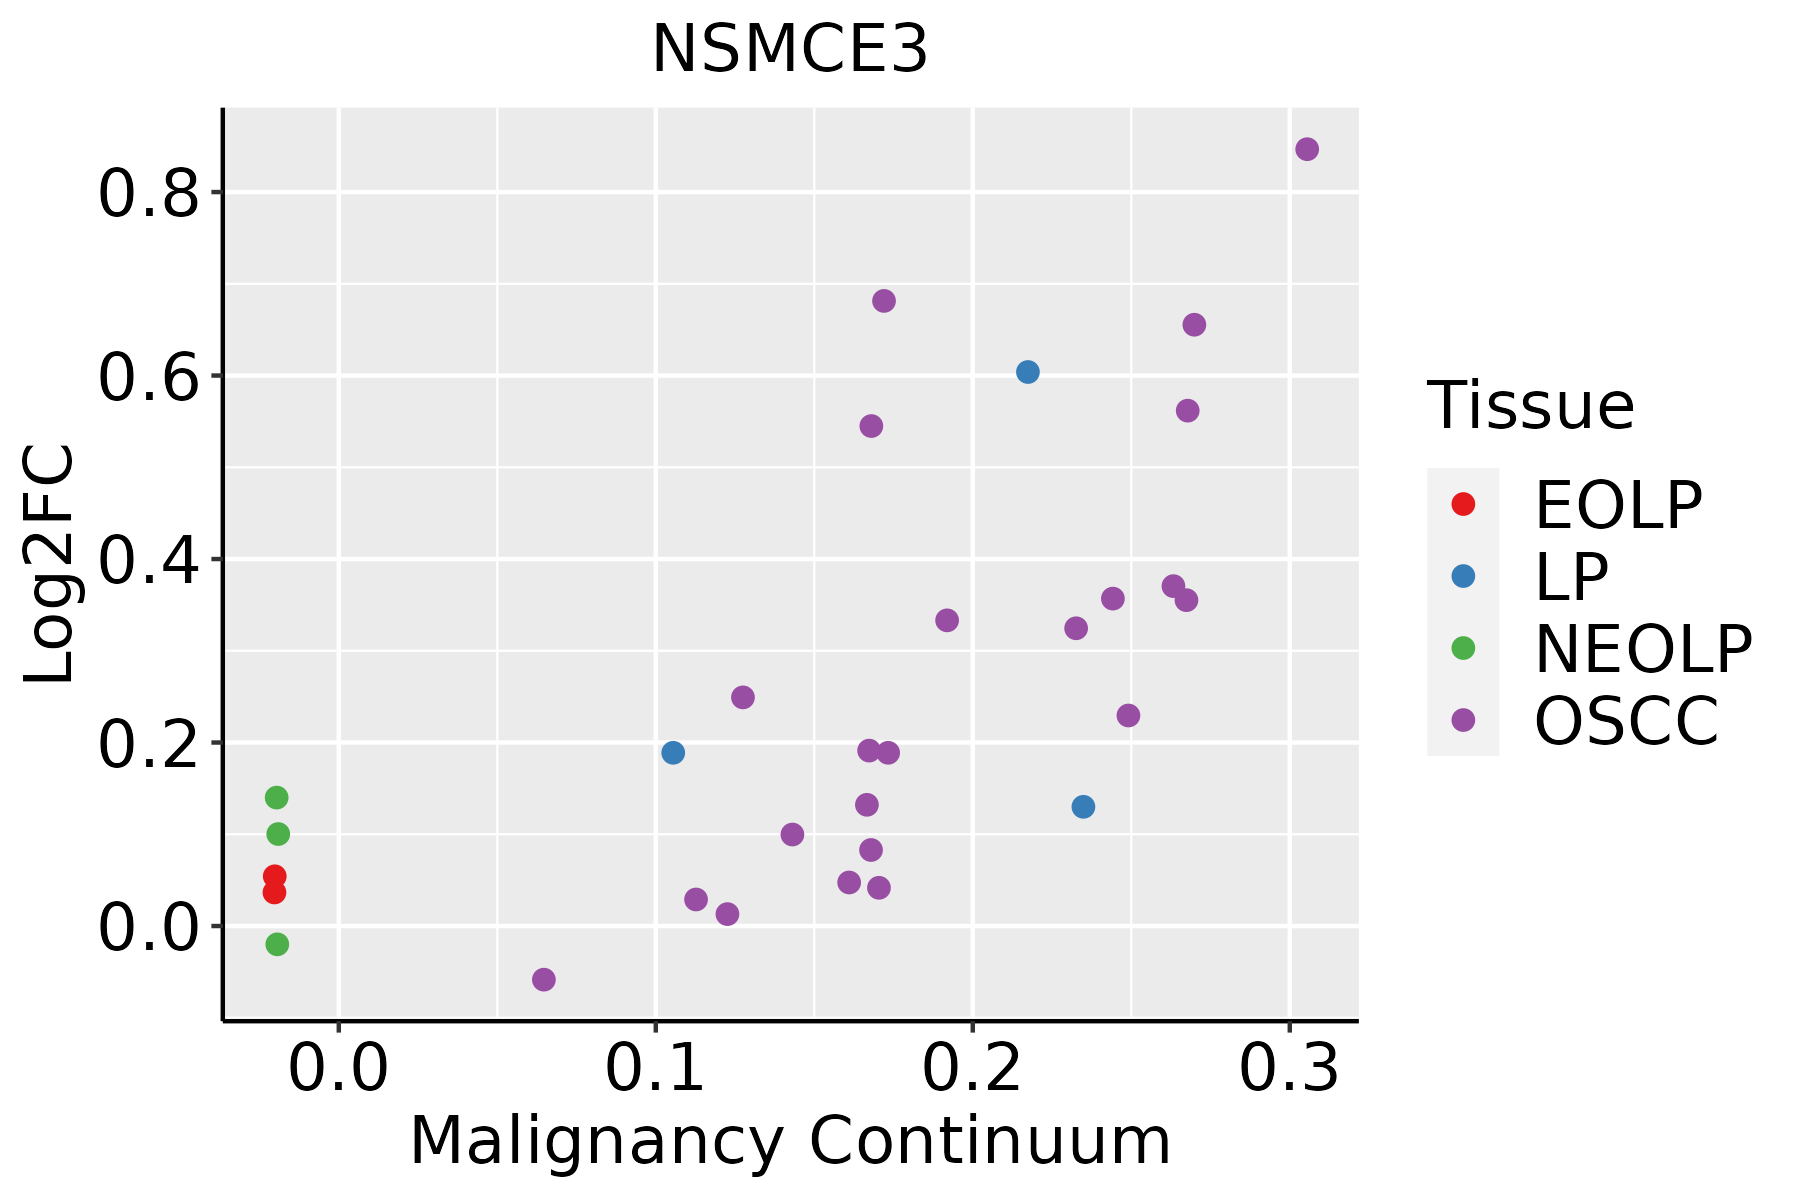 | EOLP: Erosive Oral lichen planus |
| LP: leukoplakia | ||
| NEOLP: Non-erosive oral lichen planus | ||
| OSCC: Oral squamous cell carcinoma | ||
| Thyroid | 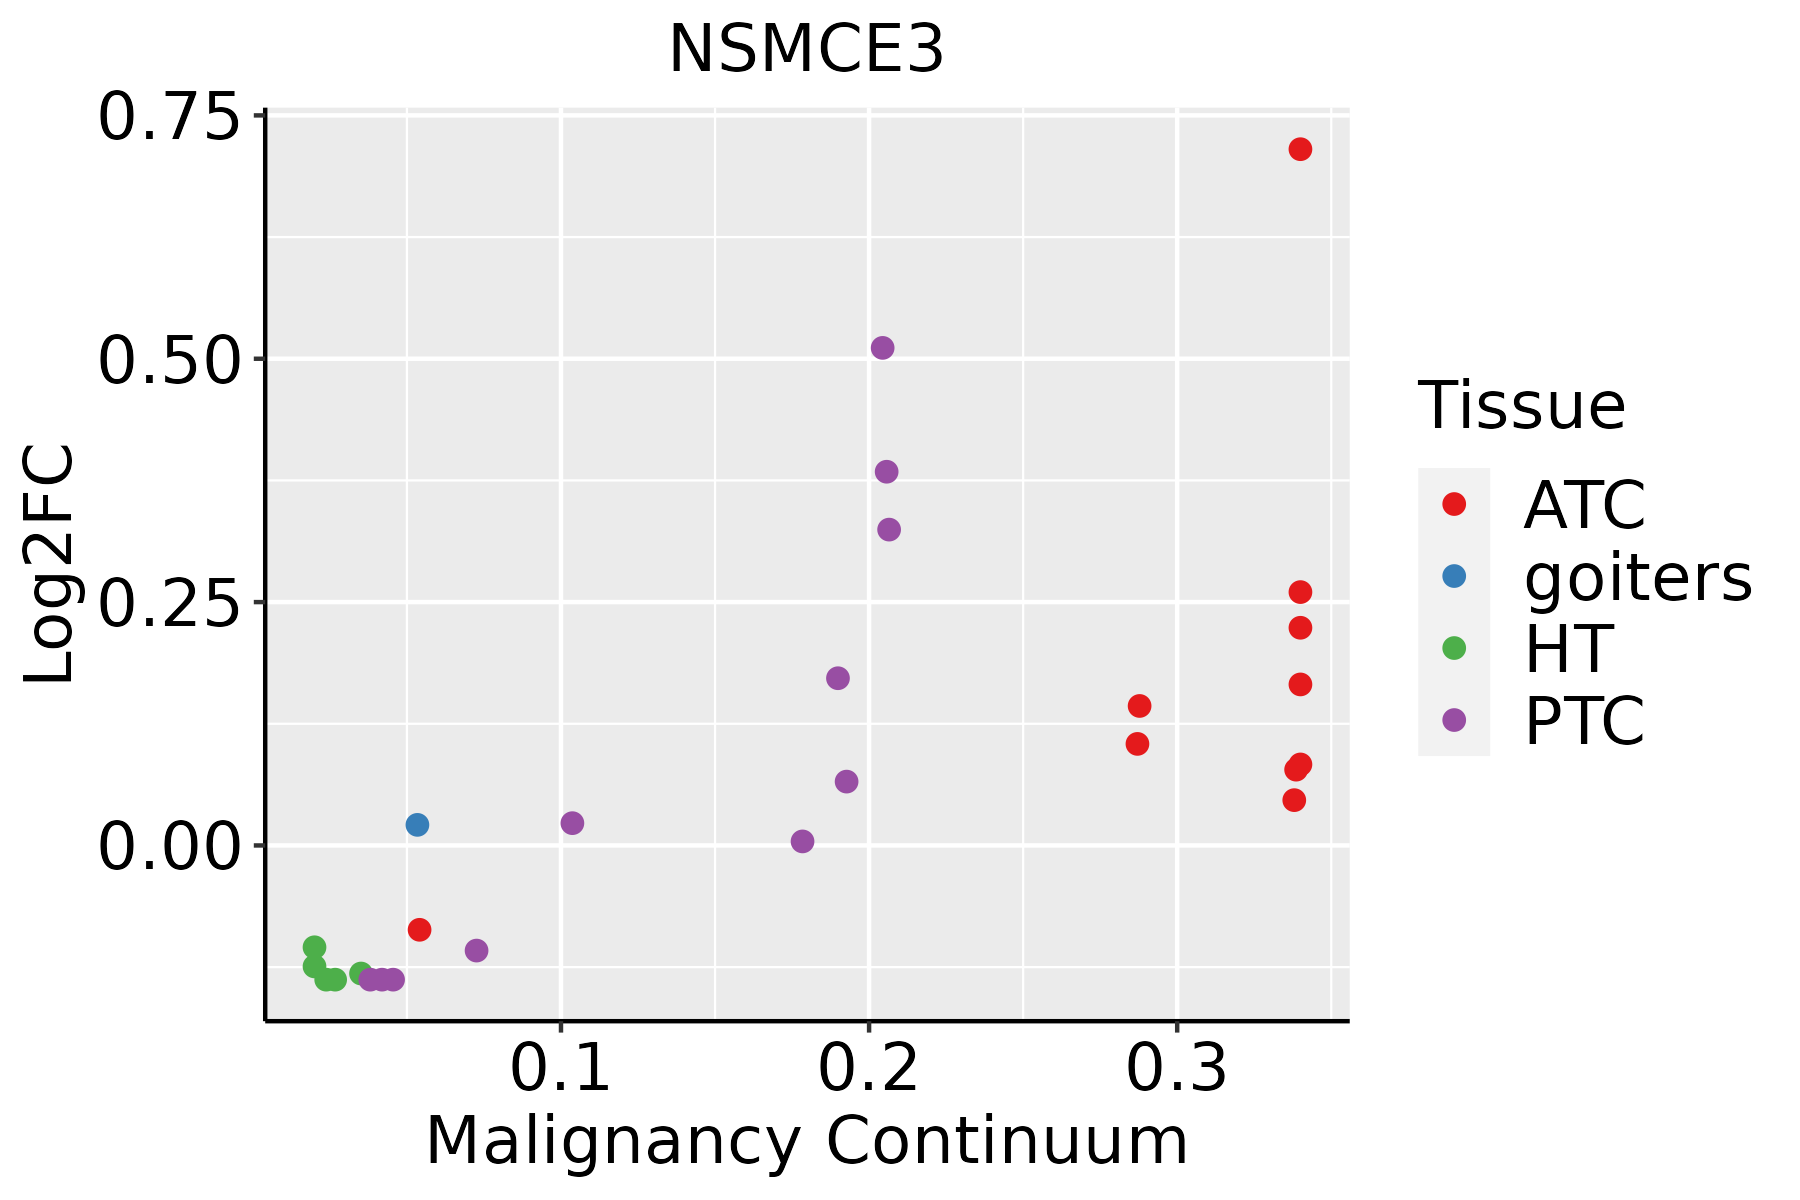 | ATC: Anaplastic thyroid cancer |
| HT: Hashimoto's thyroiditis | ||
| PTC: Papillary thyroid cancer |
| ∗log2FC in expression of this searched gene in stem-like cells from each diseased tissue sample relative to stem-like cells in normal samples in each tissue plotted against the malignancy continuum. Samples are colored based on if they are from different disease stage. |
Top |
Malignant transformation related pathway analysis |
| Find out the enriched GO biological processes and KEGG pathways involved in transition from healthy to precancer to cancer |
| Tissue | Disease Stage | Enriched GO biological Processes |
| Colorectum | AD |  |
| Colorectum | SER |  |
| Colorectum | MSS |  |
| Colorectum | MSI-H |  |
| Colorectum | FAP |  |
| ∗Top 15 enriched GO BP terms are showed in the bar plot of each disease state in each tissue. Each row represents a significant GO biological process which is colored according to the -log10(p.adjust). |
| Page: 1 2 3 4 5 6 7 8 9 |
| GO ID | Tissue | Disease Stage | Description | Gene Ratio | Bg Ratio | pvalue | p.adjust | Count |
| GO:1903320111 | Esophagus | ESCC | regulation of protein modification by small protein conjugation or removal | 181/8552 | 242/18723 | 1.80e-20 | 2.60e-18 | 181 |
| GO:0031396111 | Esophagus | ESCC | regulation of protein ubiquitination | 154/8552 | 210/18723 | 2.70e-16 | 2.04e-14 | 154 |
| GO:000941113 | Esophagus | ESCC | response to UV | 115/8552 | 149/18723 | 3.29e-15 | 1.93e-13 | 115 |
| GO:000931419 | Esophagus | ESCC | response to radiation | 277/8552 | 456/18723 | 4.42e-11 | 1.43e-09 | 277 |
| GO:190332216 | Esophagus | ESCC | positive regulation of protein modification by small protein conjugation or removal | 99/8552 | 138/18723 | 4.39e-10 | 1.16e-08 | 99 |
| GO:003464413 | Esophagus | ESCC | cellular response to UV | 70/8552 | 90/18723 | 4.59e-10 | 1.20e-08 | 70 |
| GO:007121419 | Esophagus | ESCC | cellular response to abiotic stimulus | 206/8552 | 331/18723 | 7.52e-10 | 1.88e-08 | 206 |
| GO:010400419 | Esophagus | ESCC | cellular response to environmental stimulus | 206/8552 | 331/18723 | 7.52e-10 | 1.88e-08 | 206 |
| GO:007147816 | Esophagus | ESCC | cellular response to radiation | 122/8552 | 186/18723 | 3.07e-08 | 5.73e-07 | 122 |
| GO:003139816 | Esophagus | ESCC | positive regulation of protein ubiquitination | 82/8552 | 119/18723 | 2.41e-07 | 3.64e-06 | 82 |
| GO:000941611 | Esophagus | ESCC | response to light stimulus | 183/8552 | 320/18723 | 2.03e-05 | 1.76e-04 | 183 |
| GO:00714821 | Esophagus | ESCC | cellular response to light stimulus | 75/8552 | 123/18723 | 4.45e-04 | 2.50e-03 | 75 |
| GO:00063101 | Esophagus | ESCC | DNA recombination | 168/8552 | 305/18723 | 5.58e-04 | 3.05e-03 | 168 |
| GO:007124117 | Esophagus | ESCC | cellular response to inorganic substance | 125/8552 | 226/18723 | 2.17e-03 | 9.67e-03 | 125 |
| GO:190332022 | Liver | HCC | regulation of protein modification by small protein conjugation or removal | 167/7958 | 242/18723 | 4.99e-17 | 4.72e-15 | 167 |
| GO:003139622 | Liver | HCC | regulation of protein ubiquitination | 142/7958 | 210/18723 | 1.39e-13 | 7.81e-12 | 142 |
| GO:19033221 | Liver | HCC | positive regulation of protein modification by small protein conjugation or removal | 94/7958 | 138/18723 | 9.87e-10 | 3.01e-08 | 94 |
| GO:00313981 | Liver | HCC | positive regulation of protein ubiquitination | 79/7958 | 119/18723 | 1.18e-07 | 2.26e-06 | 79 |
| GO:007121421 | Liver | HCC | cellular response to abiotic stimulus | 183/7958 | 331/18723 | 1.59e-06 | 2.26e-05 | 183 |
| GO:010400421 | Liver | HCC | cellular response to environmental stimulus | 183/7958 | 331/18723 | 1.59e-06 | 2.26e-05 | 183 |
| Page: 1 2 3 4 |
| Pathway ID | Tissue | Disease Stage | Description | Gene Ratio | Bg Ratio | pvalue | p.adjust | qvalue | Count |
| Page: 1 |
Top |
Cell-cell communication analysis |
| Identification of potential cell-cell interactions between two cell types and their ligand-receptor pairs for different disease states |
| Ligand | Receptor | LRpair | Pathway | Tissue | Disease Stage |
| Page: 1 |
Top |
Single-cell gene regulatory network inference analysis |
| Find out the significant the regulons (TFs) and the target genes of each regulon across cell types for different disease states |
| TF | Cell Type | Tissue | Disease Stage | Target Gene | RSS | Regulon Activity |
| ∗The dot plots of a searched regulon are shown for all cell subpopulations in each disease state of each tissue based on the regulon specific score inferred using pySCENIC and by calculating the average expression. |
| Page: 1 |
Top |
Somatic mutation of malignant transformation related genes |
| Annotation of somatic variants for genes involved in malignant transformation |
| Hugo Symbol | Variant Class | Variant Classification | dbSNP RS | HGVSc | HGVSp | HGVSp Short | SWISSPROT | BIOTYPE | SIFT | PolyPhen | Tumor Sample Barcode | Tissue | Histology | Sex | Age | Stage | Therapy Types | Drugs | Outcome |
| NSMCE3 | SNV | Missense_Mutation | novel | c.783N>A | p.Met261Ile | p.M261I | Q96MG7 | protein_coding | deleterious(0.01) | possibly_damaging(0.877) | TCGA-5L-AAT1-01 | Breast | breast invasive carcinoma | Female | <65 | III/IV | Hormone Therapy | letrozol | SD |
| NSMCE3 | SNV | Missense_Mutation | novel | c.868N>C | p.Glu290Gln | p.E290Q | Q96MG7 | protein_coding | tolerated(0.24) | benign(0.015) | TCGA-C5-A2LZ-01 | Cervix | cervical & endocervical cancer | Female | >=65 | III/IV | Unknown | Unknown | PD |
| NSMCE3 | SNV | Missense_Mutation | novel | c.727N>A | p.Pro243Thr | p.P243T | Q96MG7 | protein_coding | deleterious(0) | probably_damaging(1) | TCGA-AA-3950-01 | Colorectum | colon adenocarcinoma | Female | >=65 | I/II | Unknown | Unknown | SD |
| NSMCE3 | SNV | Missense_Mutation | c.649N>A | p.Gly217Arg | p.G217R | Q96MG7 | protein_coding | deleterious(0) | probably_damaging(0.978) | TCGA-G5-6641-01 | Colorectum | rectum adenocarcinoma | Male | >=65 | III/IV | Chemotherapy | oxaliplatin | SD | |
| NSMCE3 | SNV | Missense_Mutation | novel | c.434N>C | p.Leu145Pro | p.L145P | Q96MG7 | protein_coding | deleterious(0) | benign(0.414) | TCGA-AJ-A3EK-01 | Endometrium | uterine corpus endometrioid carcinoma | Female | <65 | I/II | Chemotherapy | carboplatin | CR |
| NSMCE3 | SNV | Missense_Mutation | novel | c.739G>A | p.Glu247Lys | p.E247K | Q96MG7 | protein_coding | tolerated(0.08) | possibly_damaging(0.844) | TCGA-AX-A2HC-01 | Endometrium | uterine corpus endometrioid carcinoma | Female | <65 | III/IV | Chemotherapy | paclitaxel | PD |
| NSMCE3 | SNV | Missense_Mutation | novel | c.633N>T | p.Lys211Asn | p.K211N | Q96MG7 | protein_coding | deleterious(0.03) | probably_damaging(0.954) | TCGA-B5-A11E-01 | Endometrium | uterine corpus endometrioid carcinoma | Female | <65 | I/II | Unknown | Unknown | SD |
| NSMCE3 | SNV | Missense_Mutation | c.721A>G | p.Thr241Ala | p.T241A | Q96MG7 | protein_coding | deleterious(0) | possibly_damaging(0.823) | TCGA-BS-A0UF-01 | Endometrium | uterine corpus endometrioid carcinoma | Female | >=65 | I/II | Unknown | Unknown | SD | |
| NSMCE3 | SNV | Missense_Mutation | novel | c.236N>T | p.Pro79Leu | p.P79L | Q96MG7 | protein_coding | tolerated(0.4) | benign(0.001) | TCGA-D1-A175-01 | Endometrium | uterine corpus endometrioid carcinoma | Female | <65 | I/II | Chemotherapy | paclitaxel | SD |
| NSMCE3 | SNV | Missense_Mutation | c.591N>C | p.Glu197Asp | p.E197D | Q96MG7 | protein_coding | tolerated(0.51) | benign(0.021) | TCGA-D1-A17Q-01 | Endometrium | uterine corpus endometrioid carcinoma | Female | <65 | I/II | Unknown | Unknown | SD |
| Page: 1 2 3 |
Top |
Related drugs of malignant transformation related genes |
| Identification of chemicals and drugs interact with genes involved in malignant transfromation |
| (DGIdb 4.0) |
| Entrez ID | Symbol | Category | Interaction Types | Drug Claim Name | Drug Name | PMIDs |
| Page: 1 |

Copyright 2023-Present -The University of Texas Health Science Center at Houston |