Schematic overview of the cellular and molecular mechanisms involved in the cancer progression, including the proposed cellular and molecular mechanisms in cancer cells trajectory. AT1: alveolar type 1 cells; AT2: alveolar type 2 cells; AAH: atypical adenomatous hyperplasia; AIS: adenocarcinoma in situ; MIA: minimally invasive adenocarcinoma; IA: invasive adenocarcinoma; EMT: epithelial-mesenchymal transition

Home

Download

Statistics

Help

Contact

Center for Computational Systems Medicine
leaf

Gene summary

leaf

Malignant transformation analysis

leaf

Malignant transformation related pathway analysis

leaf

Cell-cell communication analysis

leaf

Single-cell gene regulatory network inference analysis

leaf

Somatic mutation of malignant transformation related genes

leaf

Related drugs of malignant transformation related genes

Gene: NSMCE2

Gene summary for NSMCE2

check button Gene summary.

Gene informationSpeciesHuman
Gene symbol

NSMCE2

Gene ID

286053

Gene nameNSE2 (MMS21) homolog, SMC5-SMC6 complex SUMO ligase
Gene AliasC8orf36
Cytomap8q24.13
Gene Typeprotein-coding
GO ID

GO:0000070

UniProtAcc

A0A024R9J6


Top

Malignant transformation analysis

check button Identification of the aberrant gene expression in precancerous and cancerous lesions by comparing the gene expression of stem-like cells in diseased tissues with normal stem cells
check button Malignant transformation involving gene list.
Entrez IDSymbolReplicatesSpeciesOrganTissueAdj P-valueLog2FCMalignancy
286053NSMCE2CCI_1HumanCervixCC7.33e-091.10e+000.528
286053NSMCE2CCI_2HumanCervixCC7.47e-141.53e+000.5249
286053NSMCE2CCI_3HumanCervixCC1.97e-171.25e+000.516
286053NSMCE2HTA11_3410_2000001011HumanColorectumAD7.50e-12-5.11e-010.0155
286053NSMCE2HTA11_347_2000001011HumanColorectumAD1.07e-024.38e-01-0.1954
286053NSMCE2HTA11_99999965104_69814HumanColorectumMSS2.91e-035.14e-010.281
286053NSMCE2F007HumanColorectumFAP5.69e-07-3.82e-010.1176
286053NSMCE2A001-C-207HumanColorectumFAP4.14e-08-3.84e-010.1278
286053NSMCE2A015-C-203HumanColorectumFAP3.64e-30-5.48e-01-0.1294
286053NSMCE2A015-C-204HumanColorectumFAP3.53e-11-4.75e-01-0.0228
286053NSMCE2A014-C-040HumanColorectumFAP5.09e-07-4.21e-01-0.1184
286053NSMCE2A002-C-201HumanColorectumFAP2.38e-21-4.83e-010.0324
286053NSMCE2A002-C-203HumanColorectumFAP3.37e-02-1.97e-010.2786
286053NSMCE2A001-C-119HumanColorectumFAP3.47e-13-5.98e-01-0.1557
286053NSMCE2A001-C-108HumanColorectumFAP2.87e-24-5.89e-01-0.0272
286053NSMCE2A002-C-205HumanColorectumFAP4.75e-38-7.57e-01-0.1236
286053NSMCE2A001-C-104HumanColorectumFAP4.26e-06-3.90e-010.0184
286053NSMCE2A015-C-005HumanColorectumFAP3.60e-04-2.61e-01-0.0336
286053NSMCE2A015-C-006HumanColorectumFAP4.88e-26-7.55e-01-0.0994
286053NSMCE2A015-C-106HumanColorectumFAP3.13e-13-3.61e-01-0.0511
Page: 1 2 3 4 5 6 7 8 9 10 

check button Transcriptomic changes along malignancy continuum.
TissueExpression DynamicsAbbreviation
CervixThe image shows the transcriptomic changes along malignancy continuum.log2FC in expression of this searched gene in stem-like cells from each diseased tissue sample relative to stem-like cells in normal samples in each tissue plotted against the malignancy continuum. Samples are colored based on if they are from different disease stage.CC: Cervix cancer
HSIL_HPV: HPV-infected high-grade squamous intraepithelial lesions
N_HPV: HPV-infected normal cervix
Colorectum (GSE201348)The image shows the transcriptomic changes along malignancy continuum.log2FC in expression of this searched gene in stem-like cells from each diseased tissue sample relative to stem-like cells in normal samples in each tissue plotted against the malignancy continuum. Samples are colored based on if they are from different disease stage.FAP: Familial adenomatous polyposis
CRC: Colorectal cancer
Colorectum (HTA11)The image shows the transcriptomic changes along malignancy continuum.log2FC in expression of this searched gene in stem-like cells from each diseased tissue sample relative to stem-like cells in normal samples in each tissue plotted against the malignancy continuum. Samples are colored based on if they are from different disease stage.AD: Adenomas
SER: Sessile serrated lesions
MSI-H: Microsatellite-high colorectal cancer
MSS: Microsatellite stable colorectal cancer
EndometriumThe image shows the transcriptomic changes along malignancy continuum.log2FC in expression of this searched gene in stem-like cells from each diseased tissue sample relative to stem-like cells in normal samples in each tissue plotted against the malignancy continuum. Samples are colored based on if they are from different disease stage.
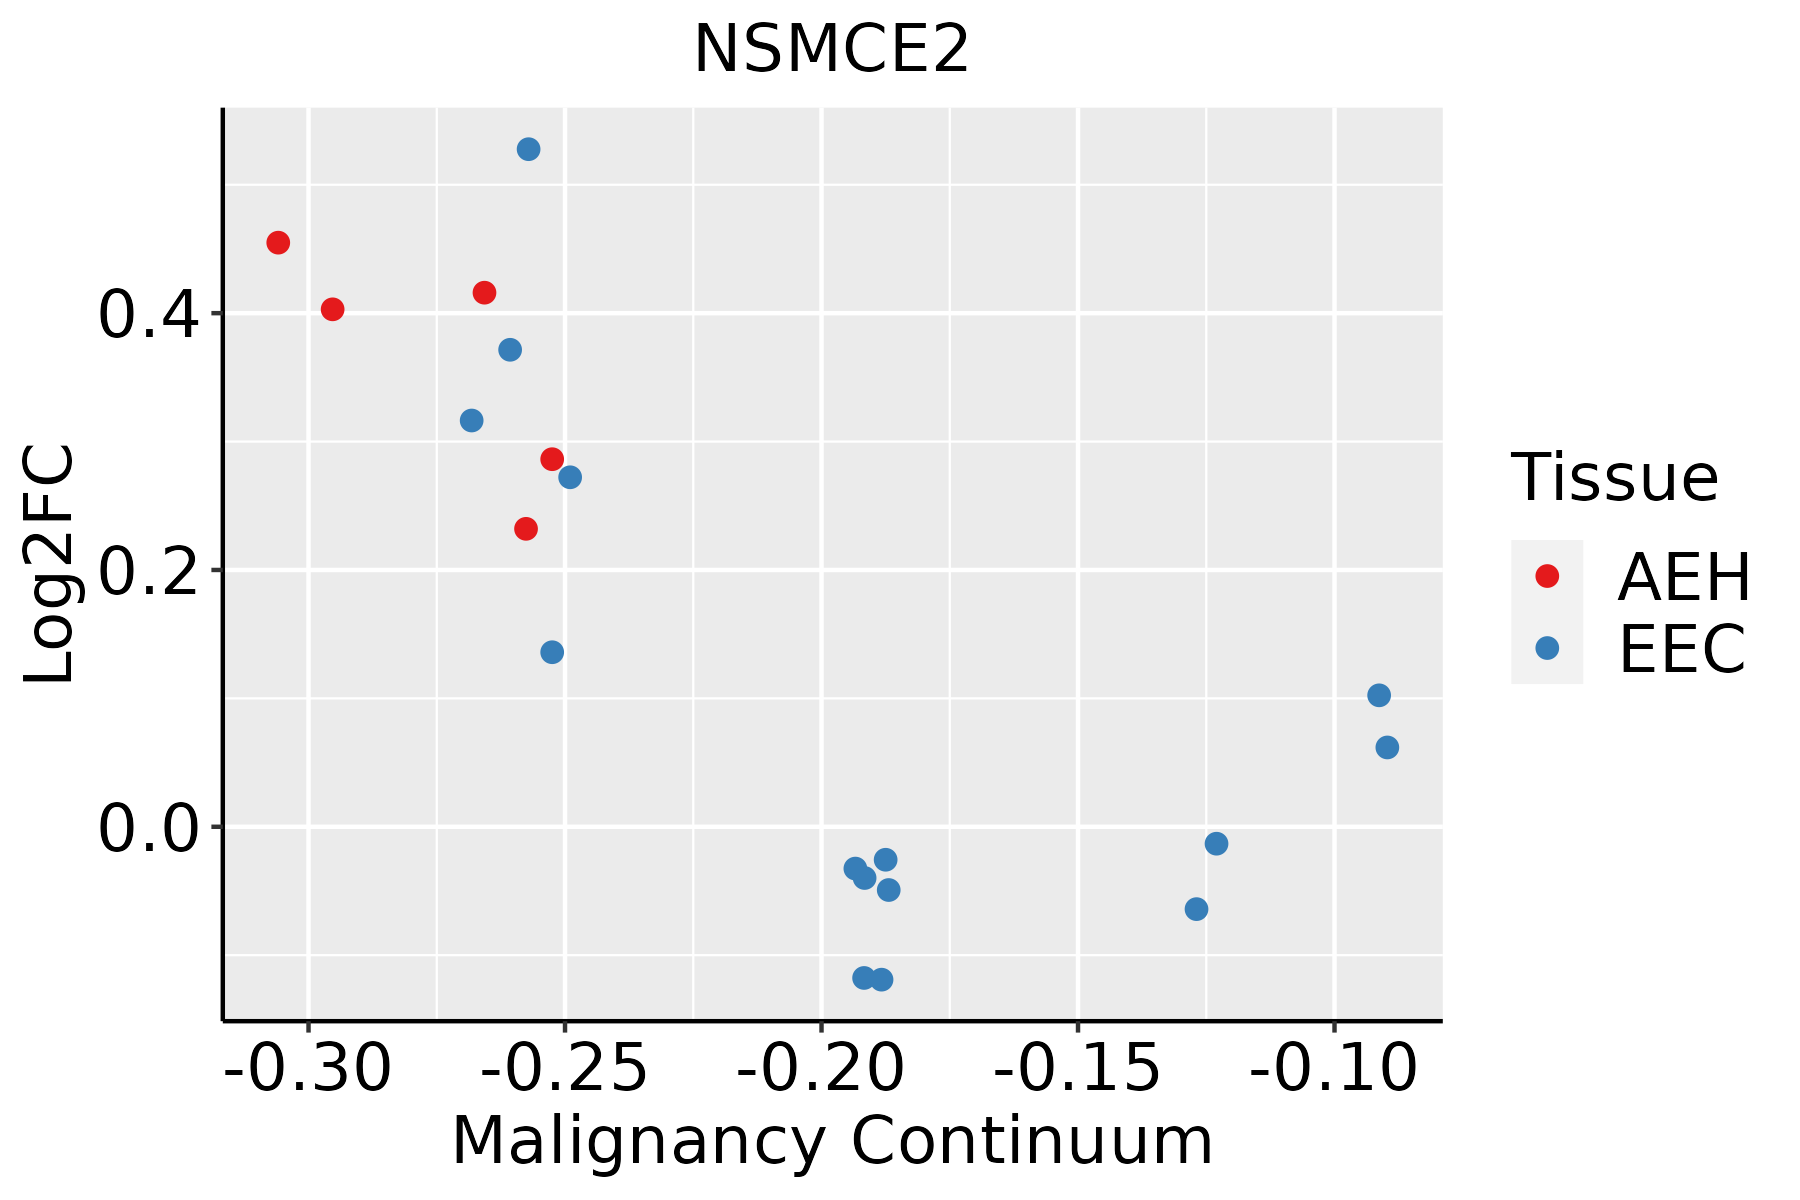
AEH: Atypical endometrial hyperplasia
EEC: Endometrioid Cancer
EsophagusThe image shows the transcriptomic changes along malignancy continuum.log2FC in expression of this searched gene in stem-like cells from each diseased tissue sample relative to stem-like cells in normal samples in each tissue plotted against the malignancy continuum. Samples are colored based on if they are from different disease stage.ESCC: Esophageal squamous cell carcinoma
HGIN: High-grade intraepithelial neoplasias
LGIN: Low-grade intraepithelial neoplasias
LiverThe image shows the transcriptomic changes along malignancy continuum.log2FC in expression of this searched gene in stem-like cells from each diseased tissue sample relative to stem-like cells in normal samples in each tissue plotted against the malignancy continuum. Samples are colored based on if they are from different disease stage.HCC: Hepatocellular carcinoma
NAFLD: Non-alcoholic fatty liver disease
LungThe image shows the transcriptomic changes along malignancy continuum.log2FC in expression of this searched gene in stem-like cells from each diseased tissue sample relative to stem-like cells in normal samples in each tissue plotted against the malignancy continuum. Samples are colored based on if they are from different disease stage.AAH: Atypical adenomatous hyperplasia
AIS: Adenocarcinoma in situ
IAC: Invasive lung adenocarcinoma
MIA: Minimally invasive adenocarcinoma
Oral CavityThe image shows the transcriptomic changes along malignancy continuum.log2FC in expression of this searched gene in stem-like cells from each diseased tissue sample relative to stem-like cells in normal samples in each tissue plotted against the malignancy continuum. Samples are colored based on if they are from different disease stage.
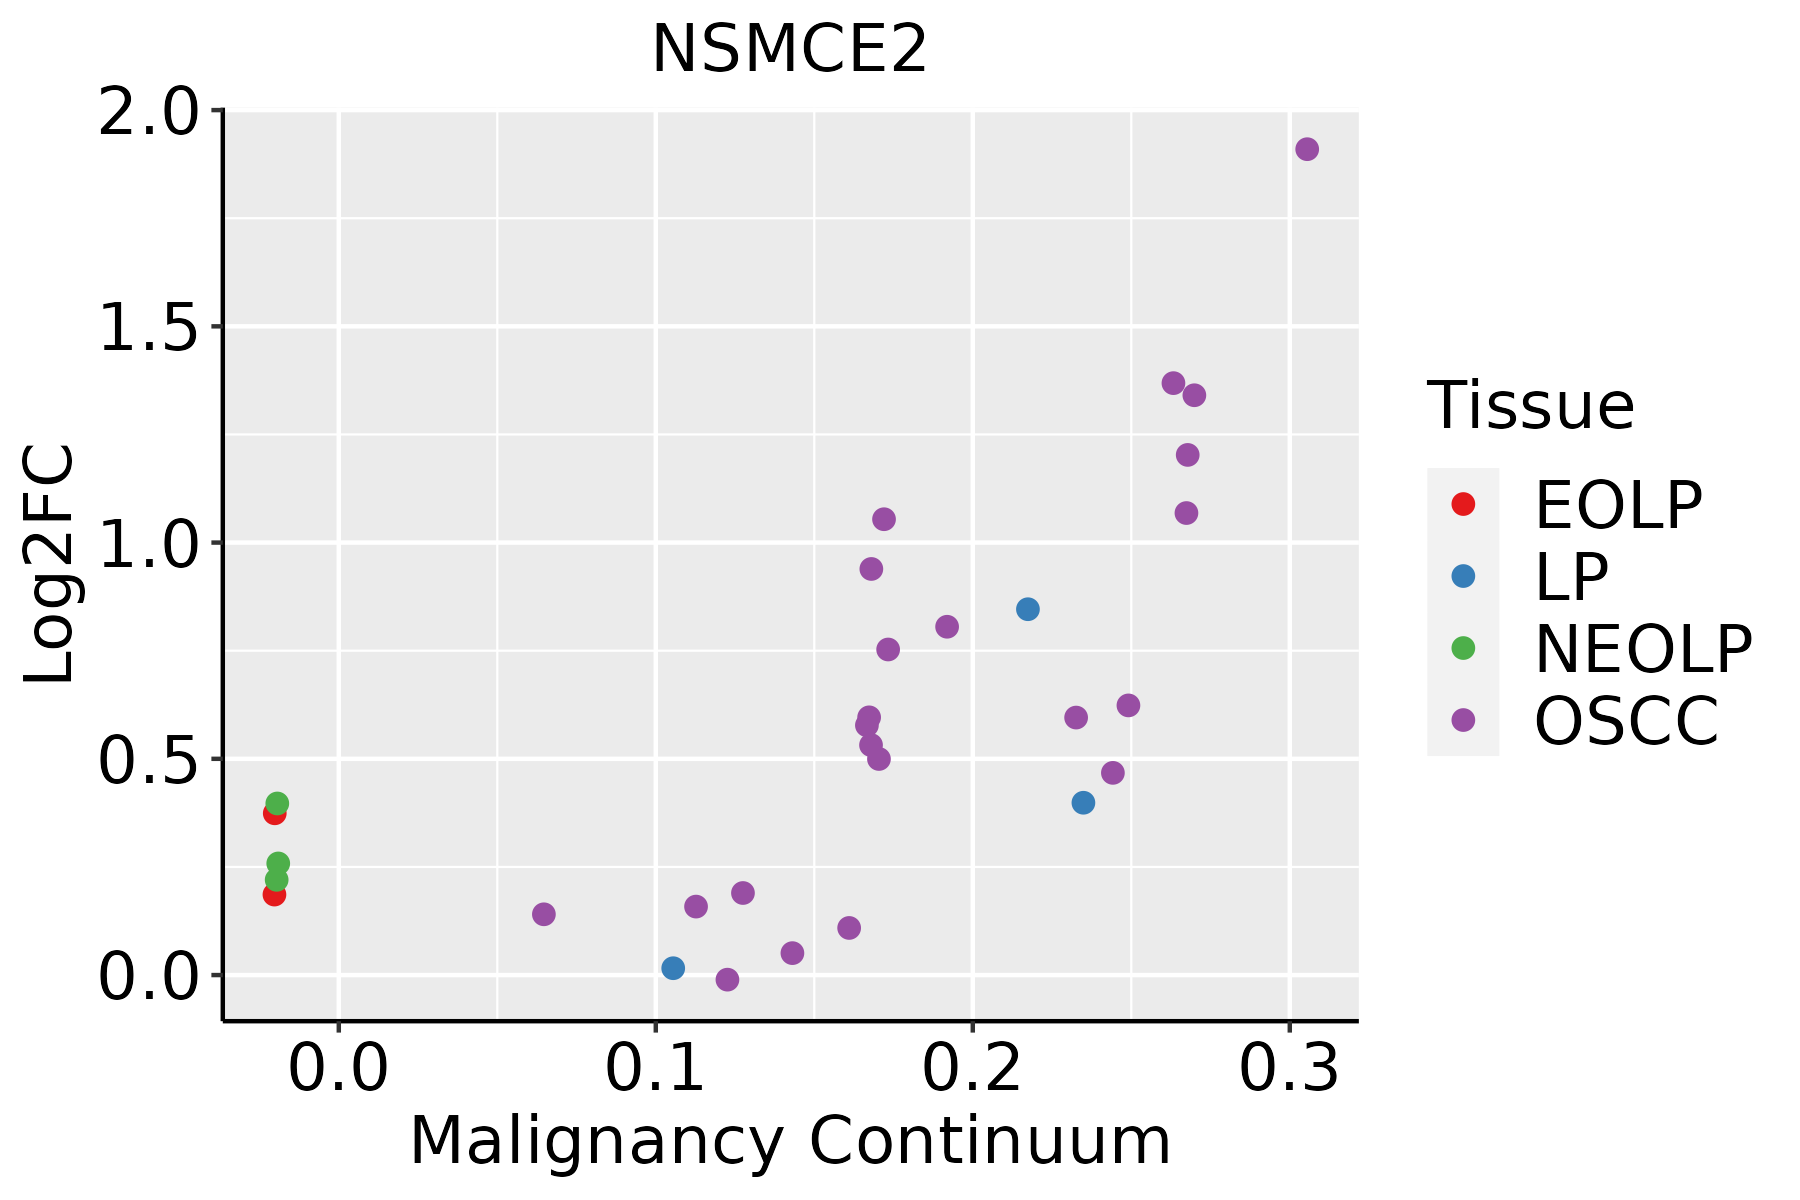
EOLP: Erosive Oral lichen planus
LP: leukoplakia
NEOLP: Non-erosive oral lichen planus
OSCC: Oral squamous cell carcinoma
ProstateThe image shows the transcriptomic changes along malignancy continuum.log2FC in expression of this searched gene in stem-like cells from each diseased tissue sample relative to stem-like cells in normal samples in each tissue plotted against the malignancy continuum. Samples are colored based on if they are from different disease stage.
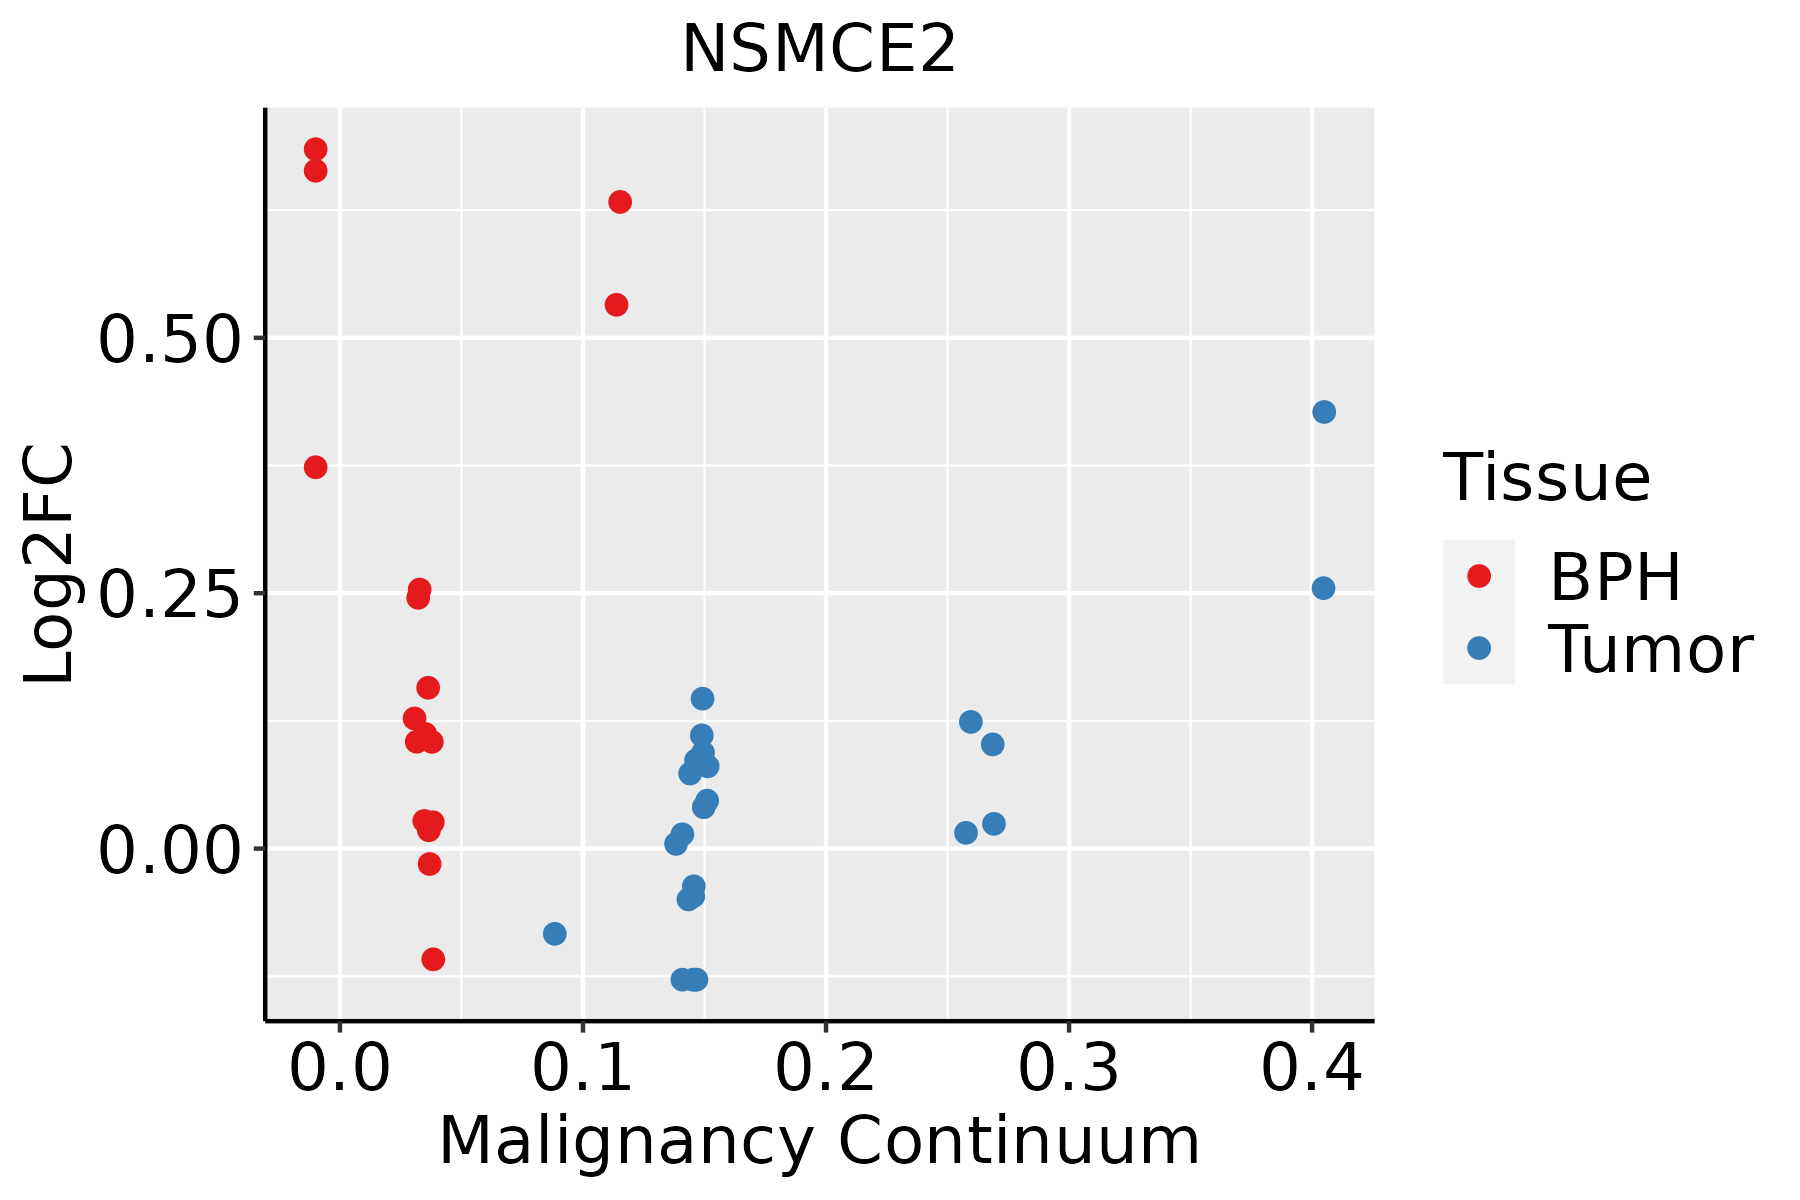
BPH: Benign Prostatic Hyperplasia
SkinThe image shows the transcriptomic changes along malignancy continuum.log2FC in expression of this searched gene in stem-like cells from each diseased tissue sample relative to stem-like cells in normal samples in each tissue plotted against the malignancy continuum. Samples are colored based on if they are from different disease stage.
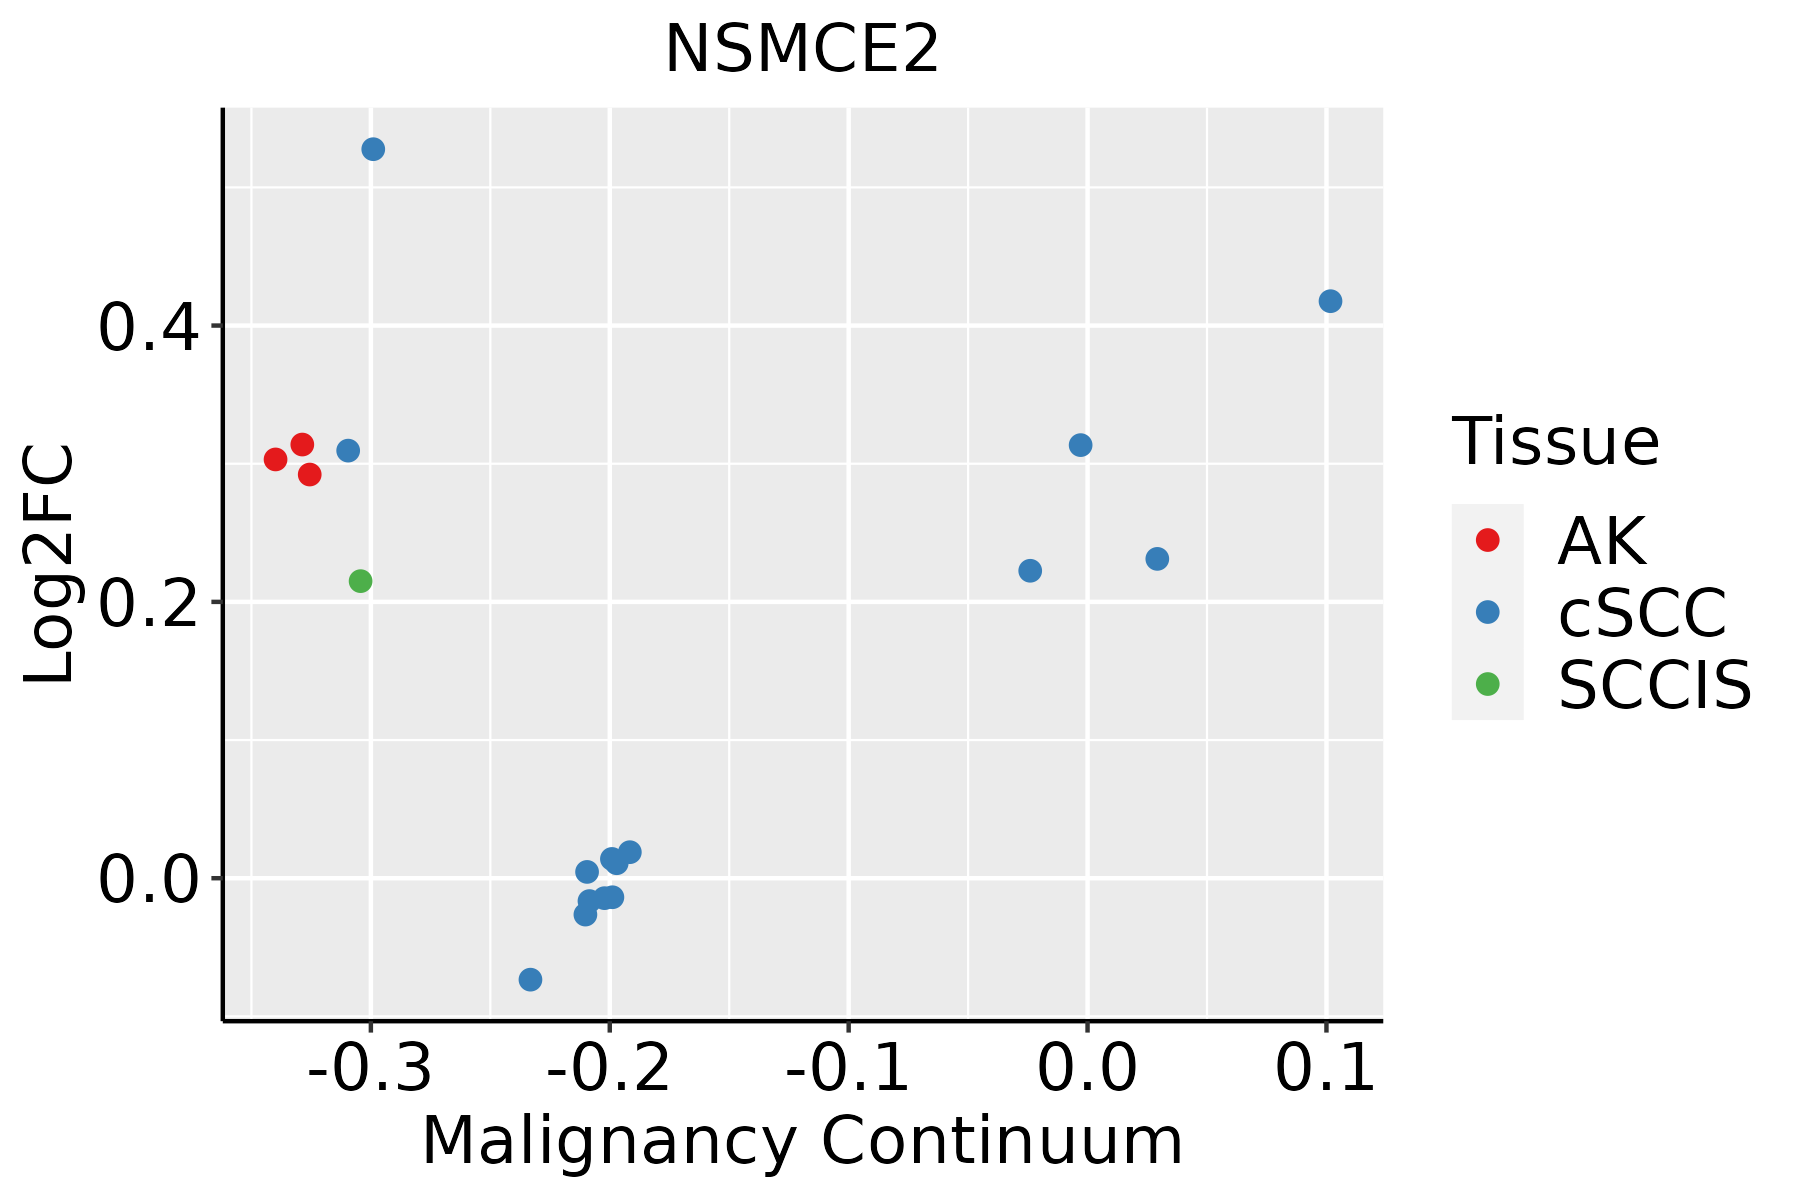
AK: Actinic keratosis
cSCC: Cutaneous squamous cell carcinoma
SCCIS:squamous cell carcinoma in situ
∗log2FC in expression of this searched gene in stem-like cells from each diseased tissue sample relative to stem-like cells in normal samples in each tissue plotted against the malignancy continuum. Samples are colored based on if they are from different disease stage.

Top

Malignant transformation related pathway analysis

check buttonFind out the enriched GO biological processes and KEGG pathways involved in transition from healthy to precancer to cancer
check button Figure of enriched GO biological processes.
TissueDisease StageEnriched GO biological Processes
ColorectumADGO analysis - Figure of enriched GO biological processes: Top 15 enriched GO BP terms are showed in the bar plot of each disease state in each tissue. Each row represents a significant GO biological process which is colored according to the -log10(p.adjust).
ColorectumSERGO analysis - Figure of enriched GO biological processes: Top 15 enriched GO BP terms are showed in the bar plot of each disease state in each tissue. Each row represents a significant GO biological process which is colored according to the -log10(p.adjust).
ColorectumMSSGO analysis - Figure of enriched GO biological processes: Top 15 enriched GO BP terms are showed in the bar plot of each disease state in each tissue. Each row represents a significant GO biological process which is colored according to the -log10(p.adjust).
ColorectumMSI-HGO analysis - Figure of enriched GO biological processes: Top 15 enriched GO BP terms are showed in the bar plot of each disease state in each tissue. Each row represents a significant GO biological process which is colored according to the -log10(p.adjust).
ColorectumFAPGO analysis - Figure of enriched GO biological processes: Top 15 enriched GO BP terms are showed in the bar plot of each disease state in each tissue. Each row represents a significant GO biological process which is colored according to the -log10(p.adjust).
∗Top 15 enriched GO BP terms are showed in the bar plot of each disease state in each tissue. Each row represents a significant GO biological process which is colored according to the -log10(p.adjust).
Page: 1 2 3 4 5 6 7 8 9 

check button Enriched GO biological processes.
GO IDTissueDisease StageDescriptionGene RatioBg Ratiopvaluep.adjustCount
GO:00447725CervixCCmitotic cell cycle phase transition89/2311424/187232.70e-071.12e-0589
GO:00075689CervixCCaging75/2311339/187232.75e-071.13e-0575
GO:00457876CervixCCpositive regulation of cell cycle66/2311313/187237.78e-061.81e-0466
GO:00073466CervixCCregulation of mitotic cell cycle88/2311457/187231.26e-052.60e-0488
GO:19019903CervixCCregulation of mitotic cell cycle phase transition63/2311299/187231.27e-052.60e-0463
GO:00459316CervixCCpositive regulation of mitotic cell cycle32/2311121/187231.88e-053.47e-0432
GO:00075695CervixCCcell aging34/2311132/187231.92e-053.53e-0434
GO:19019922CervixCCpositive regulation of mitotic cell cycle phase transition26/231193/187233.97e-056.18e-0426
GO:00070646CervixCCmitotic sister chromatid cohesion12/231128/187235.47e-058.06e-0412
GO:00900685CervixCCpositive regulation of cell cycle process50/2311236/187238.25e-051.11e-0350
GO:19019873CervixCCregulation of cell cycle phase transition74/2311390/187239.80e-051.27e-0374
GO:00903981CervixCCcellular senescence25/231193/187231.11e-041.40e-0325
GO:00340864CervixCCmaintenance of sister chromatid cohesion7/231112/187231.94e-042.24e-037
GO:00340884CervixCCmaintenance of mitotic sister chromatid cohesion7/231112/187231.94e-042.24e-037
GO:19019892CervixCCpositive regulation of cell cycle phase transition28/2311115/187232.82e-043.07e-0328
GO:01400143CervixCCmitotic nuclear division50/2311287/187237.27e-033.91e-0250
GO:00070625CervixCCsister chromatid cohesion15/231162/187237.30e-033.92e-0215
GO:00007239CervixCCtelomere maintenance26/2311131/187239.33e-034.66e-0226
GO:00482851CervixCCorganelle fission78/2311488/187239.70e-034.79e-0278
GO:00182054CervixCCpeptidyl-lysine modification62/2311376/187231.04e-024.97e-0262
Page: 1 2 3 4 5 6 7 8 9 10 11 12 13 14 15 16 17 18 19 20 21 22 

check button Enriched KEGG pathways.
Pathway IDTissueDisease StageDescriptionGene RatioBg Ratiopvaluep.adjustqvalueCount
Page: 1 

Top

Cell-cell communication analysis

check buttonIdentification of potential cell-cell interactions between two cell types and their ligand-receptor pairs for different disease states
LigandReceptorLRpairPathwayTissueDisease Stage
Page: 1 

Top

Single-cell gene regulatory network inference analysis

check buttonFind out the significant the regulons (TFs) and the target genes of each regulon across cell types for different disease states
TFCell TypeTissueDisease StageTarget GeneRSSRegulon Activity
∗The dot plots of a searched regulon are shown for all cell subpopulations in each disease state of each tissue based on the regulon specific score inferred using pySCENIC and by calculating the average expression.
Page: 1 

Top

Somatic mutation of malignant transformation related genes

check buttonAnnotation of somatic variants for genes involved in malignant transformation
Hugo SymbolVariant ClassVariant ClassificationdbSNP RSHGVScHGVSpHGVSp ShortSWISSPROTBIOTYPESIFTPolyPhenTumor Sample BarcodeTissueHistologySexAgeStageTherapy TypesDrugsOutcome
NSMCE2SNVMissense_Mutationc.313N>Cp.Glu105Glnp.E105QQ96MF7protein_codingtolerated(0.49)benign(0.007)TCGA-AC-A23H-01Breastbreast invasive carcinomaFemale>=65I/IIUnknownUnknownPD
NSMCE2SNVMissense_Mutationnovelc.571G>Cp.Glu191Glnp.E191QQ96MF7protein_codingtolerated(0.18)probably_damaging(0.927)TCGA-BH-A18T-01Breastbreast invasive carcinomaFemale>=65I/IIUnknownUnknownPD
NSMCE2SNVMissense_Mutationnovelc.672N>Ap.Asp224Glup.D224EQ96MF7protein_codingdeleterious(0)probably_damaging(0.991)TCGA-EK-A2PM-01Cervixcervical & endocervical cancerFemale>=65I/IIUnknownUnknownSD
NSMCE2SNVMissense_Mutationrs140125530c.11G>Ap.Arg4Hisp.R4HQ96MF7protein_codingdeleterious_low_confidence(0.05)benign(0)TCGA-A5-A2K3-01Endometriumuterine corpus endometrioid carcinomaFemale>=65I/IIChemotherapycarboplatinSD
NSMCE2SNVMissense_Mutationnovelc.133N>Ap.Ala45Thrp.A45TQ96MF7protein_codingdeleterious(0)probably_damaging(0.996)TCGA-AX-A1CE-01Endometriumuterine corpus endometrioid carcinomaFemale<65I/IIUnspecificPaclitaxelSD
NSMCE2SNVMissense_Mutationrs137953740c.610N>Tp.Arg204Trpp.R204WQ96MF7protein_codingdeleterious(0)possibly_damaging(0.88)TCGA-B5-A11E-01Endometriumuterine corpus endometrioid carcinomaFemale<65I/IIUnknownUnknownSD
NSMCE2SNVMissense_Mutationc.295G>Ap.Asp99Asnp.D99NQ96MF7protein_codingtolerated(0.33)possibly_damaging(0.5)TCGA-B5-A1MR-01Endometriumuterine corpus endometrioid carcinomaFemale>=65III/IVUnknownUnknownSD
NSMCE2SNVMissense_Mutationnovelc.321A>Tp.Lys107Asnp.K107NQ96MF7protein_codingdeleterious(0.03)benign(0.007)TCGA-BS-A0UF-01Endometriumuterine corpus endometrioid carcinomaFemale>=65I/IIUnknownUnknownSD
NSMCE2SNVMissense_Mutationnovelc.374N>Cp.Lys125Thrp.K125TQ96MF7protein_codingdeleterious(0.04)benign(0.193)TCGA-D1-A103-01Endometriumuterine corpus endometrioid carcinomaFemale>=65I/IIUnknownUnknownSD
NSMCE2SNVMissense_Mutationnovelc.308N>Cp.Leu103Serp.L103SQ96MF7protein_codingtolerated(0.19)probably_damaging(0.946)TCGA-D1-A175-01Endometriumuterine corpus endometrioid carcinomaFemale<65I/IIChemotherapypaclitaxelSD
Page: 1 2 3 

Top

Related drugs of malignant transformation related genes

check buttonIdentification of chemicals and drugs interact with genes involved in malignant transfromation
(DGIdb 4.0)
Entrez IDSymbolCategoryInteraction TypesDrug Claim NameDrug NamePMIDs
Page: 1