
|
|||||
|
 | |
| |
| |
| |
| |
| |
|
Gene: NSMCE1 |
Gene summary for NSMCE1 |
| Gene information | Species | Human | Gene symbol | NSMCE1 | Gene ID | 197370 |
| Gene name | NSE1 homolog, SMC5-SMC6 complex component | |
| Gene Alias | NSE1 | |
| Cytomap | 16p12.1 | |
| Gene Type | protein-coding | GO ID | GO:0000724 | UniProtAcc | Q8WV22 |
Top |
Malignant transformation analysis |
| Identification of the aberrant gene expression in precancerous and cancerous lesions by comparing the gene expression of stem-like cells in diseased tissues with normal stem cells |
| Entrez ID | Symbol | Replicates | Species | Organ | Tissue | Adj P-value | Log2FC | Malignancy |
| 197370 | NSMCE1 | CA_HPV_1 | Human | Cervix | CC | 2.86e-11 | -4.53e-01 | 0.0264 |
| 197370 | NSMCE1 | CCI_1 | Human | Cervix | CC | 3.06e-02 | -5.20e-01 | 0.528 |
| 197370 | NSMCE1 | CCI_3 | Human | Cervix | CC | 1.19e-04 | -5.43e-01 | 0.516 |
| 197370 | NSMCE1 | CCII_1 | Human | Cervix | CC | 9.32e-11 | -5.97e-01 | 0.3249 |
| 197370 | NSMCE1 | Tumor | Human | Cervix | CC | 1.68e-07 | -4.50e-01 | 0.1241 |
| 197370 | NSMCE1 | sample3 | Human | Cervix | CC | 2.95e-10 | -4.48e-01 | 0.1387 |
| 197370 | NSMCE1 | H2 | Human | Cervix | HSIL_HPV | 5.16e-06 | -4.09e-01 | 0.0632 |
| 197370 | NSMCE1 | L1 | Human | Cervix | CC | 7.52e-07 | -4.89e-01 | 0.0802 |
| 197370 | NSMCE1 | T1 | Human | Cervix | CC | 1.62e-08 | -4.42e-01 | 0.0918 |
| 197370 | NSMCE1 | T2 | Human | Cervix | CC | 7.66e-03 | -5.68e-01 | 0.0709 |
| 197370 | NSMCE1 | T3 | Human | Cervix | CC | 1.23e-10 | -4.53e-01 | 0.1389 |
| 197370 | NSMCE1 | HTA11_3410_2000001011 | Human | Colorectum | AD | 8.34e-08 | 2.39e-01 | 0.0155 |
| 197370 | NSMCE1 | HTA11_2487_2000001011 | Human | Colorectum | SER | 5.92e-10 | 4.09e-01 | -0.1808 |
| 197370 | NSMCE1 | HTA11_2951_2000001011 | Human | Colorectum | AD | 4.06e-03 | 3.76e-01 | 0.0216 |
| 197370 | NSMCE1 | HTA11_1938_2000001011 | Human | Colorectum | AD | 2.22e-03 | 2.30e-01 | -0.0811 |
| 197370 | NSMCE1 | HTA11_78_2000001011 | Human | Colorectum | AD | 1.57e-09 | 4.14e-01 | -0.1088 |
| 197370 | NSMCE1 | HTA11_347_2000001011 | Human | Colorectum | AD | 1.29e-19 | 5.16e-01 | -0.1954 |
| 197370 | NSMCE1 | HTA11_3361_2000001011 | Human | Colorectum | AD | 6.59e-07 | 4.12e-01 | -0.1207 |
| 197370 | NSMCE1 | HTA11_83_2000001011 | Human | Colorectum | SER | 6.88e-10 | 4.42e-01 | -0.1526 |
| 197370 | NSMCE1 | HTA11_696_2000001011 | Human | Colorectum | AD | 1.28e-20 | 5.58e-01 | -0.1464 |
| Page: 1 2 3 4 5 6 7 8 9 |
| Tissue | Expression Dynamics | Abbreviation |
| Cervix | 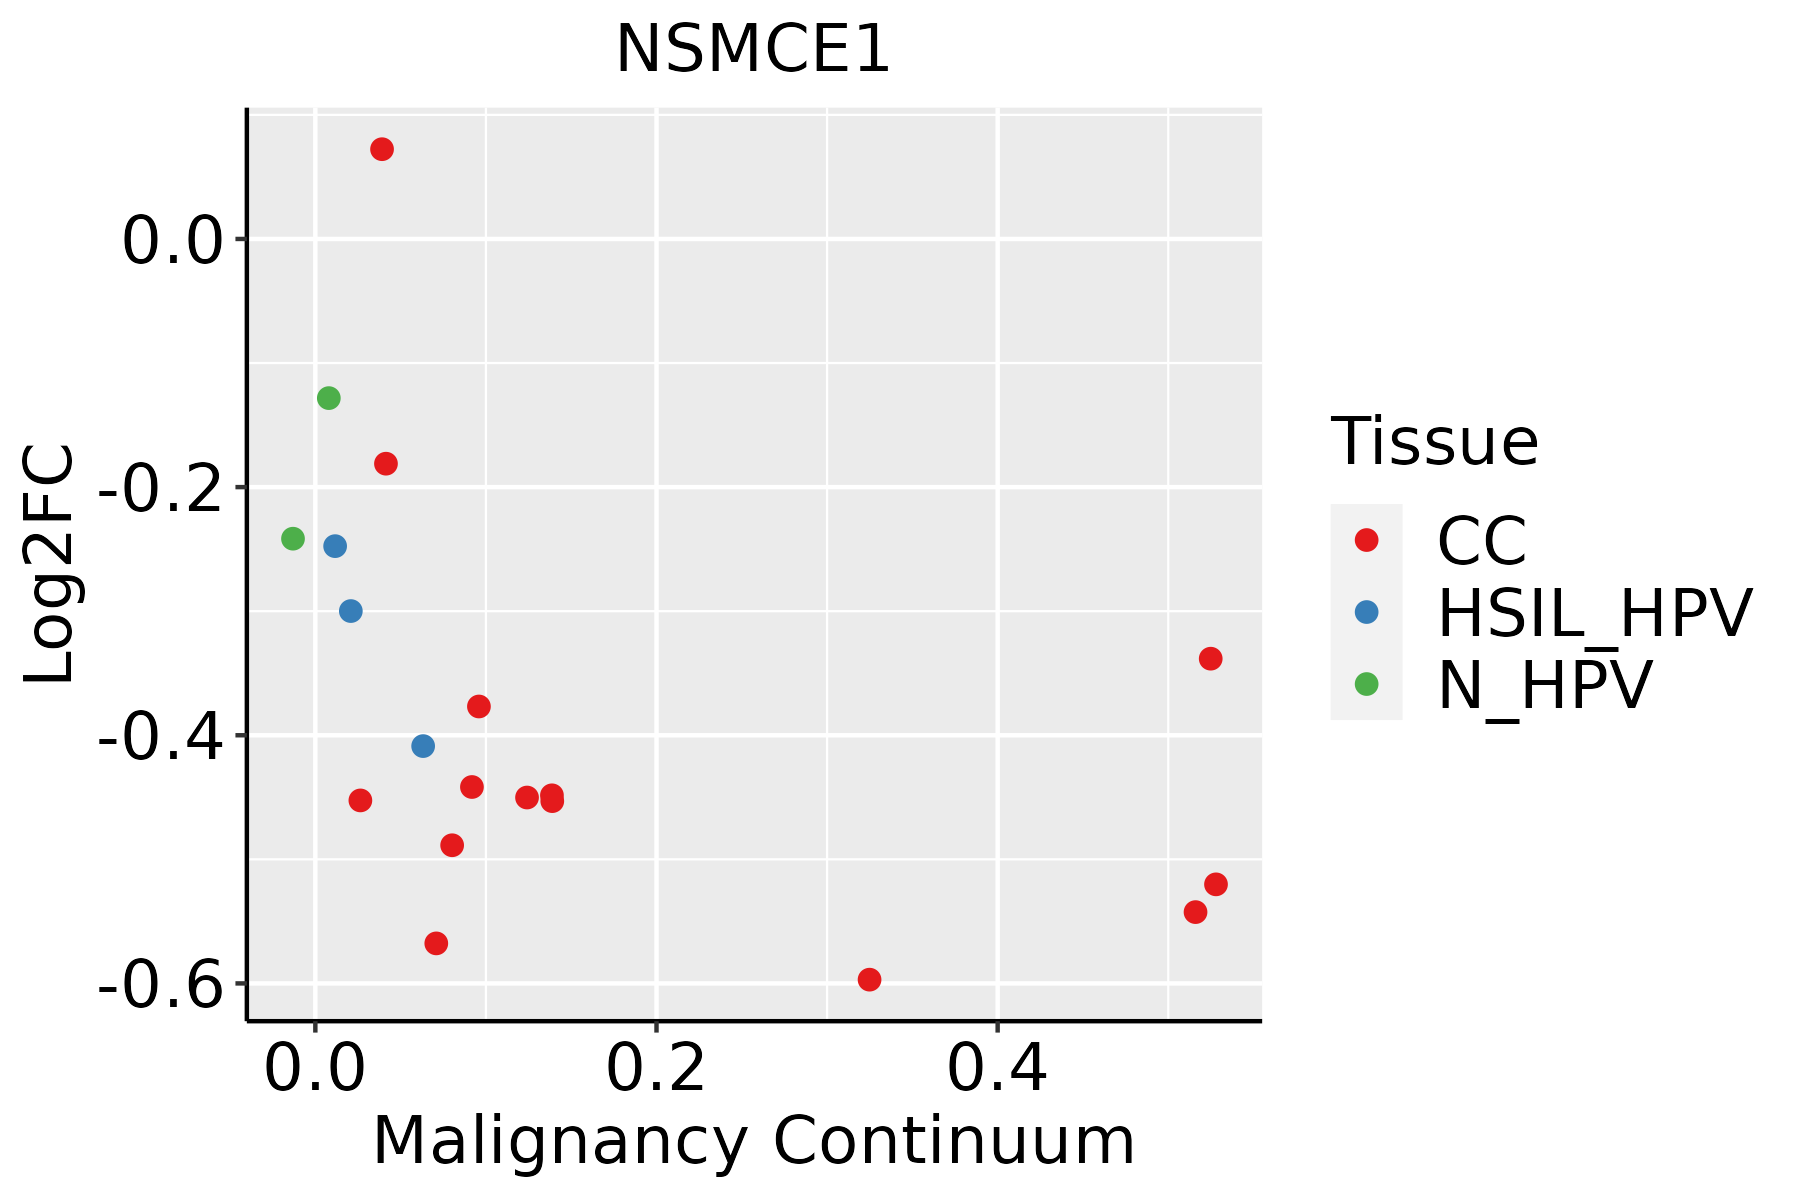 | CC: Cervix cancer |
| HSIL_HPV: HPV-infected high-grade squamous intraepithelial lesions | ||
| N_HPV: HPV-infected normal cervix | ||
| Colorectum (GSE201348) |  | FAP: Familial adenomatous polyposis |
| CRC: Colorectal cancer | ||
| Colorectum (HTA11) |  | AD: Adenomas |
| SER: Sessile serrated lesions | ||
| MSI-H: Microsatellite-high colorectal cancer | ||
| MSS: Microsatellite stable colorectal cancer | ||
| Esophagus | 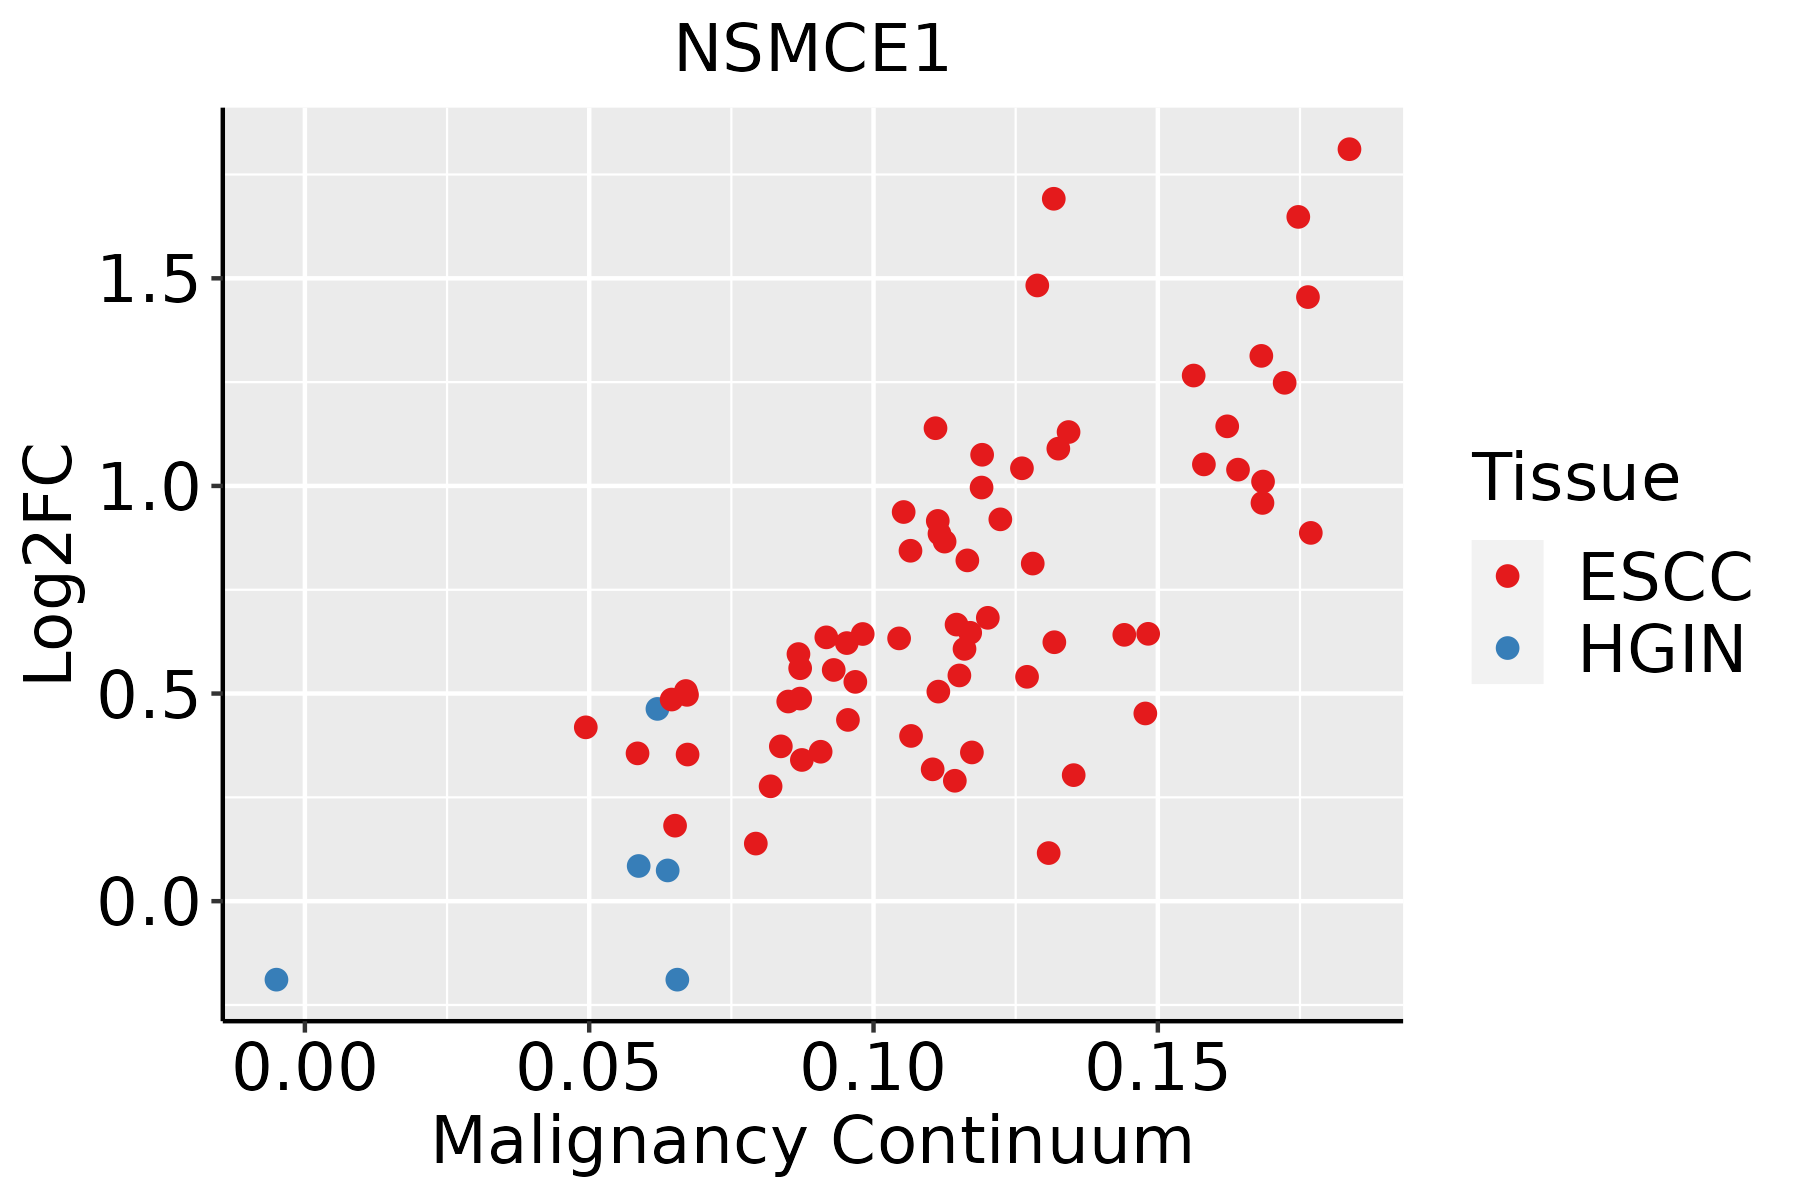 | ESCC: Esophageal squamous cell carcinoma |
| HGIN: High-grade intraepithelial neoplasias | ||
| LGIN: Low-grade intraepithelial neoplasias | ||
| Liver |  | HCC: Hepatocellular carcinoma |
| NAFLD: Non-alcoholic fatty liver disease | ||
| Oral Cavity | 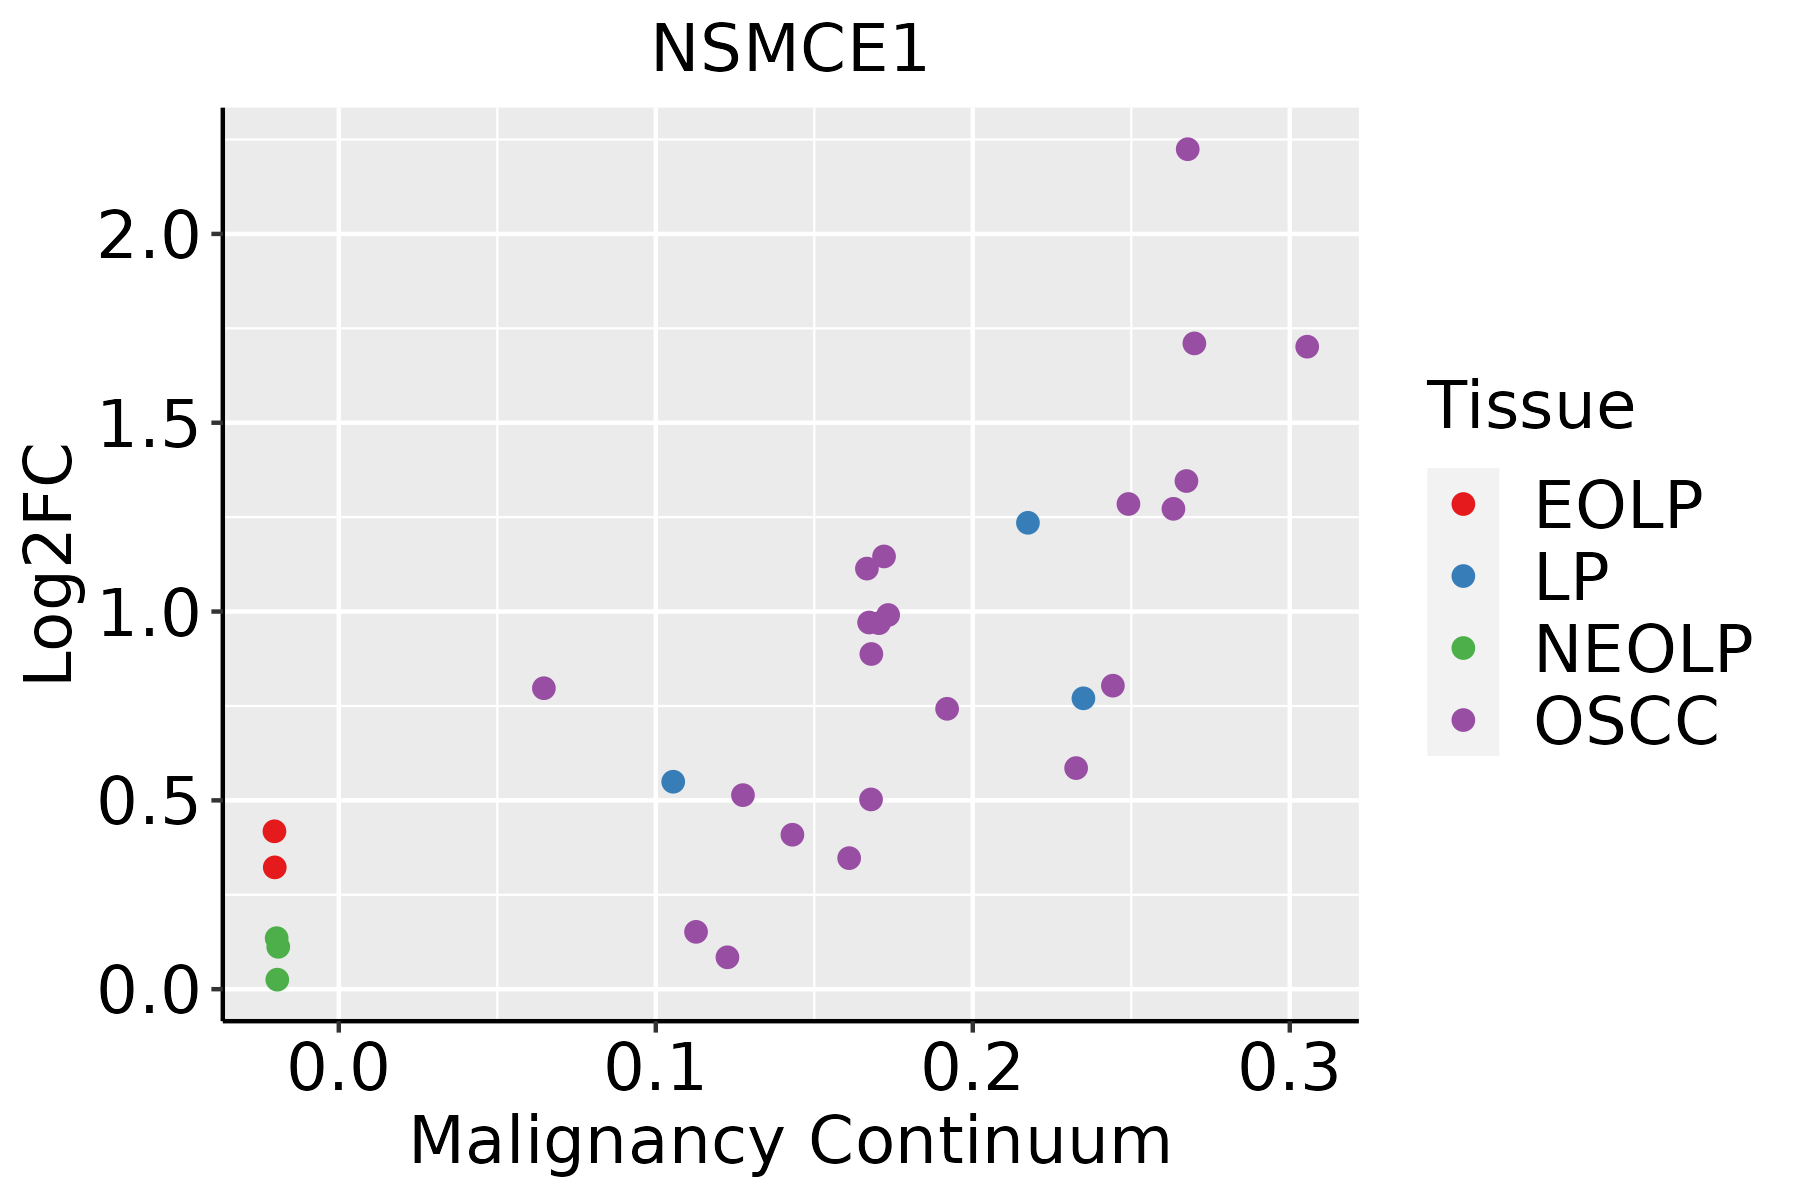 | EOLP: Erosive Oral lichen planus |
| LP: leukoplakia | ||
| NEOLP: Non-erosive oral lichen planus | ||
| OSCC: Oral squamous cell carcinoma | ||
| Prostate |  | BPH: Benign Prostatic Hyperplasia |
| Skin |  | AK: Actinic keratosis |
| cSCC: Cutaneous squamous cell carcinoma | ||
| SCCIS:squamous cell carcinoma in situ | ||
| Thyroid | 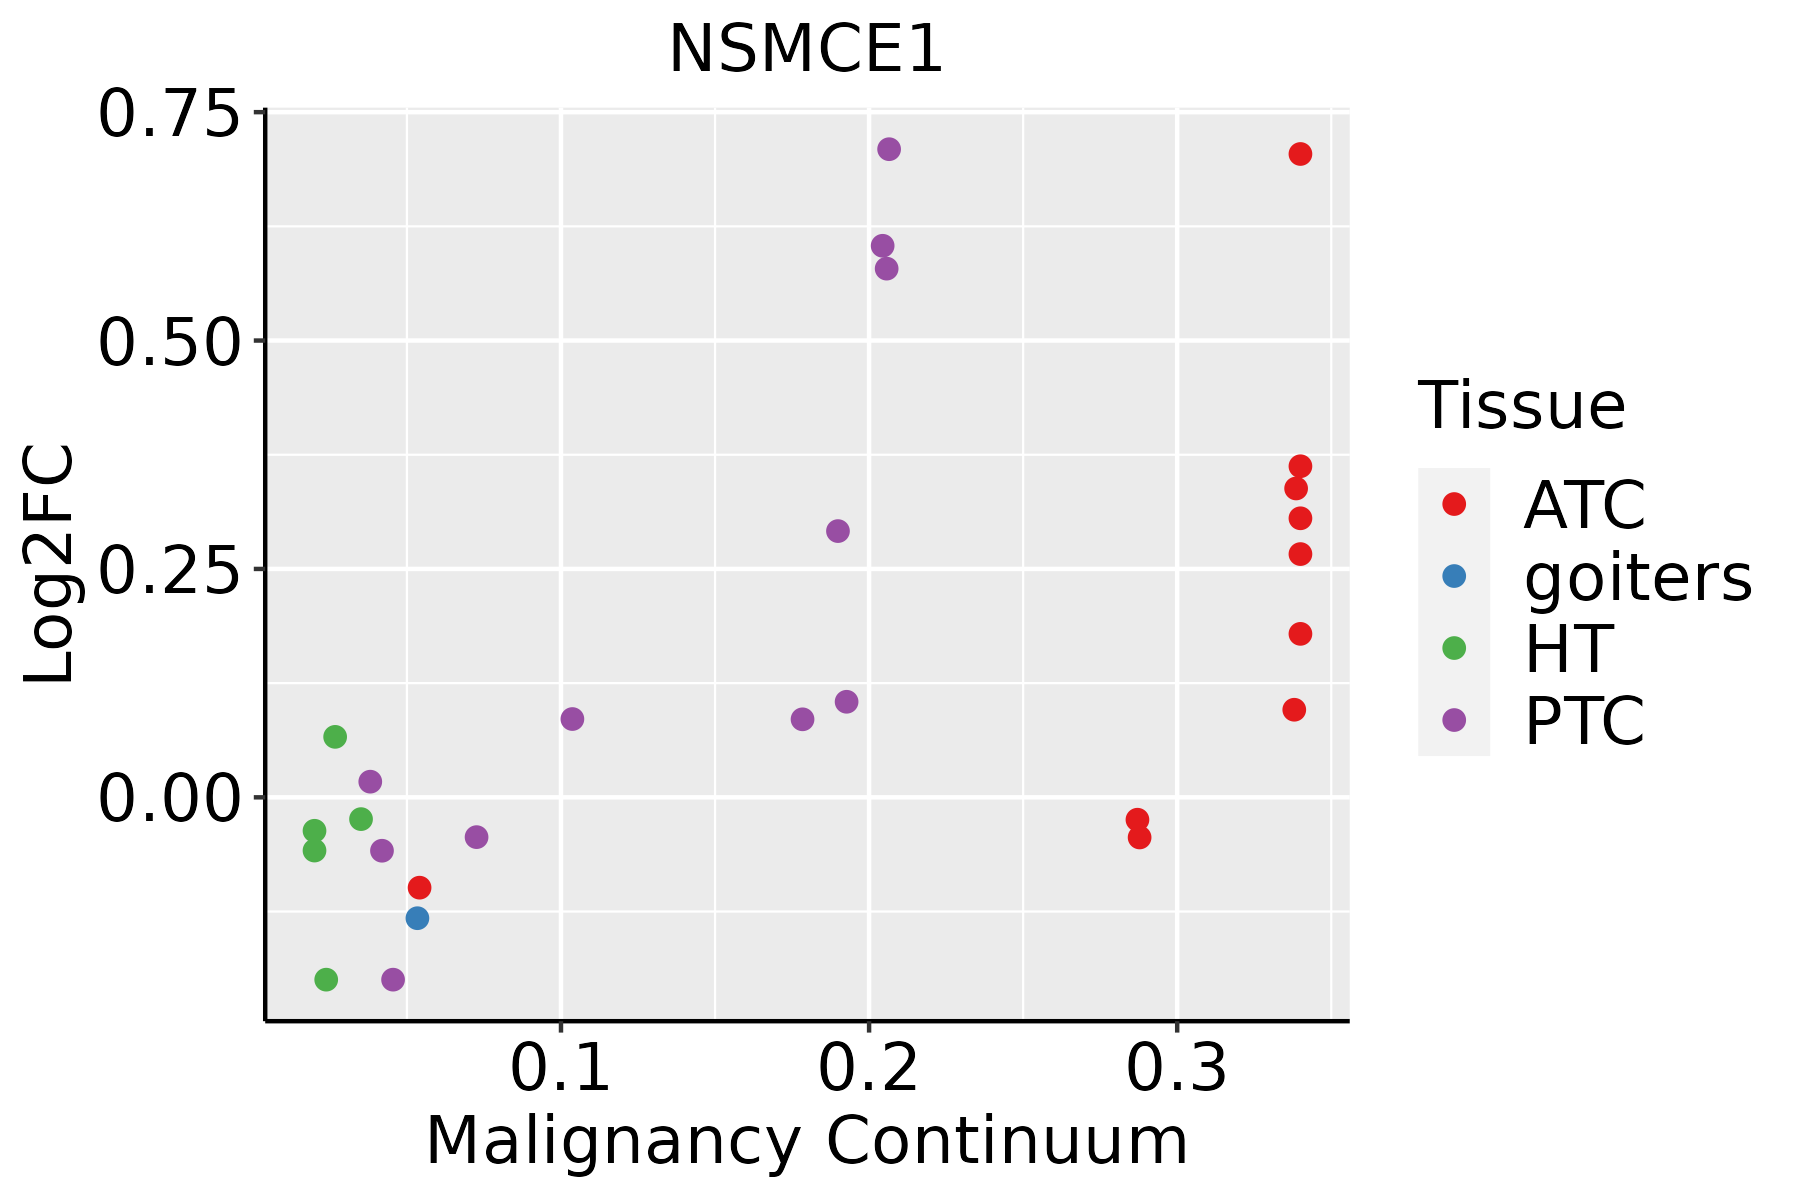 | ATC: Anaplastic thyroid cancer |
| HT: Hashimoto's thyroiditis | ||
| PTC: Papillary thyroid cancer |
| ∗log2FC in expression of this searched gene in stem-like cells from each diseased tissue sample relative to stem-like cells in normal samples in each tissue plotted against the malignancy continuum. Samples are colored based on if they are from different disease stage. |
Top |
Malignant transformation related pathway analysis |
| Find out the enriched GO biological processes and KEGG pathways involved in transition from healthy to precancer to cancer |
| Tissue | Disease Stage | Enriched GO biological Processes |
| Colorectum | AD |  |
| Colorectum | SER |  |
| Colorectum | MSS |  |
| Colorectum | MSI-H |  |
| Colorectum | FAP |  |
| ∗Top 15 enriched GO BP terms are showed in the bar plot of each disease state in each tissue. Each row represents a significant GO biological process which is colored according to the -log10(p.adjust). |
| Page: 1 2 3 4 5 6 7 8 9 |
| GO ID | Tissue | Disease Stage | Description | Gene Ratio | Bg Ratio | pvalue | p.adjust | Count |
| GO:20010209 | Cervix | CC | regulation of response to DNA damage stimulus | 46/2311 | 219/18723 | 1.92e-04 | 2.23e-03 | 46 |
| GO:2001020 | Colorectum | AD | regulation of response to DNA damage stimulus | 71/3918 | 219/18723 | 4.38e-05 | 7.65e-04 | 71 |
| GO:2001022 | Colorectum | AD | positive regulation of response to DNA damage stimulus | 36/3918 | 105/18723 | 1.02e-03 | 9.47e-03 | 36 |
| GO:20010201 | Colorectum | SER | regulation of response to DNA damage stimulus | 49/2897 | 219/18723 | 4.24e-03 | 3.45e-02 | 49 |
| GO:20010202 | Colorectum | MSS | regulation of response to DNA damage stimulus | 64/3467 | 219/18723 | 7.20e-05 | 1.21e-03 | 64 |
| GO:20010221 | Colorectum | MSS | positive regulation of response to DNA damage stimulus | 33/3467 | 105/18723 | 9.83e-04 | 9.86e-03 | 33 |
| GO:0006302 | Colorectum | MSS | double-strand break repair | 64/3467 | 251/18723 | 3.58e-03 | 2.65e-02 | 64 |
| GO:2001020110 | Esophagus | ESCC | regulation of response to DNA damage stimulus | 145/8552 | 219/18723 | 5.97e-10 | 1.50e-08 | 145 |
| GO:00063024 | Esophagus | ESCC | double-strand break repair | 152/8552 | 251/18723 | 1.33e-06 | 1.62e-05 | 152 |
| GO:00063012 | Esophagus | ESCC | postreplication repair | 26/8552 | 31/18723 | 1.32e-05 | 1.21e-04 | 26 |
| GO:20010228 | Esophagus | ESCC | positive regulation of response to DNA damage stimulus | 69/8552 | 105/18723 | 2.66e-05 | 2.22e-04 | 69 |
| GO:00063101 | Esophagus | ESCC | DNA recombination | 168/8552 | 305/18723 | 5.58e-04 | 3.05e-03 | 168 |
| GO:00007241 | Esophagus | ESCC | double-strand break repair via homologous recombination | 79/8552 | 138/18723 | 4.05e-03 | 1.62e-02 | 79 |
| GO:00007251 | Esophagus | ESCC | recombinational repair | 80/8552 | 140/18723 | 4.10e-03 | 1.63e-02 | 80 |
| GO:200102011 | Liver | Cirrhotic | regulation of response to DNA damage stimulus | 75/4634 | 219/18723 | 9.75e-04 | 6.89e-03 | 75 |
| GO:0006301 | Liver | Cirrhotic | postreplication repair | 15/4634 | 31/18723 | 3.68e-03 | 2.02e-02 | 15 |
| GO:200102021 | Liver | HCC | regulation of response to DNA damage stimulus | 128/7958 | 219/18723 | 1.31e-06 | 1.90e-05 | 128 |
| GO:200102211 | Liver | HCC | positive regulation of response to DNA damage stimulus | 64/7958 | 105/18723 | 1.03e-04 | 8.88e-04 | 64 |
| GO:00063021 | Liver | HCC | double-strand break repair | 131/7958 | 251/18723 | 1.17e-03 | 6.54e-03 | 131 |
| GO:200102017 | Oral cavity | OSCC | regulation of response to DNA damage stimulus | 131/7305 | 219/18723 | 3.21e-10 | 8.72e-09 | 131 |
| Page: 1 2 3 |
| Pathway ID | Tissue | Disease Stage | Description | Gene Ratio | Bg Ratio | pvalue | p.adjust | qvalue | Count |
| Page: 1 |
Top |
Cell-cell communication analysis |
| Identification of potential cell-cell interactions between two cell types and their ligand-receptor pairs for different disease states |
| Ligand | Receptor | LRpair | Pathway | Tissue | Disease Stage |
| Page: 1 |
Top |
Single-cell gene regulatory network inference analysis |
| Find out the significant the regulons (TFs) and the target genes of each regulon across cell types for different disease states |
| TF | Cell Type | Tissue | Disease Stage | Target Gene | RSS | Regulon Activity |
| ∗The dot plots of a searched regulon are shown for all cell subpopulations in each disease state of each tissue based on the regulon specific score inferred using pySCENIC and by calculating the average expression. |
| Page: 1 |
Top |
Somatic mutation of malignant transformation related genes |
| Annotation of somatic variants for genes involved in malignant transformation |
| Hugo Symbol | Variant Class | Variant Classification | dbSNP RS | HGVSc | HGVSp | HGVSp Short | SWISSPROT | BIOTYPE | SIFT | PolyPhen | Tumor Sample Barcode | Tissue | Histology | Sex | Age | Stage | Therapy Types | Drugs | Outcome |
| NSMCE1 | SNV | Missense_Mutation | novel | c.497N>G | p.Phe166Cys | p.F166C | Q8WV22 | protein_coding | tolerated(0.07) | possibly_damaging(0.817) | TCGA-A2-A0D1-01 | Breast | breast invasive carcinoma | Female | >=65 | I/II | Chemotherapy | taxotere | SD |
| NSMCE1 | SNV | Missense_Mutation | c.208G>A | p.Glu70Lys | p.E70K | Q8WV22 | protein_coding | tolerated(0.1) | benign(0.365) | TCGA-AC-A23C-01 | Breast | breast invasive carcinoma | Female | <65 | I/II | Chemotherapy | chemo | CR | |
| NSMCE1 | insertion | Frame_Shift_Ins | novel | c.494_495insAGTAAAGGCTGAGCTAC | p.Phe166ValfsTer29 | p.F166Vfs*29 | Q8WV22 | protein_coding | TCGA-A2-A0D1-01 | Breast | breast invasive carcinoma | Female | >=65 | I/II | Chemotherapy | taxotere | SD | ||
| NSMCE1 | SNV | Missense_Mutation | novel | c.319G>A | p.Asp107Asn | p.D107N | Q8WV22 | protein_coding | deleterious(0) | possibly_damaging(0.847) | TCGA-2W-A8YY-01 | Cervix | cervical & endocervical cancer | Female | <65 | I/II | Chemotherapy | cisplatin | CR |
| NSMCE1 | SNV | Missense_Mutation | c.103C>T | p.Arg35Cys | p.R35C | Q8WV22 | protein_coding | deleterious(0.01) | probably_damaging(0.929) | TCGA-A6-A565-01 | Colorectum | colon adenocarcinoma | Female | <65 | III/IV | Unspecific | 5FU | PD | |
| NSMCE1 | SNV | Missense_Mutation | novel | c.747N>C | p.Arg249Ser | p.R249S | Q8WV22 | protein_coding | tolerated_low_confidence(0.52) | benign(0.018) | TCGA-AA-3821-01 | Colorectum | colon adenocarcinoma | Female | >=65 | I/II | Unknown | Unknown | SD |
| NSMCE1 | SNV | Missense_Mutation | novel | c.746N>T | p.Arg249Met | p.R249M | Q8WV22 | protein_coding | deleterious_low_confidence(0.03) | possibly_damaging(0.647) | TCGA-AA-3821-01 | Colorectum | colon adenocarcinoma | Female | >=65 | I/II | Unknown | Unknown | SD |
| NSMCE1 | SNV | Missense_Mutation | rs759281877 | c.79G>A | p.Val27Met | p.V27M | Q8WV22 | protein_coding | deleterious(0.01) | probably_damaging(0.977) | TCGA-AZ-6598-01 | Colorectum | colon adenocarcinoma | Female | >=65 | I/II | Unknown | Unknown | SD |
| NSMCE1 | SNV | Missense_Mutation | rs375705324 | c.767C>T | p.Ser256Leu | p.S256L | Q8WV22 | protein_coding | deleterious_low_confidence(0.02) | benign(0.003) | TCGA-CA-6717-01 | Colorectum | colon adenocarcinoma | Male | <65 | I/II | Chemotherapy | oxaliplatin | CR |
| NSMCE1 | SNV | Missense_Mutation | novel | c.731A>C | p.Asp244Ala | p.D244A | Q8WV22 | protein_coding | tolerated(0.41) | benign(0) | TCGA-CA-6718-01 | Colorectum | colon adenocarcinoma | Male | <65 | I/II | Unknown | Unknown | PD |
| Page: 1 2 3 4 |
Top |
Related drugs of malignant transformation related genes |
| Identification of chemicals and drugs interact with genes involved in malignant transfromation |
| (DGIdb 4.0) |
| Entrez ID | Symbol | Category | Interaction Types | Drug Claim Name | Drug Name | PMIDs |
| Page: 1 |

Copyright 2023-Present -The University of Texas Health Science Center at Houston |