Schematic overview of the cellular and molecular mechanisms involved in the cancer progression, including the proposed cellular and molecular mechanisms in cancer cells trajectory. AT1: alveolar type 1 cells; AT2: alveolar type 2 cells; AAH: atypical adenomatous hyperplasia; AIS: adenocarcinoma in situ; MIA: minimally invasive adenocarcinoma; IA: invasive adenocarcinoma; EMT: epithelial-mesenchymal transition

Home

Download

Statistics

Help

Contact

Center for Computational Systems Medicine
leaf

Gene summary

leaf

Malignant transformation analysis

leaf

Malignant transformation related pathway analysis

leaf

Cell-cell communication analysis

leaf

Single-cell gene regulatory network inference analysis

leaf

Somatic mutation of malignant transformation related genes

leaf

Related drugs of malignant transformation related genes

Gene: NSMAF

Gene summary for NSMAF

check button Gene summary.

Gene informationSpeciesHuman
Gene symbol

NSMAF

Gene ID

8439

Gene nameneutral sphingomyelinase activation associated factor
Gene AliasFAN
Cytomap8q12.1
Gene Typeprotein-coding
GO ID

GO:0006629

UniProtAcc

Q92636


Top

Malignant transformation analysis

check button Identification of the aberrant gene expression in precancerous and cancerous lesions by comparing the gene expression of stem-like cells in diseased tissues with normal stem cells
check button Malignant transformation involving gene list.
Entrez IDSymbolReplicatesSpeciesOrganTissueAdj P-valueLog2FCMalignancy
8439NSMAFLZE2DHumanEsophagusHGIN3.64e-033.34e-010.0642
8439NSMAFLZE4THumanEsophagusESCC6.19e-102.45e-010.0811
8439NSMAFLZE5THumanEsophagusESCC1.57e-022.07e-010.0514
8439NSMAFLZE8THumanEsophagusESCC2.72e-031.22e-010.067
8439NSMAFLZE20THumanEsophagusESCC1.74e-072.16e-010.0662
8439NSMAFLZE22D1HumanEsophagusHGIN3.26e-029.86e-020.0595
8439NSMAFLZE22THumanEsophagusESCC1.57e-021.48e-010.068
8439NSMAFLZE24THumanEsophagusESCC7.41e-132.60e-010.0596
8439NSMAFP2T-EHumanEsophagusESCC1.54e-163.65e-010.1177
8439NSMAFP4T-EHumanEsophagusESCC2.45e-122.16e-010.1323
8439NSMAFP5T-EHumanEsophagusESCC3.07e-041.14e-010.1327
8439NSMAFP8T-EHumanEsophagusESCC4.51e-162.90e-010.0889
8439NSMAFP9T-EHumanEsophagusESCC4.90e-173.46e-010.1131
8439NSMAFP10T-EHumanEsophagusESCC1.66e-194.02e-010.116
8439NSMAFP11T-EHumanEsophagusESCC1.23e-164.94e-010.1426
8439NSMAFP12T-EHumanEsophagusESCC3.84e-204.17e-010.1122
8439NSMAFP15T-EHumanEsophagusESCC6.21e-152.71e-010.1149
8439NSMAFP16T-EHumanEsophagusESCC2.24e-254.41e-010.1153
8439NSMAFP17T-EHumanEsophagusESCC4.48e-072.09e-010.1278
8439NSMAFP19T-EHumanEsophagusESCC4.64e-062.69e-010.1662
Page: 1 2 3 4 5 

check button Transcriptomic changes along malignancy continuum.
TissueExpression DynamicsAbbreviation
EsophagusThe image shows the transcriptomic changes along malignancy continuum.log2FC in expression of this searched gene in stem-like cells from each diseased tissue sample relative to stem-like cells in normal samples in each tissue plotted against the malignancy continuum. Samples are colored based on if they are from different disease stage.
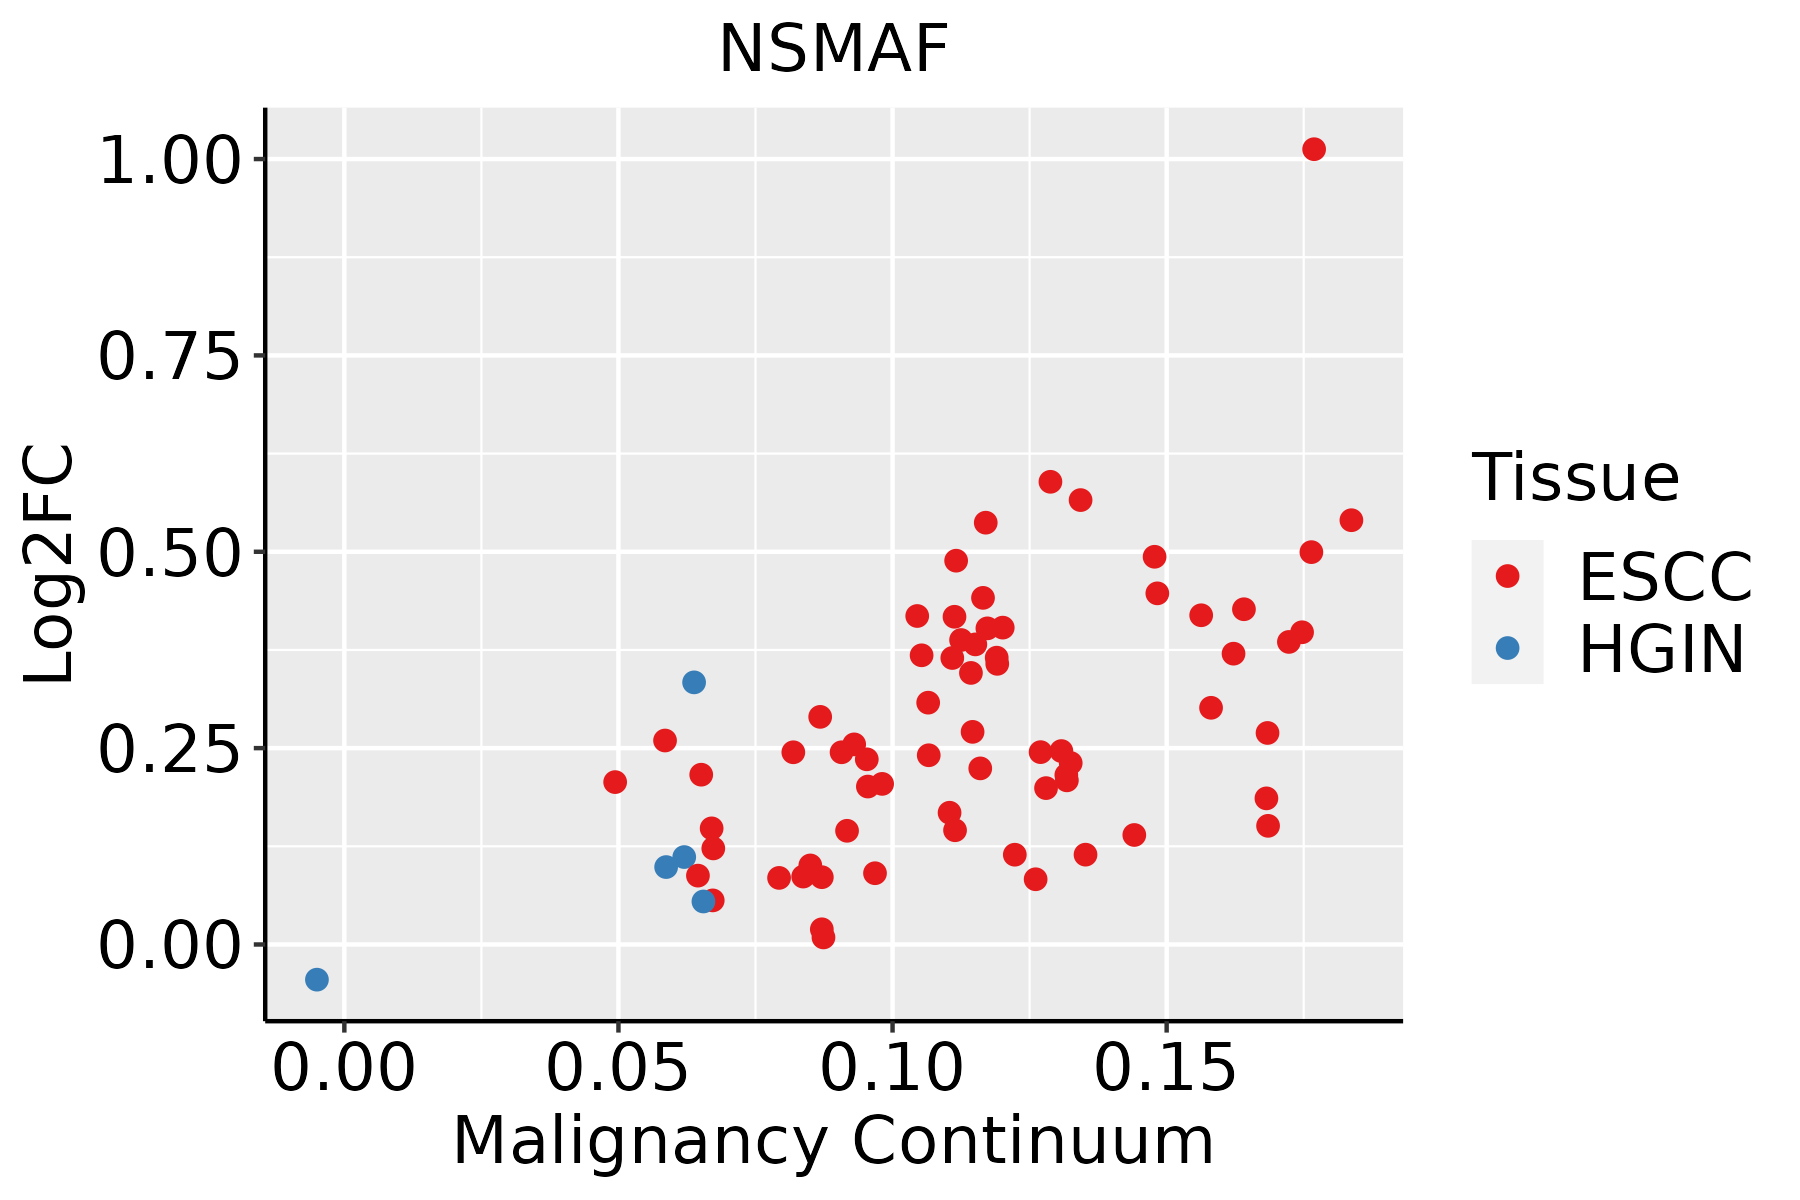
ESCC: Esophageal squamous cell carcinoma
HGIN: High-grade intraepithelial neoplasias
LGIN: Low-grade intraepithelial neoplasias
LiverThe image shows the transcriptomic changes along malignancy continuum.log2FC in expression of this searched gene in stem-like cells from each diseased tissue sample relative to stem-like cells in normal samples in each tissue plotted against the malignancy continuum. Samples are colored based on if they are from different disease stage.
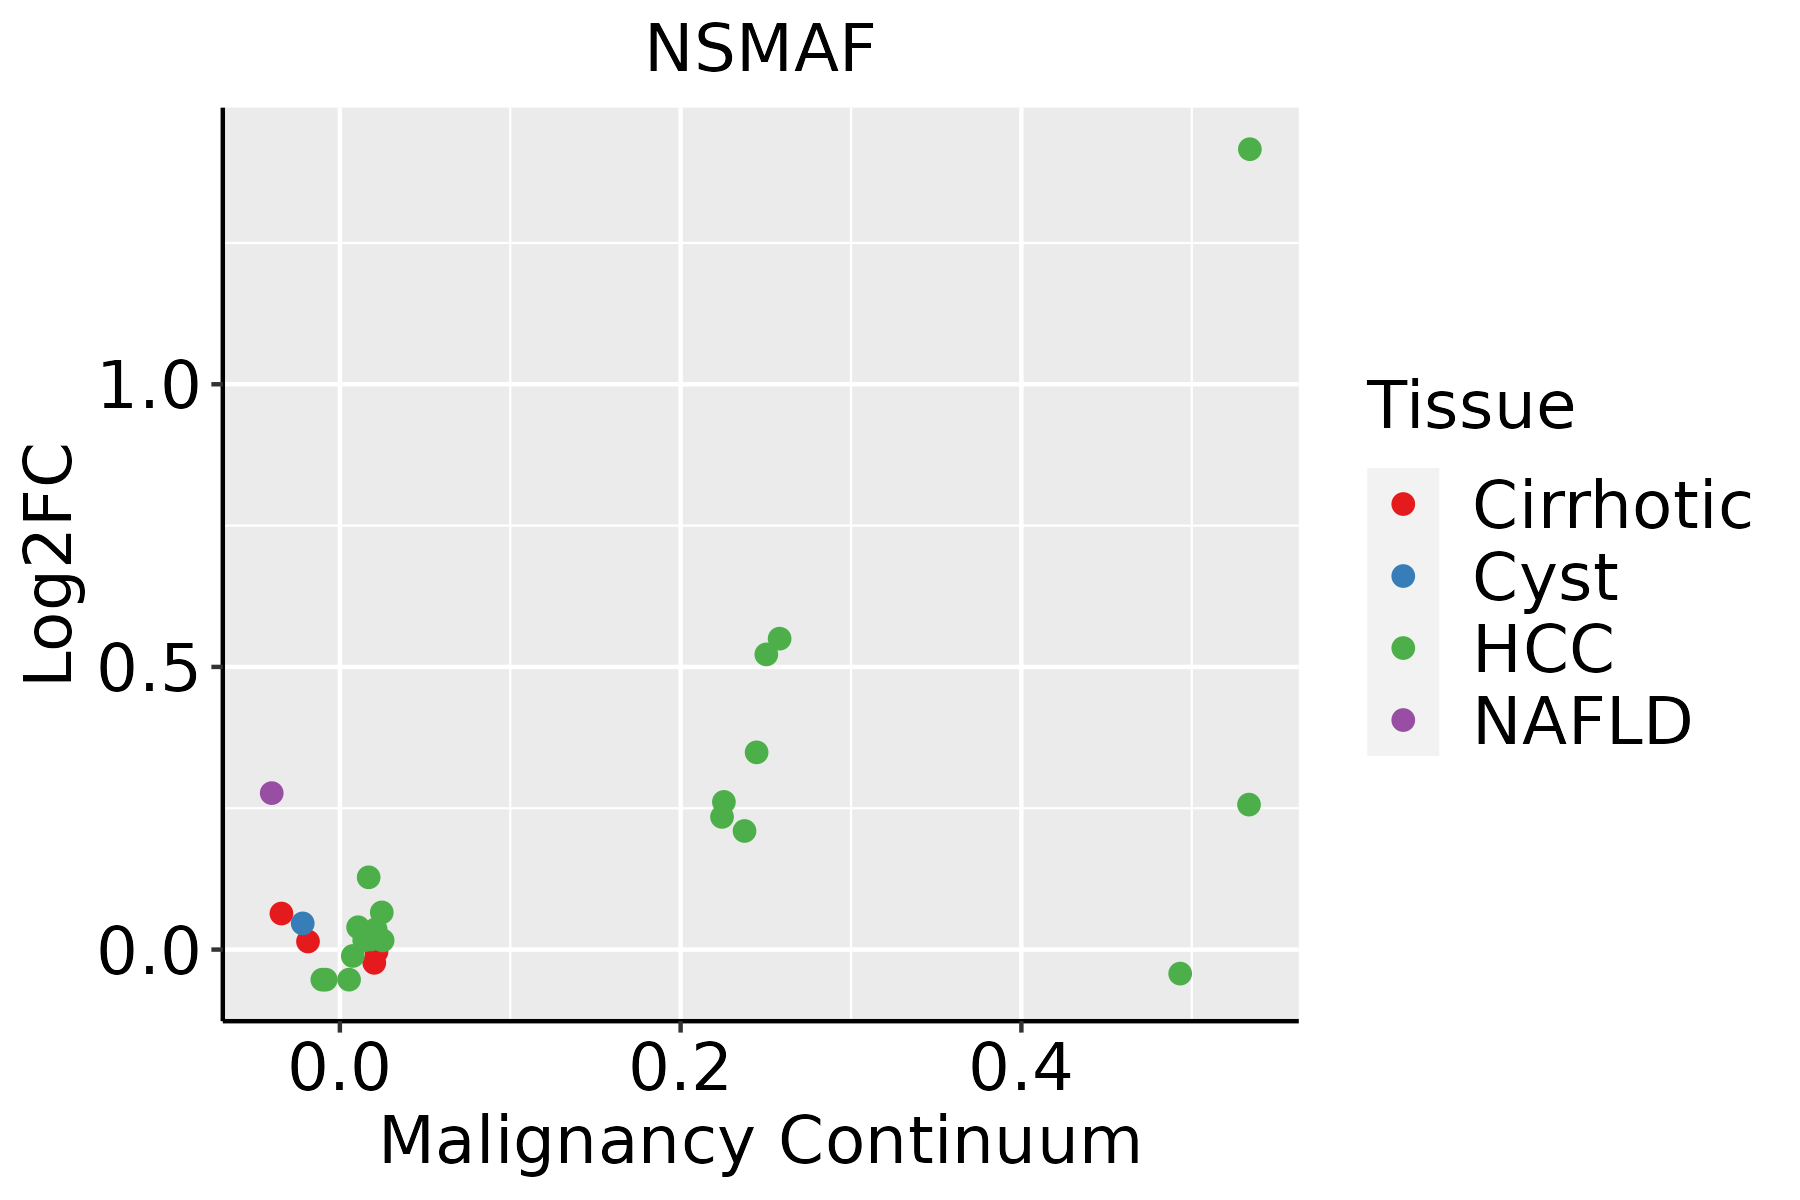
HCC: Hepatocellular carcinoma
NAFLD: Non-alcoholic fatty liver disease
Oral CavityThe image shows the transcriptomic changes along malignancy continuum.log2FC in expression of this searched gene in stem-like cells from each diseased tissue sample relative to stem-like cells in normal samples in each tissue plotted against the malignancy continuum. Samples are colored based on if they are from different disease stage.
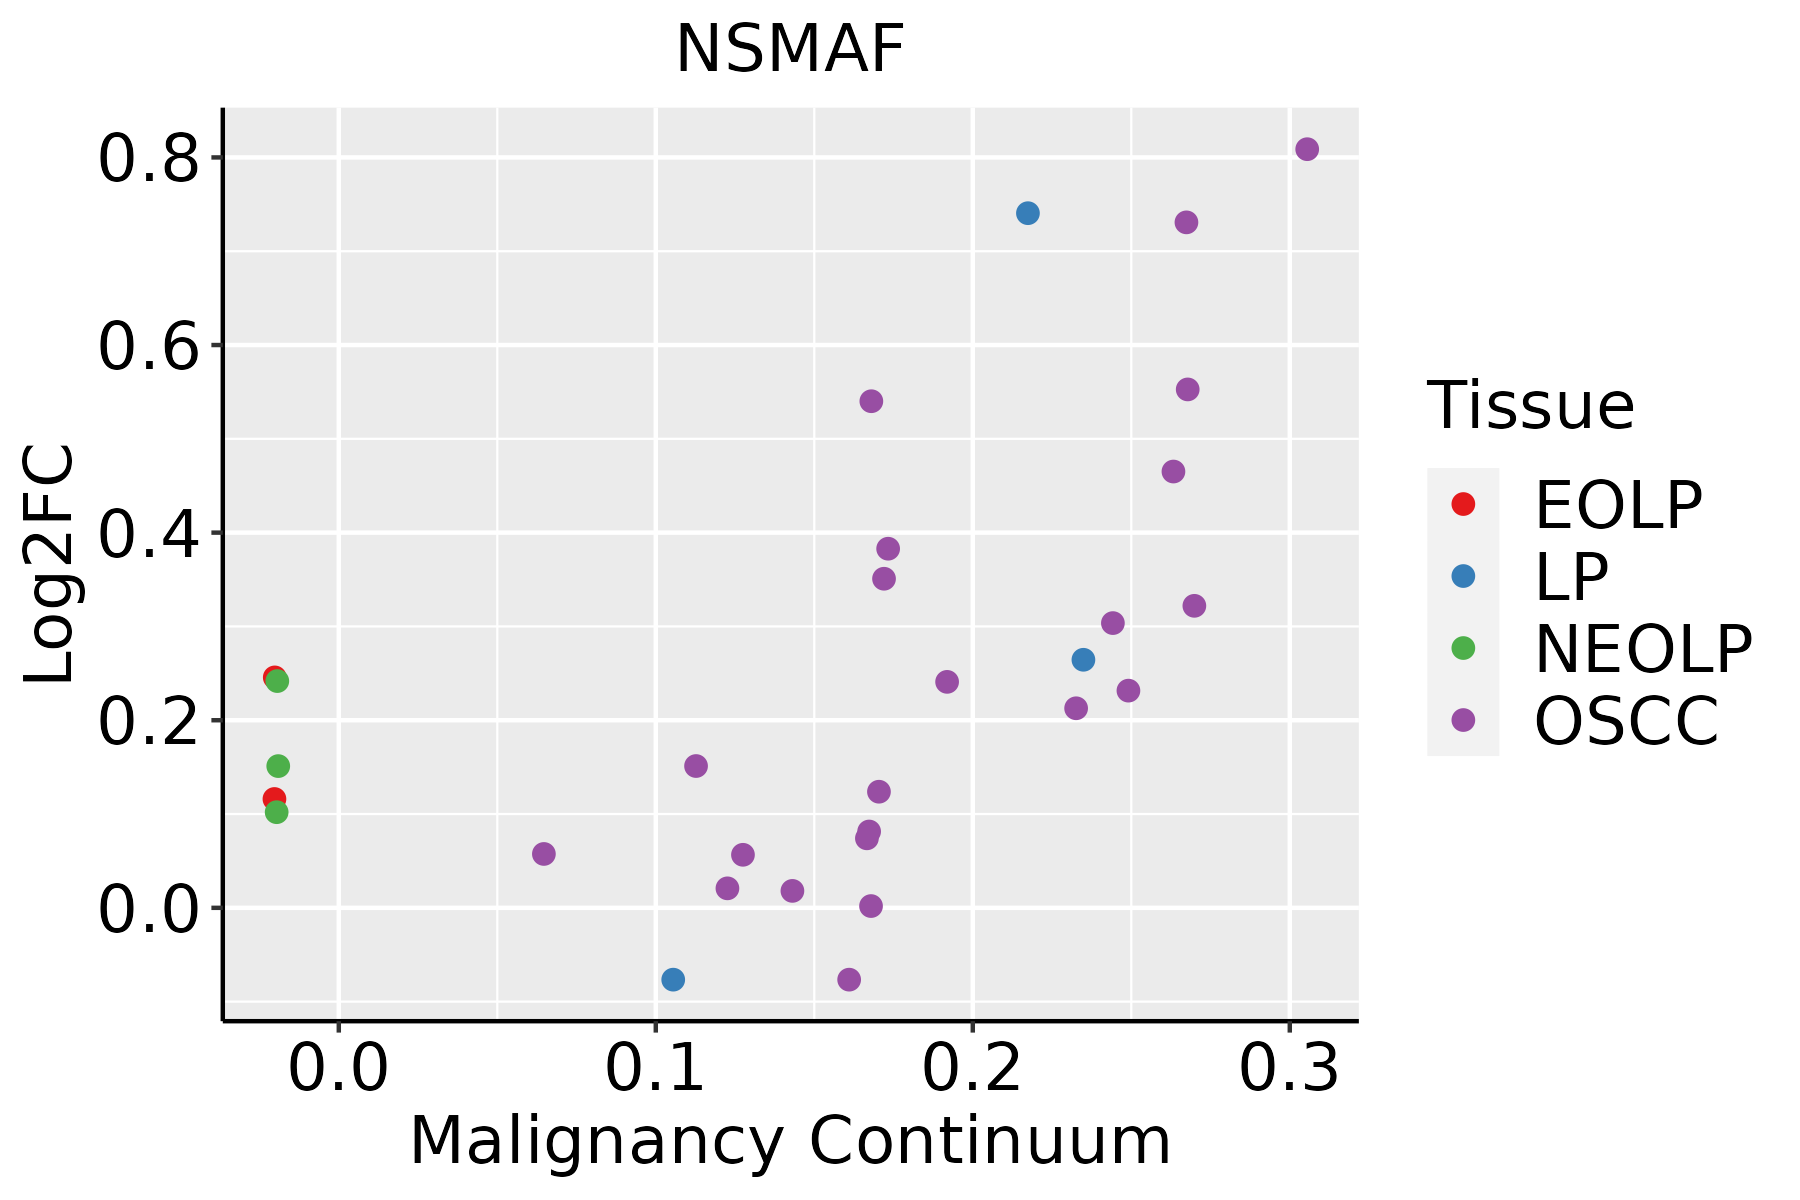
EOLP: Erosive Oral lichen planus
LP: leukoplakia
NEOLP: Non-erosive oral lichen planus
OSCC: Oral squamous cell carcinoma
ThyroidThe image shows the transcriptomic changes along malignancy continuum.log2FC in expression of this searched gene in stem-like cells from each diseased tissue sample relative to stem-like cells in normal samples in each tissue plotted against the malignancy continuum. Samples are colored based on if they are from different disease stage.
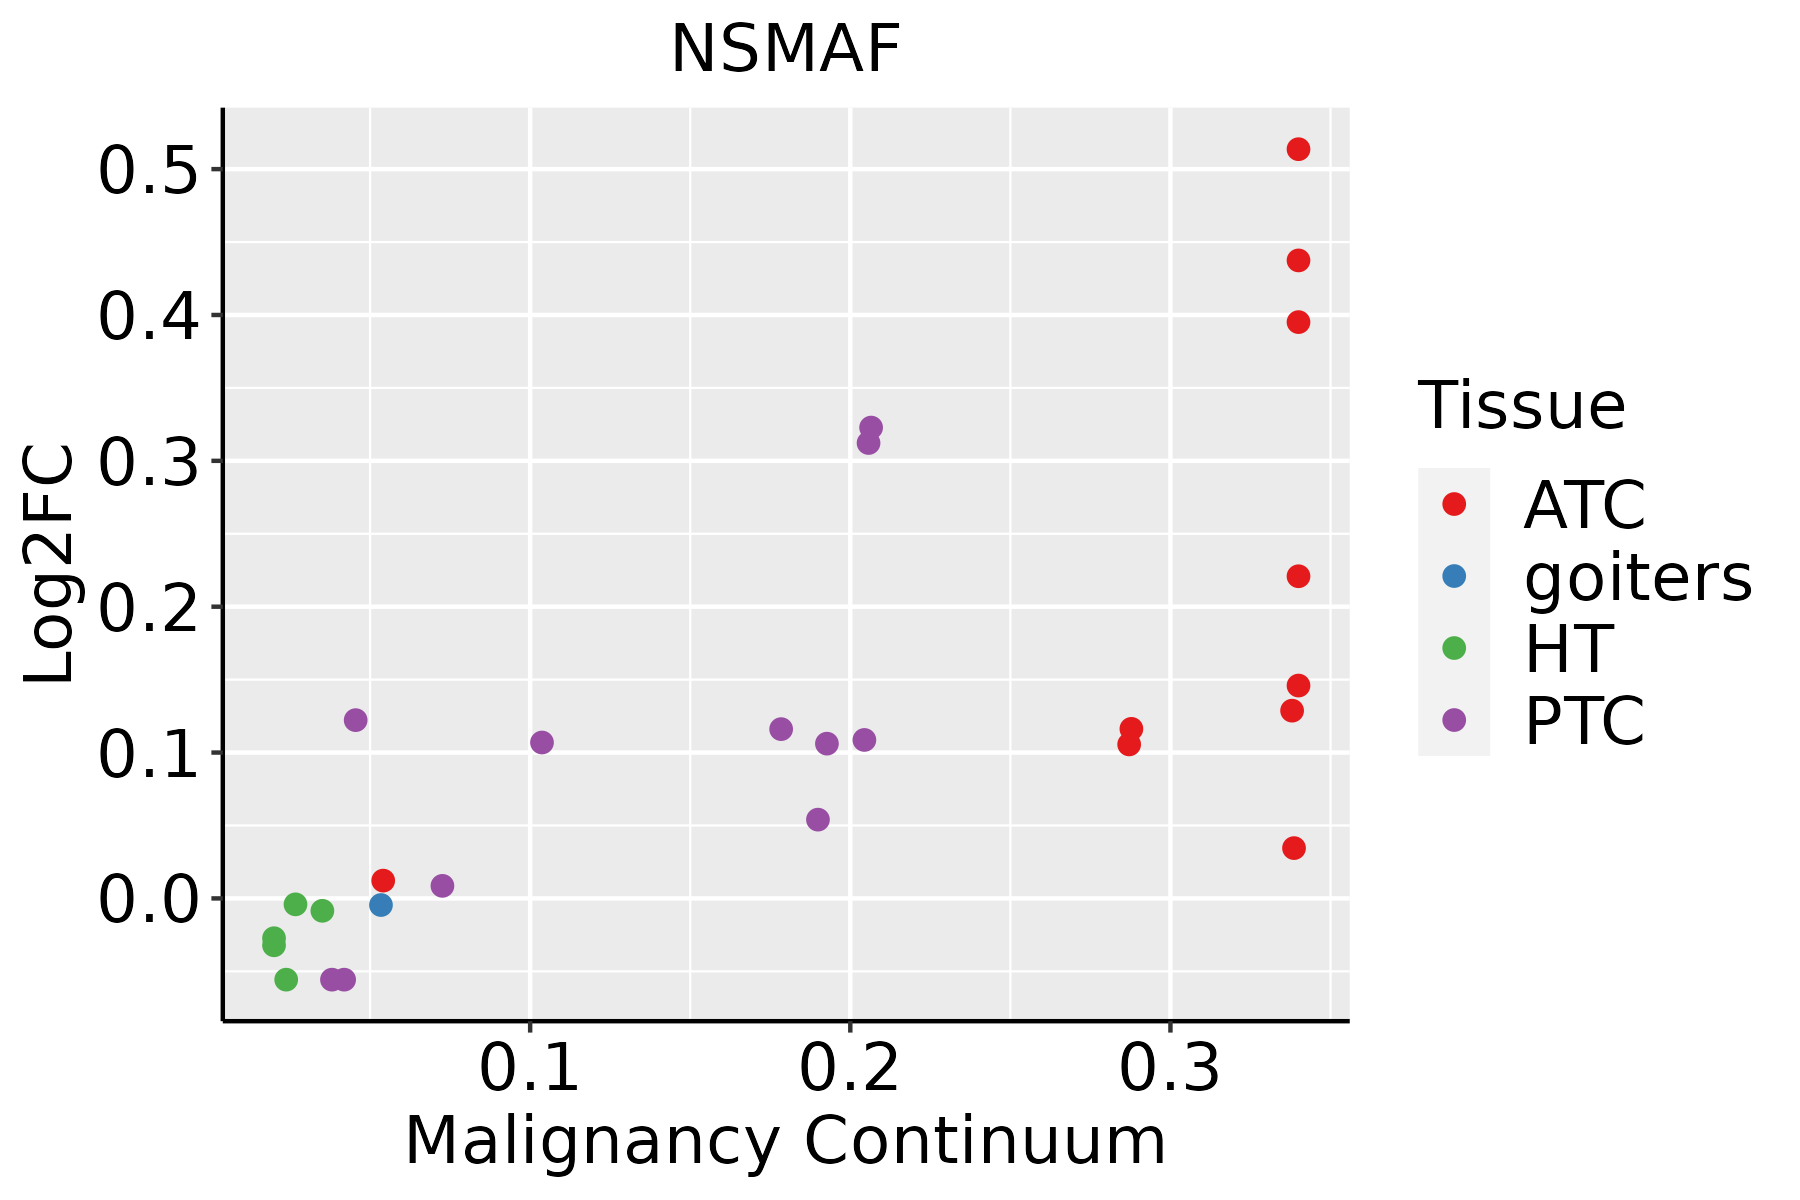
ATC: Anaplastic thyroid cancer
HT: Hashimoto's thyroiditis
PTC: Papillary thyroid cancer
∗log2FC in expression of this searched gene in stem-like cells from each diseased tissue sample relative to stem-like cells in normal samples in each tissue plotted against the malignancy continuum. Samples are colored based on if they are from different disease stage.

Top

Malignant transformation related pathway analysis

check buttonFind out the enriched GO biological processes and KEGG pathways involved in transition from healthy to precancer to cancer
check button Figure of enriched GO biological processes.
TissueDisease StageEnriched GO biological Processes
ColorectumADGO analysis - Figure of enriched GO biological processes: Top 15 enriched GO BP terms are showed in the bar plot of each disease state in each tissue. Each row represents a significant GO biological process which is colored according to the -log10(p.adjust).
ColorectumSERGO analysis - Figure of enriched GO biological processes: Top 15 enriched GO BP terms are showed in the bar plot of each disease state in each tissue. Each row represents a significant GO biological process which is colored according to the -log10(p.adjust).
ColorectumMSSGO analysis - Figure of enriched GO biological processes: Top 15 enriched GO BP terms are showed in the bar plot of each disease state in each tissue. Each row represents a significant GO biological process which is colored according to the -log10(p.adjust).
ColorectumMSI-HGO analysis - Figure of enriched GO biological processes: Top 15 enriched GO BP terms are showed in the bar plot of each disease state in each tissue. Each row represents a significant GO biological process which is colored according to the -log10(p.adjust).
ColorectumFAPGO analysis - Figure of enriched GO biological processes: Top 15 enriched GO BP terms are showed in the bar plot of each disease state in each tissue. Each row represents a significant GO biological process which is colored according to the -log10(p.adjust).
∗Top 15 enriched GO BP terms are showed in the bar plot of each disease state in each tissue. Each row represents a significant GO biological process which is colored according to the -log10(p.adjust).
Page: 1 2 3 4 5 6 7 8 9 

check button Enriched GO biological processes.
GO IDTissueDisease StageDescriptionGene RatioBg Ratiopvaluep.adjustCount
GO:00066433EsophagusESCCmembrane lipid metabolic process130/8552203/187239.29e-081.54e-06130
GO:00066652EsophagusESCCsphingolipid metabolic process96/8552155/187233.21e-052.66e-0496
GO:00066721EsophagusESCCceramide metabolic process61/8552102/187232.82e-031.19e-0261
GO:00066431LiverHCCmembrane lipid metabolic process115/7958203/187233.17e-053.22e-04115
GO:0006665LiverHCCsphingolipid metabolic process85/7958155/187231.27e-036.92e-0385
GO:00066432Oral cavityOSCCmembrane lipid metabolic process111/7305203/187234.02e-064.69e-05111
GO:00066651Oral cavityOSCCsphingolipid metabolic process84/7305155/187238.64e-056.61e-0484
GO:0006672Oral cavityOSCCceramide metabolic process53/7305102/187235.28e-032.06e-0253
GO:000664311Oral cavityLPmembrane lipid metabolic process69/4623203/187231.77e-031.34e-0269
Page: 1 

check button Enriched KEGG pathways.
Pathway IDTissueDisease StageDescriptionGene RatioBg Ratiopvaluep.adjustqvalueCount
hsa0407116EsophagusESCCSphingolipid signaling pathway85/4205121/84653.04e-061.73e-058.84e-0685
hsa0407117EsophagusESCCSphingolipid signaling pathway85/4205121/84653.04e-061.73e-058.84e-0685
hsa040718LiverHCCSphingolipid signaling pathway72/4020121/84655.01e-031.47e-028.18e-0372
hsa0407111LiverHCCSphingolipid signaling pathway72/4020121/84655.01e-031.47e-028.18e-0372
hsa0407114Oral cavityOSCCSphingolipid signaling pathway82/3704121/84656.97e-085.08e-072.58e-0782
hsa0407115Oral cavityOSCCSphingolipid signaling pathway82/3704121/84656.97e-085.08e-072.58e-0782
hsa0407122Oral cavityLPSphingolipid signaling pathway48/2418121/84655.30e-032.15e-021.39e-0248
hsa0407132Oral cavityLPSphingolipid signaling pathway48/2418121/84655.30e-032.15e-021.39e-0248
hsa0407141Oral cavityEOLPSphingolipid signaling pathway44/1218121/84651.19e-093.51e-082.07e-0844
hsa0407151Oral cavityEOLPSphingolipid signaling pathway44/1218121/84651.19e-093.51e-082.07e-0844
Page: 1 

Top

Cell-cell communication analysis

check buttonIdentification of potential cell-cell interactions between two cell types and their ligand-receptor pairs for different disease states
LigandReceptorLRpairPathwayTissueDisease Stage
Page: 1 

Top

Single-cell gene regulatory network inference analysis

check buttonFind out the significant the regulons (TFs) and the target genes of each regulon across cell types for different disease states
TFCell TypeTissueDisease StageTarget GeneRSSRegulon Activity
∗The dot plots of a searched regulon are shown for all cell subpopulations in each disease state of each tissue based on the regulon specific score inferred using pySCENIC and by calculating the average expression.
Page: 1 

Top

Somatic mutation of malignant transformation related genes

check buttonAnnotation of somatic variants for genes involved in malignant transformation
Hugo SymbolVariant ClassVariant ClassificationdbSNP RSHGVScHGVSpHGVSp ShortSWISSPROTBIOTYPESIFTPolyPhenTumor Sample BarcodeTissueHistologySexAgeStageTherapy TypesDrugsOutcome
NSMAFSNVMissense_Mutationc.2162C>Ap.Ser721Tyrp.S721YQ92636protein_codingdeleterious(0.01)probably_damaging(0.998)TCGA-A8-A076-01Breastbreast invasive carcinomaFemale>=65I/IIHormone TherapyanastrozoleSD
NSMAFSNVMissense_Mutationnovelc.2130N>Tp.Leu710Phep.L710FQ92636protein_codingtolerated(0.07)benign(0.017)TCGA-B6-A1KF-01Breastbreast invasive carcinomaFemale>=65I/IIUnknownUnknownSD
NSMAFSNVMissense_Mutationc.2326N>Cp.Glu776Glnp.E776QQ92636protein_codingtolerated(0.29)benign(0.309)TCGA-BH-A0B6-01Breastbreast invasive carcinomaFemale<65I/IIUnknownUnknownSD
NSMAFSNVMissense_Mutationnovelc.1402N>Ap.Asp468Asnp.D468NQ92636protein_codingtolerated(0.42)possibly_damaging(0.757)TCGA-BH-A0B6-01Breastbreast invasive carcinomaFemale<65I/IIUnknownUnknownSD
NSMAFSNVMissense_Mutationnovelc.2690N>Cp.Gly897Alap.G897AQ92636protein_codingdeleterious(0)probably_damaging(0.999)TCGA-UU-A93S-01Breastbreast invasive carcinomaFemale<65III/IVUnknownUnknownPD
NSMAFinsertionIn_Frame_Insnovelc.1411_1412insACAGATACCTGTTTTTGCTGATGTTGTTTGTTTTCAGCTATAGACp.Thr471delinsAsnArgTyrLeuPheLeuLeuMetLeuPheValPheSerTyrArgProp.T471delinsNRYLFLLMLFVFSYRPQ92636protein_codingTCGA-AR-A0TY-01Breastbreast invasive carcinomaFemale<65I/IIUnspecificPaclitaxelPD
NSMAFinsertionFrame_Shift_Insnovelc.1822_1823insGAp.Thr608ArgfsTer30p.T608Rfs*30Q92636protein_codingTCGA-B6-A0I9-01Breastbreast invasive carcinomaFemale<65III/IVUnknownUnknownPD
NSMAFinsertionFrame_Shift_Insnovelc.1820_1821insGGGATTAAACTGTTTTAAGCTGAGTp.Ile607MetfsTer14p.I607Mfs*14Q92636protein_codingTCGA-B6-A0I9-01Breastbreast invasive carcinomaFemale<65III/IVUnknownUnknownPD
NSMAFinsertionFrame_Shift_Insnovelc.1289_1290insCGGCCTCCCAAAGTGCTGGGATTACAGGp.Phe431GlyfsTer14p.F431Gfs*14Q92636protein_codingTCGA-BH-A0EE-01Breastbreast invasive carcinomaFemale>=65I/IIChemotherapydocetaxelSD
NSMAFSNVMissense_Mutationc.377G>Cp.Arg126Thrp.R126TQ92636protein_codingtolerated(0.47)benign(0)TCGA-EK-A2R8-01Cervixcervical & endocervical cancerFemale<65I/IIUnknownUnknownSD
Page: 1 2 3 4 5 6 7 8 9 10 

Top

Related drugs of malignant transformation related genes

check buttonIdentification of chemicals and drugs interact with genes involved in malignant transfromation
(DGIdb 4.0)
Entrez IDSymbolCategoryInteraction TypesDrug Claim NameDrug NamePMIDs
Page: 1