
|
|||||
|
 | |
| |
| |
| |
| |
| |
|
Gene: NSG1 |
Gene summary for NSG1 |
| Gene information | Species | Human | Gene symbol | NSG1 | Gene ID | 27065 |
| Gene name | neuronal vesicle trafficking associated 1 | |
| Gene Alias | D4S234 | |
| Cytomap | 4p16.3 | |
| Gene Type | protein-coding | GO ID | GO:0001881 | UniProtAcc | B2R5R8 |
Top |
Malignant transformation analysis |
| Identification of the aberrant gene expression in precancerous and cancerous lesions by comparing the gene expression of stem-like cells in diseased tissues with normal stem cells |
| Entrez ID | Symbol | Replicates | Species | Organ | Tissue | Adj P-value | Log2FC | Malignancy |
| 27065 | NSG1 | LZE7T | Human | Esophagus | ESCC | 4.20e-03 | 5.02e-01 | 0.0667 |
| 27065 | NSG1 | LZE8T | Human | Esophagus | ESCC | 2.59e-06 | -5.27e-02 | 0.067 |
| 27065 | NSG1 | LZE24T | Human | Esophagus | ESCC | 4.76e-08 | 5.96e-01 | 0.0596 |
| 27065 | NSG1 | P2T-E | Human | Esophagus | ESCC | 7.08e-13 | 4.53e-01 | 0.1177 |
| 27065 | NSG1 | P4T-E | Human | Esophagus | ESCC | 8.65e-28 | 9.29e-01 | 0.1323 |
| 27065 | NSG1 | P5T-E | Human | Esophagus | ESCC | 2.19e-06 | -1.20e-01 | 0.1327 |
| 27065 | NSG1 | P9T-E | Human | Esophagus | ESCC | 4.24e-03 | -1.31e-01 | 0.1131 |
| 27065 | NSG1 | P10T-E | Human | Esophagus | ESCC | 5.26e-14 | 3.59e-01 | 0.116 |
| 27065 | NSG1 | P12T-E | Human | Esophagus | ESCC | 1.98e-06 | 4.62e-01 | 0.1122 |
| 27065 | NSG1 | P16T-E | Human | Esophagus | ESCC | 3.04e-12 | 1.70e-01 | 0.1153 |
| 27065 | NSG1 | P20T-E | Human | Esophagus | ESCC | 2.00e-13 | 2.61e-01 | 0.1124 |
| 27065 | NSG1 | P22T-E | Human | Esophagus | ESCC | 1.05e-11 | 2.34e-01 | 0.1236 |
| 27065 | NSG1 | P26T-E | Human | Esophagus | ESCC | 1.39e-12 | 2.55e-01 | 0.1276 |
| 27065 | NSG1 | P27T-E | Human | Esophagus | ESCC | 2.57e-22 | 5.80e-01 | 0.1055 |
| 27065 | NSG1 | P30T-E | Human | Esophagus | ESCC | 1.36e-10 | 3.30e-01 | 0.137 |
| 27065 | NSG1 | P31T-E | Human | Esophagus | ESCC | 3.10e-29 | 6.49e-01 | 0.1251 |
| 27065 | NSG1 | P32T-E | Human | Esophagus | ESCC | 2.05e-18 | 6.18e-01 | 0.1666 |
| 27065 | NSG1 | P37T-E | Human | Esophagus | ESCC | 3.76e-07 | 7.80e-02 | 0.1371 |
| 27065 | NSG1 | P39T-E | Human | Esophagus | ESCC | 1.37e-05 | 1.19e-01 | 0.0894 |
| 27065 | NSG1 | P42T-E | Human | Esophagus | ESCC | 1.45e-04 | 2.60e-01 | 0.1175 |
| Page: 1 2 3 |
| Tissue | Expression Dynamics | Abbreviation |
| Esophagus | 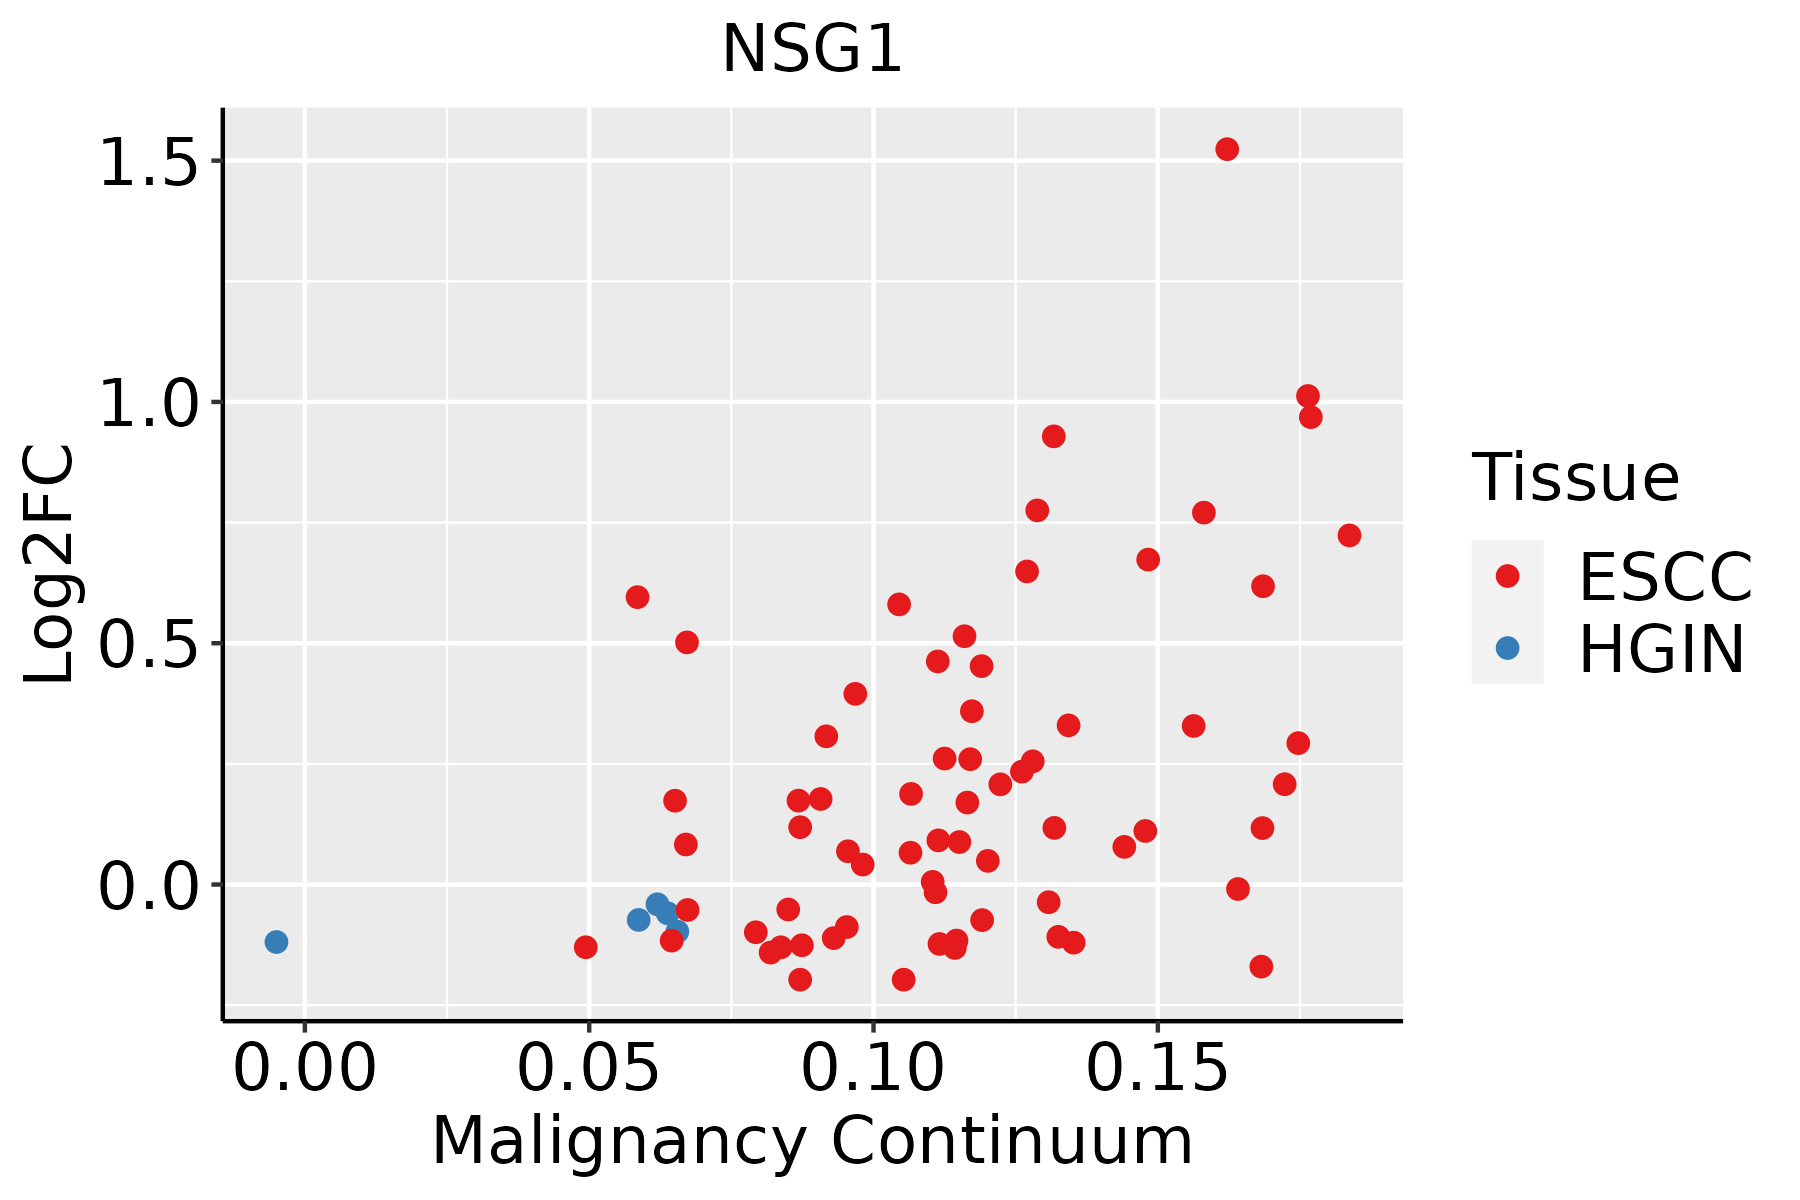 | ESCC: Esophageal squamous cell carcinoma |
| HGIN: High-grade intraepithelial neoplasias | ||
| LGIN: Low-grade intraepithelial neoplasias | ||
| Oral Cavity |  | EOLP: Erosive Oral lichen planus |
| LP: leukoplakia | ||
| NEOLP: Non-erosive oral lichen planus | ||
| OSCC: Oral squamous cell carcinoma | ||
| Skin | 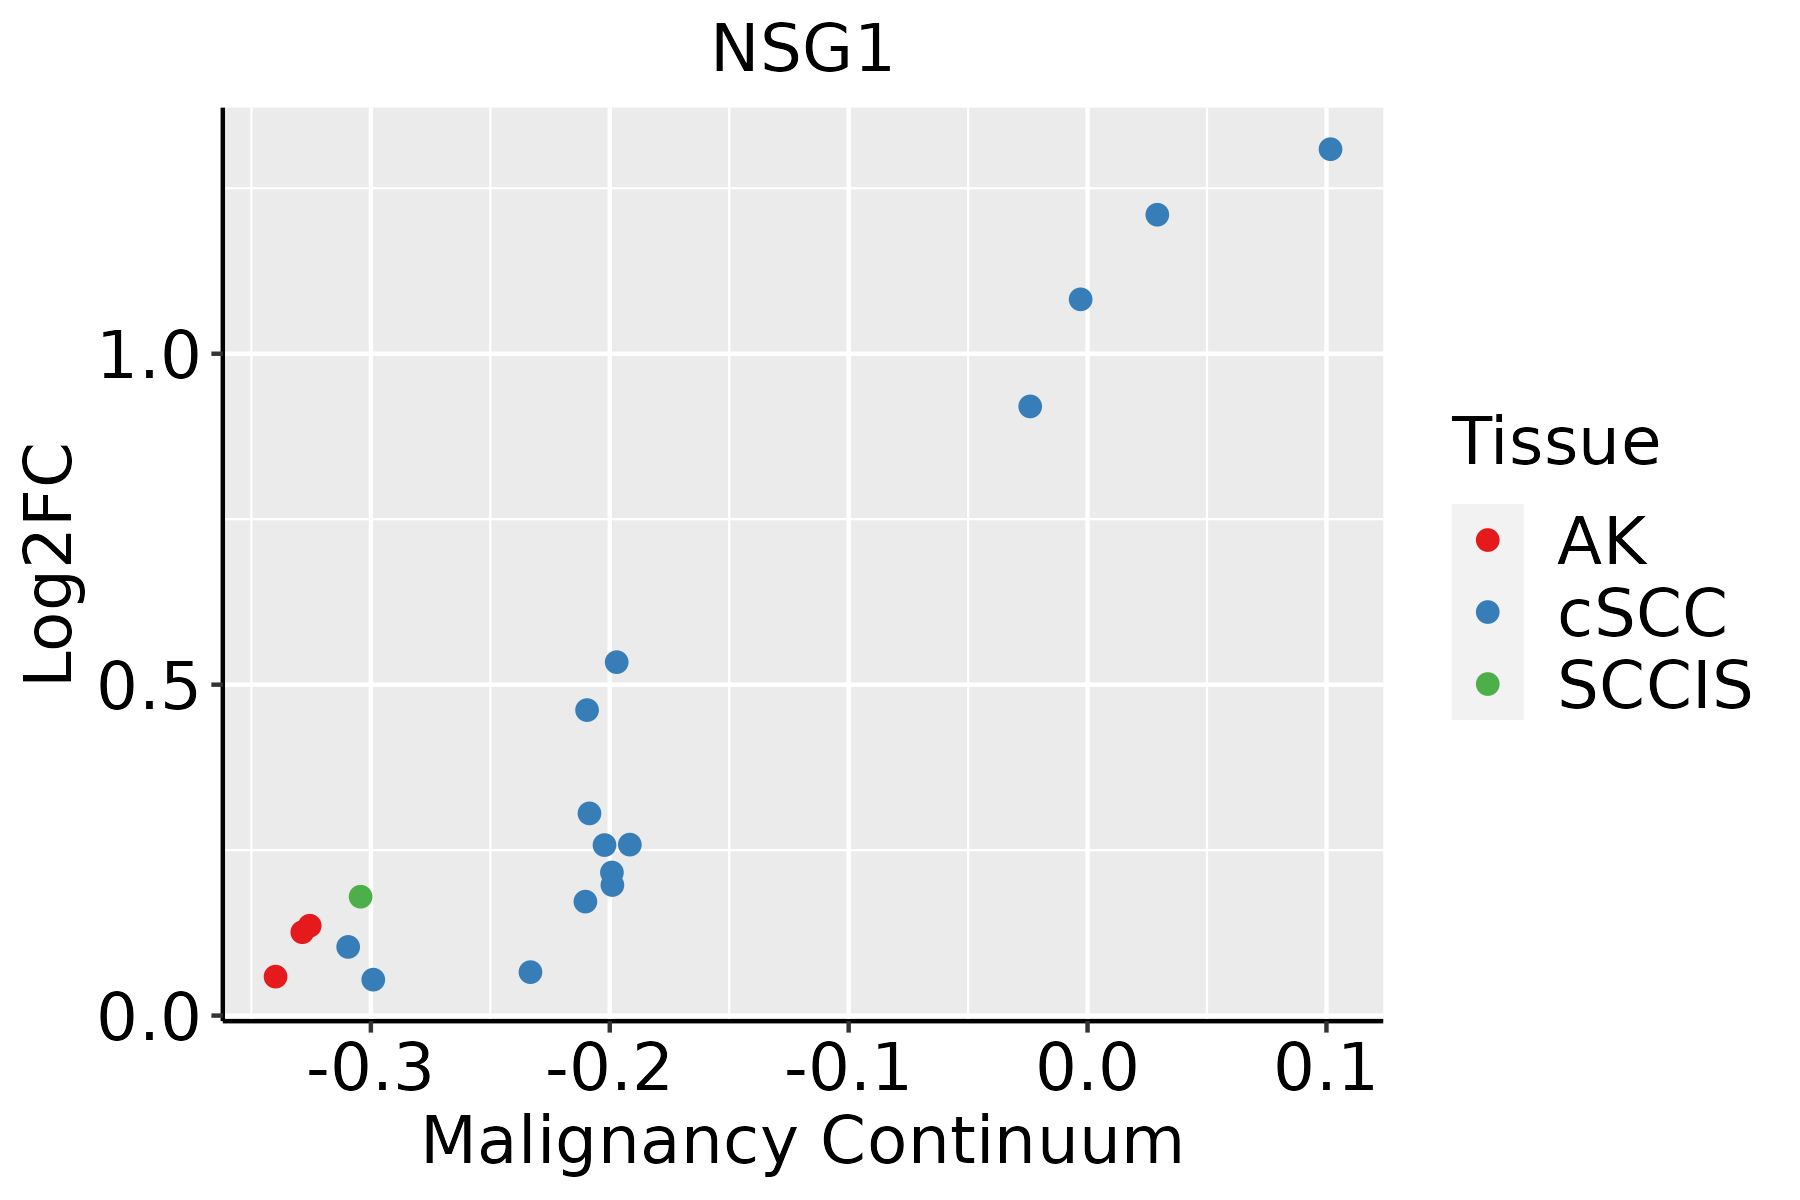 | AK: Actinic keratosis |
| cSCC: Cutaneous squamous cell carcinoma | ||
| SCCIS:squamous cell carcinoma in situ |
| ∗log2FC in expression of this searched gene in stem-like cells from each diseased tissue sample relative to stem-like cells in normal samples in each tissue plotted against the malignancy continuum. Samples are colored based on if they are from different disease stage. |
Top |
Malignant transformation related pathway analysis |
| Find out the enriched GO biological processes and KEGG pathways involved in transition from healthy to precancer to cancer |
| Tissue | Disease Stage | Enriched GO biological Processes |
| Colorectum | AD |  |
| Colorectum | SER |  |
| Colorectum | MSS |  |
| Colorectum | MSI-H |  |
| Colorectum | FAP |  |
| ∗Top 15 enriched GO BP terms are showed in the bar plot of each disease state in each tissue. Each row represents a significant GO biological process which is colored according to the -log10(p.adjust). |
| Page: 1 2 3 4 5 6 7 8 9 |
| GO ID | Tissue | Disease Stage | Description | Gene Ratio | Bg Ratio | pvalue | p.adjust | Count |
| GO:001619715 | Esophagus | ESCC | endosomal transport | 168/8552 | 230/18723 | 2.28e-17 | 1.93e-15 | 168 |
| GO:0090150110 | Esophagus | ESCC | establishment of protein localization to membrane | 182/8552 | 260/18723 | 1.27e-15 | 8.19e-14 | 182 |
| GO:0072659110 | Esophagus | ESCC | protein localization to plasma membrane | 193/8552 | 284/18723 | 1.95e-14 | 1.03e-12 | 193 |
| GO:199077819 | Esophagus | ESCC | protein localization to cell periphery | 217/8552 | 333/18723 | 4.08e-13 | 1.88e-11 | 217 |
| GO:009887615 | Esophagus | ESCC | vesicle-mediated transport to the plasma membrane | 99/8552 | 136/18723 | 1.13e-10 | 3.39e-09 | 99 |
| GO:003150314 | Esophagus | ESCC | protein-containing complex localization | 139/8552 | 220/18723 | 1.14e-07 | 1.85e-06 | 139 |
| GO:004311218 | Esophagus | ESCC | receptor metabolic process | 104/8552 | 166/18723 | 7.44e-06 | 7.37e-05 | 104 |
| GO:006195114 | Esophagus | ESCC | establishment of protein localization to plasma membrane | 44/8552 | 60/18723 | 1.25e-05 | 1.15e-04 | 44 |
| GO:00324565 | Esophagus | ESCC | endocytic recycling | 51/8552 | 73/18723 | 2.47e-05 | 2.10e-04 | 51 |
| GO:00019192 | Esophagus | ESCC | regulation of receptor recycling | 19/8552 | 23/18723 | 3.12e-04 | 1.85e-03 | 19 |
| GO:00018813 | Esophagus | ESCC | receptor recycling | 25/8552 | 33/18723 | 4.30e-04 | 2.43e-03 | 25 |
| GO:00019211 | Esophagus | ESCC | positive regulation of receptor recycling | 12/8552 | 14/18723 | 2.51e-03 | 1.08e-02 | 12 |
| GO:009015018 | Oral cavity | OSCC | establishment of protein localization to membrane | 163/7305 | 260/18723 | 7.13e-15 | 4.47e-13 | 163 |
| GO:007265918 | Oral cavity | OSCC | protein localization to plasma membrane | 169/7305 | 284/18723 | 1.69e-12 | 7.21e-11 | 169 |
| GO:00161979 | Oral cavity | OSCC | endosomal transport | 141/7305 | 230/18723 | 5.40e-12 | 2.06e-10 | 141 |
| GO:199077816 | Oral cavity | OSCC | protein localization to cell periphery | 190/7305 | 333/18723 | 1.46e-11 | 5.13e-10 | 190 |
| GO:00315034 | Oral cavity | OSCC | protein-containing complex localization | 123/7305 | 220/18723 | 2.54e-07 | 4.00e-06 | 123 |
| GO:00988769 | Oral cavity | OSCC | vesicle-mediated transport to the plasma membrane | 79/7305 | 136/18723 | 4.93e-06 | 5.58e-05 | 79 |
| GO:00619518 | Oral cavity | OSCC | establishment of protein localization to plasma membrane | 39/7305 | 60/18723 | 4.07e-05 | 3.53e-04 | 39 |
| GO:004311210 | Oral cavity | OSCC | receptor metabolic process | 88/7305 | 166/18723 | 1.68e-04 | 1.15e-03 | 88 |
| Page: 1 2 |
| Pathway ID | Tissue | Disease Stage | Description | Gene Ratio | Bg Ratio | pvalue | p.adjust | qvalue | Count |
| Page: 1 |
Top |
Cell-cell communication analysis |
| Identification of potential cell-cell interactions between two cell types and their ligand-receptor pairs for different disease states |
| Ligand | Receptor | LRpair | Pathway | Tissue | Disease Stage |
| Page: 1 |
Top |
Single-cell gene regulatory network inference analysis |
| Find out the significant the regulons (TFs) and the target genes of each regulon across cell types for different disease states |
| TF | Cell Type | Tissue | Disease Stage | Target Gene | RSS | Regulon Activity |
| ∗The dot plots of a searched regulon are shown for all cell subpopulations in each disease state of each tissue based on the regulon specific score inferred using pySCENIC and by calculating the average expression. |
| Page: 1 |
Top |
Somatic mutation of malignant transformation related genes |
| Annotation of somatic variants for genes involved in malignant transformation |
| Hugo Symbol | Variant Class | Variant Classification | dbSNP RS | HGVSc | HGVSp | HGVSp Short | SWISSPROT | BIOTYPE | SIFT | PolyPhen | Tumor Sample Barcode | Tissue | Histology | Sex | Age | Stage | Therapy Types | Drugs | Outcome |
| NSG1 | SNV | Missense_Mutation | c.251C>G | p.Ser84Cys | p.S84C | P42857 | protein_coding | deleterious(0.02) | possibly_damaging(0.663) | TCGA-Q1-A73O-01 | Cervix | cervical & endocervical cancer | Female | <65 | I/II | Chemotherapy | cisplatin | CR | |
| NSG1 | SNV | Missense_Mutation | rs368098188 | c.349N>A | p.Val117Ile | p.V117I | P42857 | protein_coding | tolerated(0.25) | benign(0.228) | TCGA-AA-3984-01 | Colorectum | colon adenocarcinoma | Female | <65 | I/II | Unknown | Unknown | SD |
| NSG1 | SNV | Missense_Mutation | novel | c.128N>C | p.Lys43Thr | p.K43T | P42857 | protein_coding | deleterious(0.01) | probably_damaging(0.993) | TCGA-CA-6717-01 | Colorectum | colon adenocarcinoma | Male | <65 | I/II | Chemotherapy | oxaliplatin | CR |
| NSG1 | SNV | Missense_Mutation | rs766912597 | c.167N>A | p.Arg56His | p.R56H | P42857 | protein_coding | tolerated(0.07) | benign(0.007) | TCGA-CM-4743-01 | Colorectum | colon adenocarcinoma | Male | >=65 | I/II | Chemotherapy | capecitabine | SD |
| NSG1 | insertion | Frame_Shift_Ins | novel | c.381_385dupCTTGG | p.Glu129AlafsTer21 | p.E129Afs*21 | P42857 | protein_coding | TCGA-G5-6641-01 | Colorectum | rectum adenocarcinoma | Male | >=65 | III/IV | Chemotherapy | oxaliplatin | SD | ||
| NSG1 | SNV | Missense_Mutation | novel | c.254T>C | p.Val85Ala | p.V85A | P42857 | protein_coding | tolerated(0.06) | possibly_damaging(0.634) | TCGA-A5-A0G2-01 | Endometrium | uterine corpus endometrioid carcinoma | Female | <65 | III/IV | Unknown | Unknown | SD |
| NSG1 | SNV | Missense_Mutation | c.387G>T | p.Glu129Asp | p.E129D | P42857 | protein_coding | tolerated(0.21) | benign(0.007) | TCGA-A5-A0G2-01 | Endometrium | uterine corpus endometrioid carcinoma | Female | <65 | III/IV | Unknown | Unknown | SD | |
| NSG1 | SNV | Missense_Mutation | rs199877139 | c.268N>A | p.Ala90Thr | p.A90T | P42857 | protein_coding | tolerated(0.48) | probably_damaging(0.994) | TCGA-A5-A1OF-01 | Endometrium | uterine corpus endometrioid carcinoma | Female | <65 | I/II | Unknown | Unknown | SD |
| NSG1 | SNV | Missense_Mutation | novel | c.67N>A | p.Asp23Asn | p.D23N | P42857 | protein_coding | tolerated(0.05) | possibly_damaging(0.811) | TCGA-A5-A2K5-01 | Endometrium | uterine corpus endometrioid carcinoma | Female | >=65 | I/II | Unknown | Unknown | SD |
| NSG1 | SNV | Missense_Mutation | novel | c.253G>A | p.Val85Met | p.V85M | P42857 | protein_coding | tolerated(0.12) | possibly_damaging(0.866) | TCGA-AJ-A3OL-01 | Endometrium | uterine corpus endometrioid carcinoma | Female | <65 | III/IV | Chemotherapy | carboplatin | PD |
| Page: 1 2 3 4 |
Top |
Related drugs of malignant transformation related genes |
| Identification of chemicals and drugs interact with genes involved in malignant transfromation |
| (DGIdb 4.0) |
| Entrez ID | Symbol | Category | Interaction Types | Drug Claim Name | Drug Name | PMIDs |
| Page: 1 |

Copyright 2023-Present -The University of Texas Health Science Center at Houston |