
|
|||||
|
 | |
| |
| |
| |
| |
| |
|
Gene: NSFL1C |
Gene summary for NSFL1C |
| Gene information | Species | Human | Gene symbol | NSFL1C | Gene ID | 55968 |
| Gene name | NSFL1 cofactor | |
| Gene Alias | P47 | |
| Cytomap | 20p13 | |
| Gene Type | protein-coding | GO ID | GO:0000045 | UniProtAcc | Q53FE8 |
Top |
Malignant transformation analysis |
| Identification of the aberrant gene expression in precancerous and cancerous lesions by comparing the gene expression of stem-like cells in diseased tissues with normal stem cells |
| Entrez ID | Symbol | Replicates | Species | Organ | Tissue | Adj P-value | Log2FC | Malignancy |
| 55968 | NSFL1C | HTA11_347_2000001011 | Human | Colorectum | AD | 1.78e-11 | 3.58e-01 | -0.1954 |
| 55968 | NSFL1C | HTA11_2112_2000001011 | Human | Colorectum | SER | 2.20e-02 | 6.25e-01 | -0.2196 |
| 55968 | NSFL1C | HTA11_3361_2000001011 | Human | Colorectum | AD | 1.35e-03 | 3.57e-01 | -0.1207 |
| 55968 | NSFL1C | HTA11_696_2000001011 | Human | Colorectum | AD | 2.02e-09 | 4.09e-01 | -0.1464 |
| 55968 | NSFL1C | HTA11_866_2000001011 | Human | Colorectum | AD | 7.72e-03 | 1.98e-01 | -0.1001 |
| 55968 | NSFL1C | HTA11_1391_2000001011 | Human | Colorectum | AD | 2.91e-14 | 5.74e-01 | -0.059 |
| 55968 | NSFL1C | HTA11_5212_2000001011 | Human | Colorectum | AD | 3.55e-02 | 3.78e-01 | -0.2061 |
| 55968 | NSFL1C | HTA11_546_2000001011 | Human | Colorectum | AD | 1.29e-02 | 3.09e-01 | -0.0842 |
| 55968 | NSFL1C | HTA11_866_3004761011 | Human | Colorectum | AD | 8.82e-18 | 5.85e-01 | 0.096 |
| 55968 | NSFL1C | HTA11_7696_3000711011 | Human | Colorectum | AD | 3.15e-07 | 3.05e-01 | 0.0674 |
| 55968 | NSFL1C | HTA11_6818_2000001021 | Human | Colorectum | AD | 5.48e-05 | 3.95e-01 | 0.0588 |
| 55968 | NSFL1C | HTA11_99999970781_79442 | Human | Colorectum | MSS | 1.23e-09 | 4.01e-01 | 0.294 |
| 55968 | NSFL1C | HTA11_99999965104_69814 | Human | Colorectum | MSS | 4.83e-11 | 6.08e-01 | 0.281 |
| 55968 | NSFL1C | HTA11_99999971662_82457 | Human | Colorectum | MSS | 1.67e-04 | 2.99e-01 | 0.3859 |
| 55968 | NSFL1C | HTA11_99999973899_84307 | Human | Colorectum | MSS | 1.28e-11 | 5.78e-01 | 0.2585 |
| 55968 | NSFL1C | HTA11_99999974143_84620 | Human | Colorectum | MSS | 6.09e-12 | 4.40e-01 | 0.3005 |
| 55968 | NSFL1C | A002-C-116 | Human | Colorectum | FAP | 4.10e-03 | -1.07e-01 | -0.0452 |
| 55968 | NSFL1C | LZE2T | Human | Esophagus | ESCC | 3.94e-08 | 9.01e-01 | 0.082 |
| 55968 | NSFL1C | LZE3D | Human | Esophagus | HGIN | 1.77e-05 | 4.79e-01 | 0.0668 |
| 55968 | NSFL1C | LZE4T | Human | Esophagus | ESCC | 3.05e-22 | 9.11e-01 | 0.0811 |
| Page: 1 2 3 4 5 6 7 8 |
| Tissue | Expression Dynamics | Abbreviation |
| Colorectum (GSE201348) |  | FAP: Familial adenomatous polyposis |
| CRC: Colorectal cancer | ||
| Colorectum (HTA11) |  | AD: Adenomas |
| SER: Sessile serrated lesions | ||
| MSI-H: Microsatellite-high colorectal cancer | ||
| MSS: Microsatellite stable colorectal cancer | ||
| Esophagus | 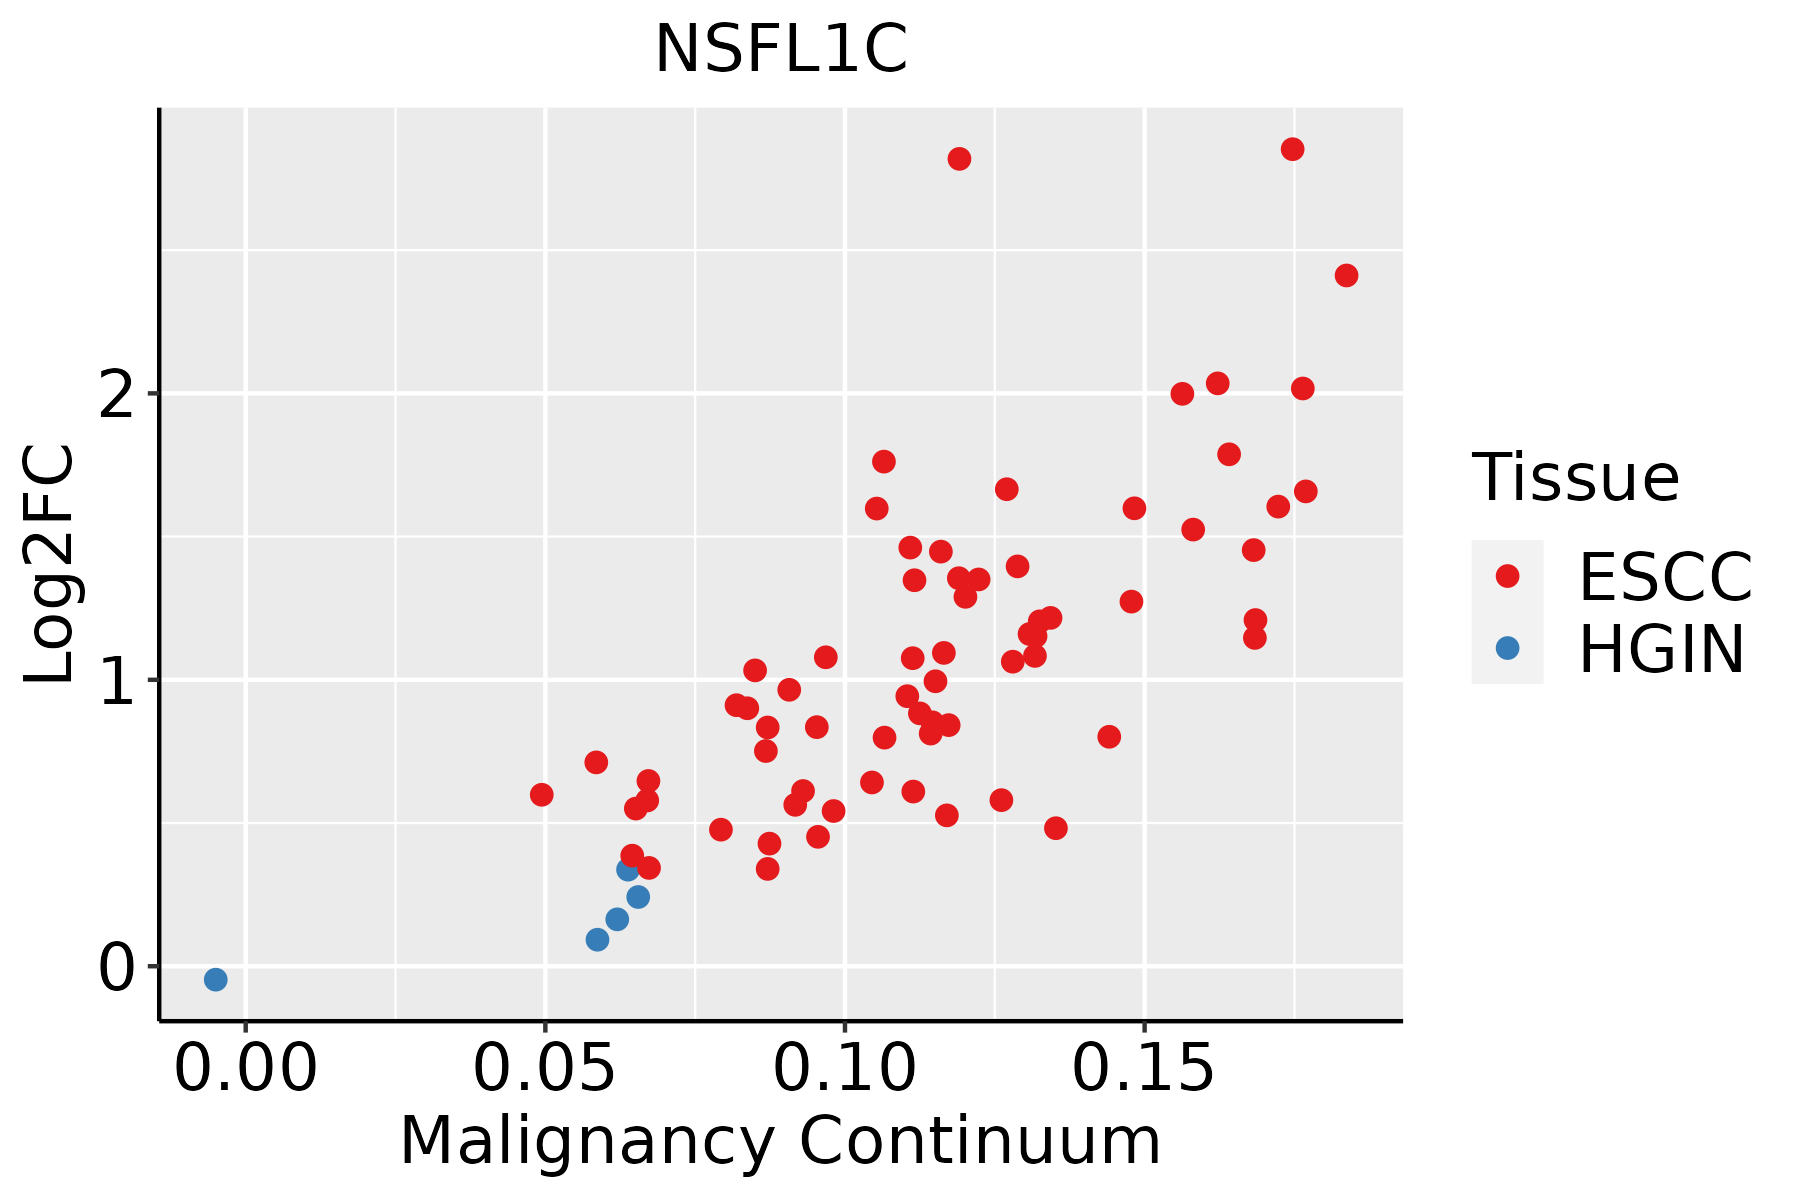 | ESCC: Esophageal squamous cell carcinoma |
| HGIN: High-grade intraepithelial neoplasias | ||
| LGIN: Low-grade intraepithelial neoplasias | ||
| Liver |  | HCC: Hepatocellular carcinoma |
| NAFLD: Non-alcoholic fatty liver disease | ||
| Oral Cavity | 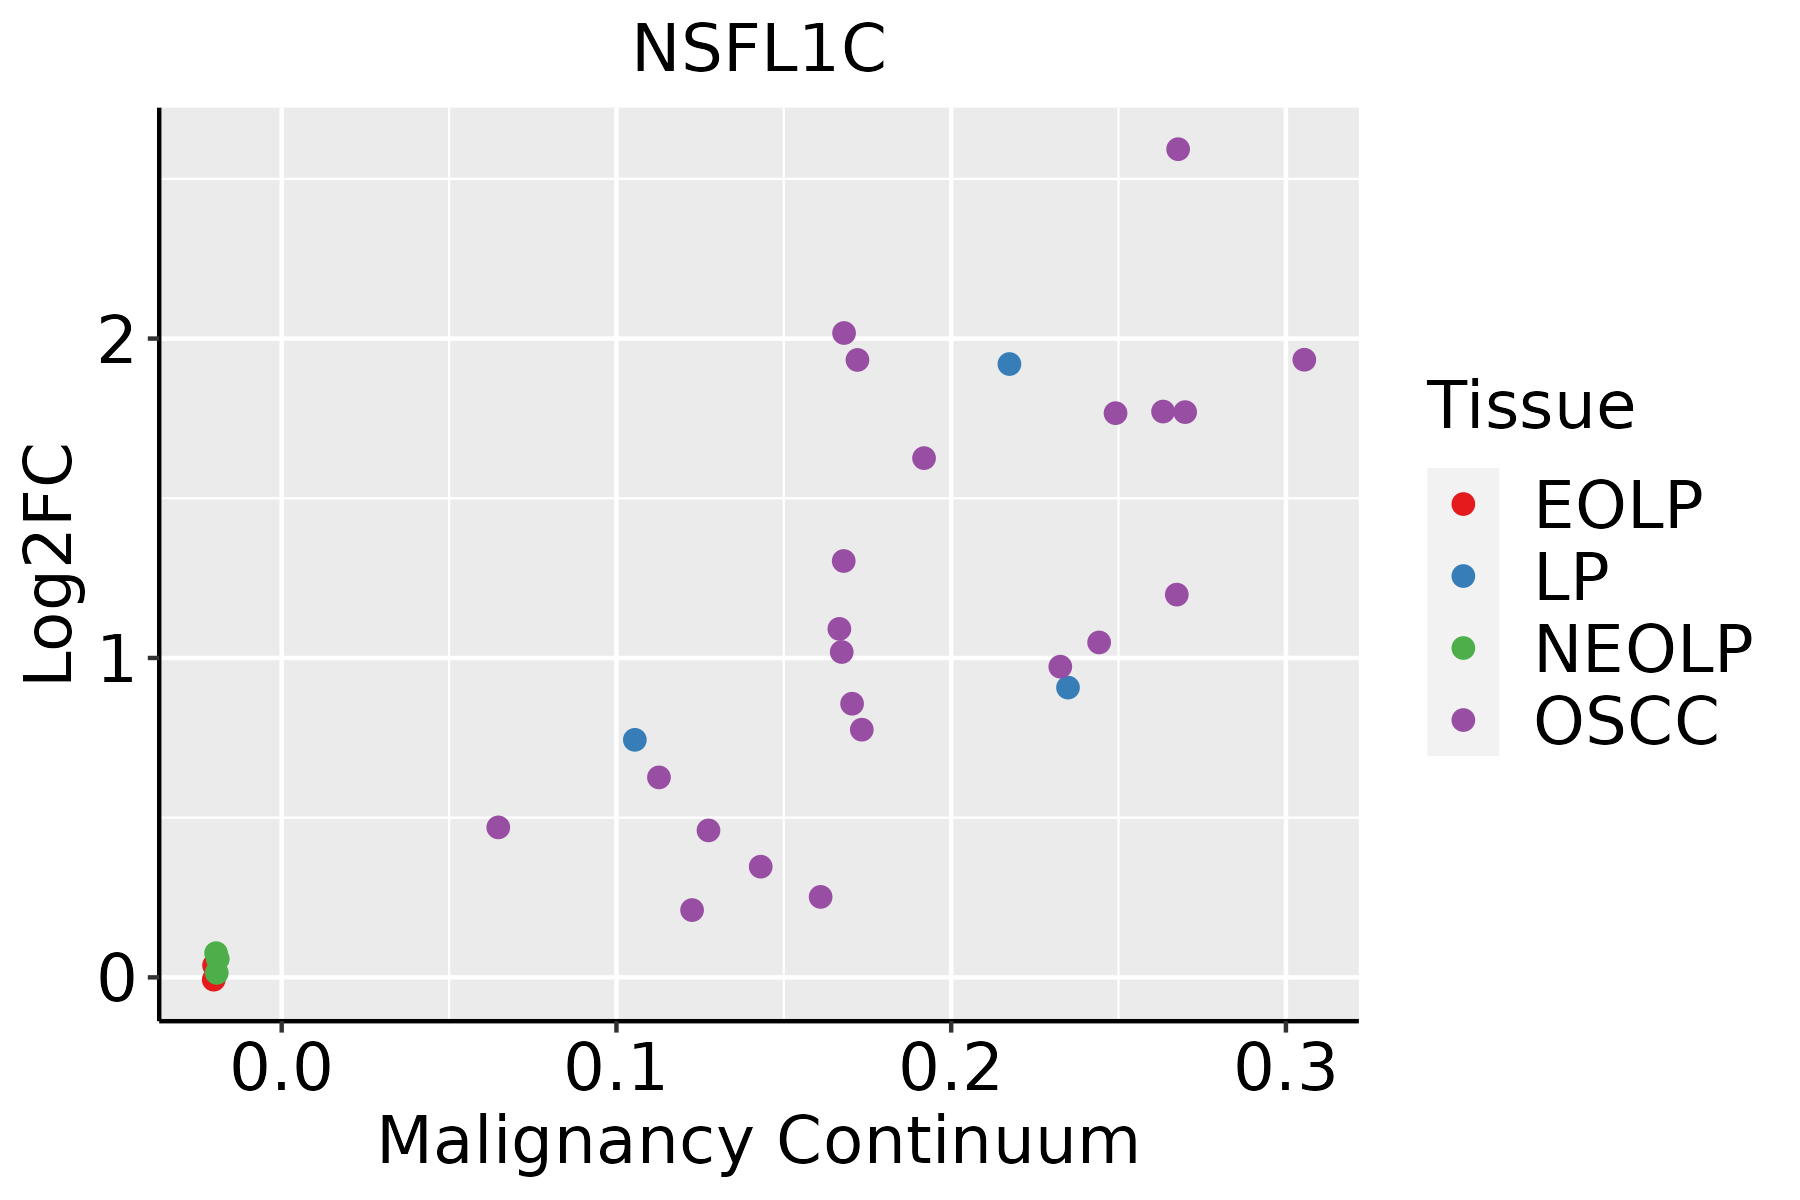 | EOLP: Erosive Oral lichen planus |
| LP: leukoplakia | ||
| NEOLP: Non-erosive oral lichen planus | ||
| OSCC: Oral squamous cell carcinoma | ||
| Skin | 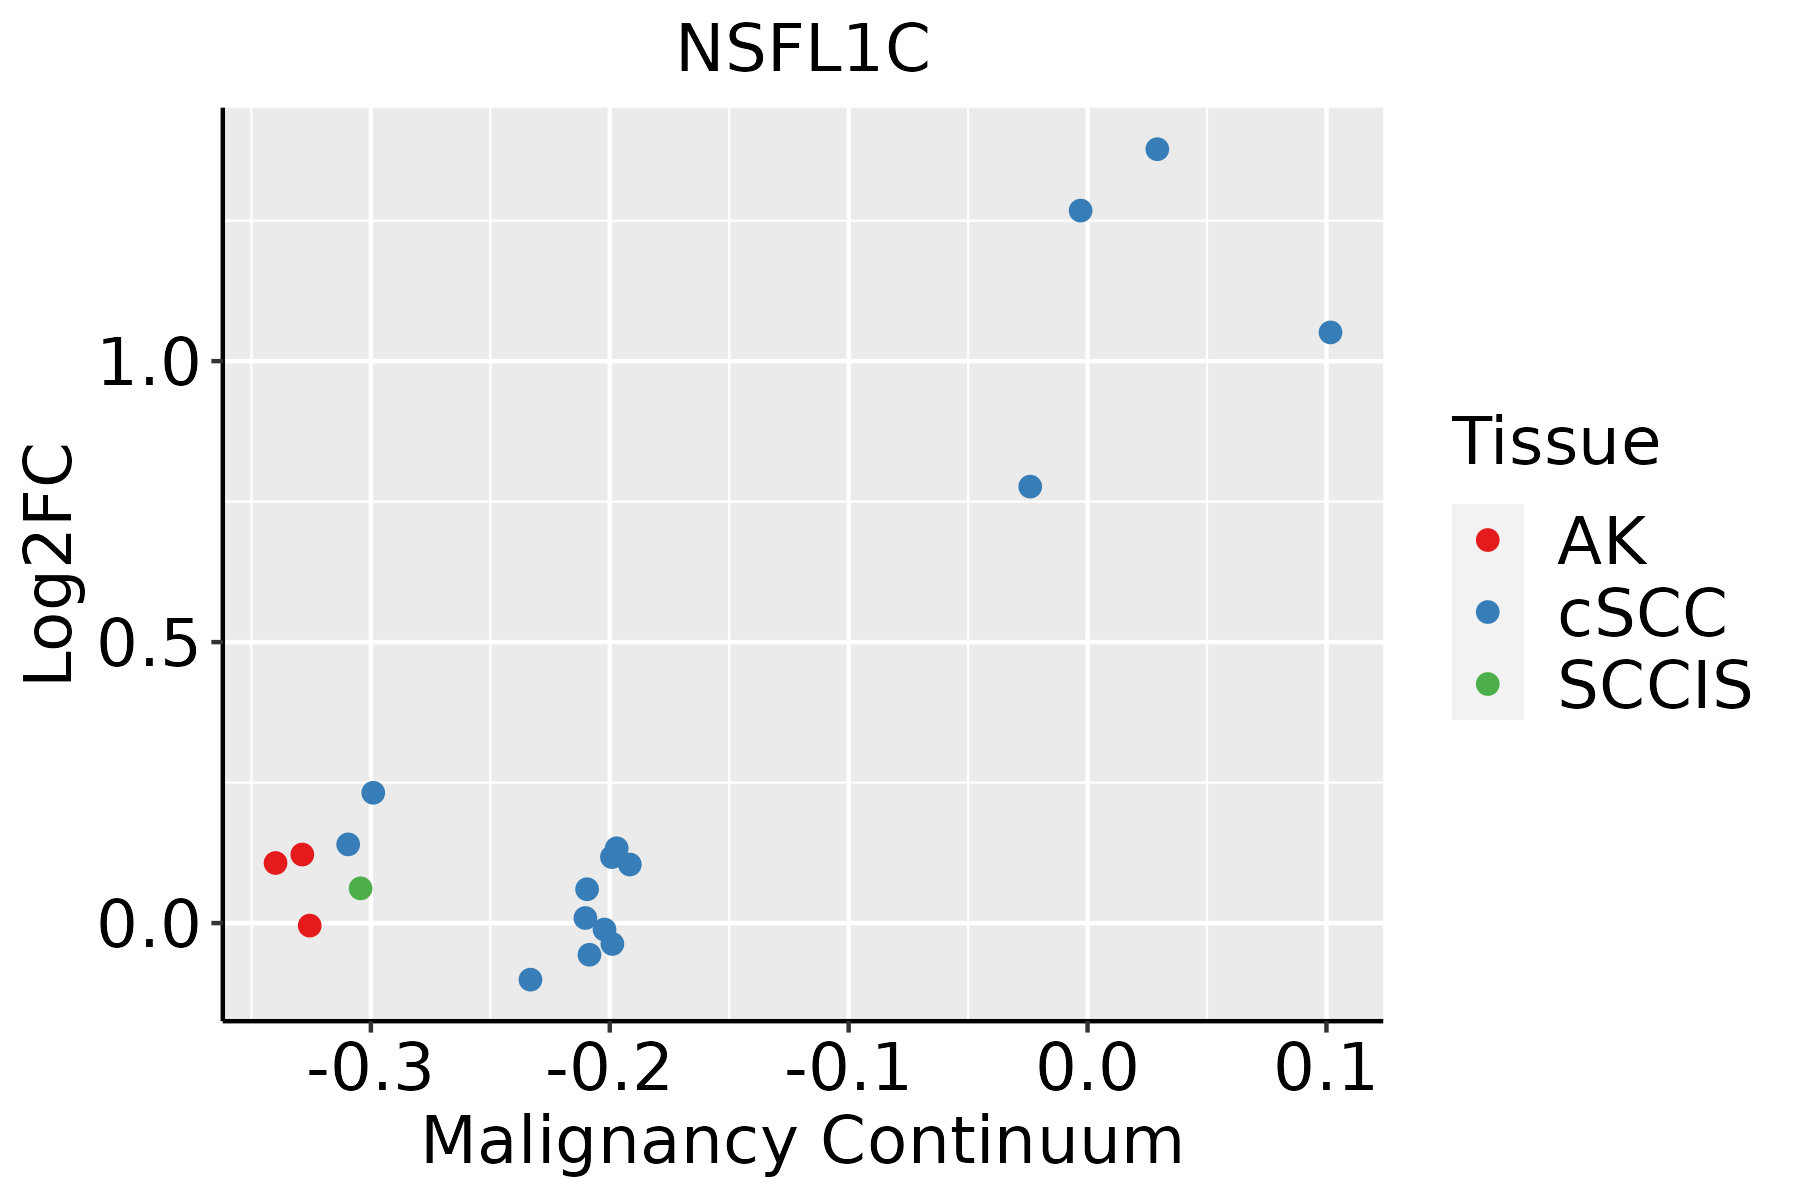 | AK: Actinic keratosis |
| cSCC: Cutaneous squamous cell carcinoma | ||
| SCCIS:squamous cell carcinoma in situ | ||
| Thyroid |  | ATC: Anaplastic thyroid cancer |
| HT: Hashimoto's thyroiditis | ||
| PTC: Papillary thyroid cancer |
| ∗log2FC in expression of this searched gene in stem-like cells from each diseased tissue sample relative to stem-like cells in normal samples in each tissue plotted against the malignancy continuum. Samples are colored based on if they are from different disease stage. |
Top |
Malignant transformation related pathway analysis |
| Find out the enriched GO biological processes and KEGG pathways involved in transition from healthy to precancer to cancer |
| Tissue | Disease Stage | Enriched GO biological Processes |
| Colorectum | AD |  |
| Colorectum | SER |  |
| Colorectum | MSS |  |
| Colorectum | MSI-H |  |
| Colorectum | FAP |  |
| ∗Top 15 enriched GO BP terms are showed in the bar plot of each disease state in each tissue. Each row represents a significant GO biological process which is colored according to the -log10(p.adjust). |
| Page: 1 2 3 4 5 6 7 8 9 |
| GO ID | Tissue | Disease Stage | Description | Gene Ratio | Bg Ratio | pvalue | p.adjust | Count |
| GO:0010498 | Colorectum | AD | proteasomal protein catabolic process | 174/3918 | 490/18723 | 3.18e-14 | 7.66e-12 | 174 |
| GO:0043161 | Colorectum | AD | proteasome-mediated ubiquitin-dependent protein catabolic process | 141/3918 | 412/18723 | 1.77e-10 | 1.68e-08 | 141 |
| GO:0051656 | Colorectum | AD | establishment of organelle localization | 131/3918 | 390/18723 | 3.00e-09 | 2.06e-07 | 131 |
| GO:0016236 | Colorectum | AD | macroautophagy | 103/3918 | 291/18723 | 6.76e-09 | 4.15e-07 | 103 |
| GO:0007163 | Colorectum | AD | establishment or maintenance of cell polarity | 77/3918 | 218/18723 | 5.72e-07 | 2.08e-05 | 77 |
| GO:0030010 | Colorectum | AD | establishment of cell polarity | 50/3918 | 143/18723 | 6.90e-05 | 1.11e-03 | 50 |
| GO:0071709 | Colorectum | AD | membrane assembly | 22/3918 | 50/18723 | 2.00e-04 | 2.66e-03 | 22 |
| GO:0071539 | Colorectum | AD | protein localization to centrosome | 16/3918 | 33/18723 | 3.86e-04 | 4.41e-03 | 16 |
| GO:1902850 | Colorectum | AD | microtubule cytoskeleton organization involved in mitosis | 48/3918 | 147/18723 | 5.87e-04 | 6.21e-03 | 48 |
| GO:1905508 | Colorectum | AD | protein localization to microtubule organizing center | 16/3918 | 35/18723 | 8.76e-04 | 8.51e-03 | 16 |
| GO:0044091 | Colorectum | AD | membrane biogenesis | 22/3918 | 55/18723 | 9.88e-04 | 9.28e-03 | 22 |
| GO:1903828 | Colorectum | AD | negative regulation of cellular protein localization | 39/3918 | 117/18723 | 1.18e-03 | 1.06e-02 | 39 |
| GO:0007033 | Colorectum | AD | vacuole organization | 53/3918 | 180/18723 | 4.18e-03 | 2.89e-02 | 53 |
| GO:0045787 | Colorectum | AD | positive regulation of cell cycle | 85/3918 | 313/18723 | 4.76e-03 | 3.22e-02 | 85 |
| GO:0140014 | Colorectum | AD | mitotic nuclear division | 78/3918 | 287/18723 | 6.48e-03 | 4.05e-02 | 78 |
| GO:00104981 | Colorectum | SER | proteasomal protein catabolic process | 132/2897 | 490/18723 | 3.08e-11 | 5.55e-09 | 132 |
| GO:00431611 | Colorectum | SER | proteasome-mediated ubiquitin-dependent protein catabolic process | 105/2897 | 412/18723 | 7.48e-08 | 4.70e-06 | 105 |
| GO:00516561 | Colorectum | SER | establishment of organelle localization | 100/2897 | 390/18723 | 1.11e-07 | 6.79e-06 | 100 |
| GO:00162361 | Colorectum | SER | macroautophagy | 79/2897 | 291/18723 | 1.97e-07 | 1.10e-05 | 79 |
| GO:00071631 | Colorectum | SER | establishment or maintenance of cell polarity | 60/2897 | 218/18723 | 3.45e-06 | 1.33e-04 | 60 |
| Page: 1 2 3 4 5 6 7 8 9 10 11 12 13 14 15 |
| Pathway ID | Tissue | Disease Stage | Description | Gene Ratio | Bg Ratio | pvalue | p.adjust | qvalue | Count |
| hsa04141 | Colorectum | AD | Protein processing in endoplasmic reticulum | 80/2092 | 174/8465 | 5.96e-10 | 1.25e-08 | 7.96e-09 | 80 |
| hsa041411 | Colorectum | AD | Protein processing in endoplasmic reticulum | 80/2092 | 174/8465 | 5.96e-10 | 1.25e-08 | 7.96e-09 | 80 |
| hsa041412 | Colorectum | SER | Protein processing in endoplasmic reticulum | 60/1580 | 174/8465 | 4.20e-07 | 7.33e-06 | 5.32e-06 | 60 |
| hsa041413 | Colorectum | SER | Protein processing in endoplasmic reticulum | 60/1580 | 174/8465 | 4.20e-07 | 7.33e-06 | 5.32e-06 | 60 |
| hsa041414 | Colorectum | MSS | Protein processing in endoplasmic reticulum | 75/1875 | 174/8465 | 3.78e-10 | 8.44e-09 | 5.17e-09 | 75 |
| hsa041415 | Colorectum | MSS | Protein processing in endoplasmic reticulum | 75/1875 | 174/8465 | 3.78e-10 | 8.44e-09 | 5.17e-09 | 75 |
| hsa041418 | Colorectum | FAP | Protein processing in endoplasmic reticulum | 50/1404 | 174/8465 | 3.64e-05 | 3.68e-04 | 2.24e-04 | 50 |
| hsa041419 | Colorectum | FAP | Protein processing in endoplasmic reticulum | 50/1404 | 174/8465 | 3.64e-05 | 3.68e-04 | 2.24e-04 | 50 |
| hsa04141211 | Esophagus | ESCC | Protein processing in endoplasmic reticulum | 147/4205 | 174/8465 | 3.29e-22 | 1.10e-19 | 5.64e-20 | 147 |
| hsa04141310 | Esophagus | ESCC | Protein processing in endoplasmic reticulum | 147/4205 | 174/8465 | 3.29e-22 | 1.10e-19 | 5.64e-20 | 147 |
| hsa0414114 | Liver | Cirrhotic | Protein processing in endoplasmic reticulum | 114/2530 | 174/8465 | 1.16e-22 | 9.67e-21 | 5.96e-21 | 114 |
| hsa0414115 | Liver | Cirrhotic | Protein processing in endoplasmic reticulum | 114/2530 | 174/8465 | 1.16e-22 | 9.67e-21 | 5.96e-21 | 114 |
| hsa0414122 | Liver | HCC | Protein processing in endoplasmic reticulum | 146/4020 | 174/8465 | 7.34e-24 | 2.46e-21 | 1.37e-21 | 146 |
| hsa0414132 | Liver | HCC | Protein processing in endoplasmic reticulum | 146/4020 | 174/8465 | 7.34e-24 | 2.46e-21 | 1.37e-21 | 146 |
| hsa0414130 | Oral cavity | OSCC | Protein processing in endoplasmic reticulum | 143/3704 | 174/8465 | 6.82e-26 | 2.28e-23 | 1.16e-23 | 143 |
| hsa04141113 | Oral cavity | OSCC | Protein processing in endoplasmic reticulum | 143/3704 | 174/8465 | 6.82e-26 | 2.28e-23 | 1.16e-23 | 143 |
| hsa04141210 | Oral cavity | LP | Protein processing in endoplasmic reticulum | 113/2418 | 174/8465 | 8.74e-24 | 5.82e-22 | 3.76e-22 | 113 |
| hsa0414138 | Oral cavity | LP | Protein processing in endoplasmic reticulum | 113/2418 | 174/8465 | 8.74e-24 | 5.82e-22 | 3.76e-22 | 113 |
| Page: 1 |
Top |
Cell-cell communication analysis |
| Identification of potential cell-cell interactions between two cell types and their ligand-receptor pairs for different disease states |
| Ligand | Receptor | LRpair | Pathway | Tissue | Disease Stage |
| Page: 1 |
Top |
Single-cell gene regulatory network inference analysis |
| Find out the significant the regulons (TFs) and the target genes of each regulon across cell types for different disease states |
| TF | Cell Type | Tissue | Disease Stage | Target Gene | RSS | Regulon Activity |
| ∗The dot plots of a searched regulon are shown for all cell subpopulations in each disease state of each tissue based on the regulon specific score inferred using pySCENIC and by calculating the average expression. |
| Page: 1 |
Top |
Somatic mutation of malignant transformation related genes |
| Annotation of somatic variants for genes involved in malignant transformation |
| Hugo Symbol | Variant Class | Variant Classification | dbSNP RS | HGVSc | HGVSp | HGVSp Short | SWISSPROT | BIOTYPE | SIFT | PolyPhen | Tumor Sample Barcode | Tissue | Histology | Sex | Age | Stage | Therapy Types | Drugs | Outcome |
| NSFL1C | SNV | Missense_Mutation | c.316N>G | p.Gln106Glu | p.Q106E | Q9UNZ2 | protein_coding | tolerated(0.42) | benign(0.263) | TCGA-A2-A25E-01 | Breast | breast invasive carcinoma | Female | <65 | III/IV | Chemotherapy | cytoxan | PD | |
| NSFL1C | SNV | Missense_Mutation | c.488C>T | p.Pro163Leu | p.P163L | Q9UNZ2 | protein_coding | tolerated(0.71) | possibly_damaging(0.491) | TCGA-A7-A0DA-01 | Breast | breast invasive carcinoma | Female | <65 | I/II | Chemotherapy | adriamycin | SD | |
| NSFL1C | SNV | Missense_Mutation | c.179C>T | p.Ser60Leu | p.S60L | Q9UNZ2 | protein_coding | tolerated(0.28) | benign(0.269) | TCGA-AC-A23H-01 | Breast | breast invasive carcinoma | Female | >=65 | I/II | Unknown | Unknown | PD | |
| NSFL1C | SNV | Missense_Mutation | novel | c.308N>T | p.Arg103Ile | p.R103I | Q9UNZ2 | protein_coding | tolerated(0.17) | possibly_damaging(0.857) | TCGA-AN-A046-01 | Breast | breast invasive carcinoma | Female | >=65 | I/II | Unknown | Unknown | SD |
| NSFL1C | SNV | Missense_Mutation | novel | c.650N>A | p.Arg217Lys | p.R217K | Q9UNZ2 | protein_coding | tolerated(0.33) | benign(0.065) | TCGA-EW-A3E8-01 | Breast | breast invasive carcinoma | Female | <65 | I/II | Hormone Therapy | anastrozole | SD |
| NSFL1C | insertion | Frame_Shift_Ins | novel | c.575_576insTGCCAGCAGAGCTTCGGAGGCTAGCTCA | p.Phe193AlafsTer14 | p.F193Afs*14 | Q9UNZ2 | protein_coding | TCGA-B6-A0IN-01 | Breast | breast invasive carcinoma | Female | <65 | I/II | Unknown | Unknown | PD | ||
| NSFL1C | SNV | Missense_Mutation | novel | c.388N>C | p.Glu130Gln | p.E130Q | Q9UNZ2 | protein_coding | deleterious(0.01) | possibly_damaging(0.828) | TCGA-LP-A4AV-01 | Cervix | cervical & endocervical cancer | Female | <65 | I/II | Unknown | Unknown | SD |
| NSFL1C | SNV | Missense_Mutation | c.907N>T | p.Arg303Trp | p.R303W | Q9UNZ2 | protein_coding | deleterious(0.03) | probably_damaging(0.978) | TCGA-AA-3977-01 | Colorectum | colon adenocarcinoma | Male | >=65 | I/II | Unknown | Unknown | SD | |
| NSFL1C | SNV | Missense_Mutation | rs756406410 | c.161C>T | p.Ser54Leu | p.S54L | Q9UNZ2 | protein_coding | tolerated(0.15) | benign(0.07) | TCGA-AA-3984-01 | Colorectum | colon adenocarcinoma | Female | <65 | I/II | Unknown | Unknown | SD |
| NSFL1C | SNV | Missense_Mutation | rs756406410 | c.161N>T | p.Ser54Leu | p.S54L | Q9UNZ2 | protein_coding | tolerated(0.15) | benign(0.07) | TCGA-AZ-4315-01 | Colorectum | colon adenocarcinoma | Male | <65 | I/II | Unknown | Unknown | SD |
| Page: 1 2 3 4 5 |
Top |
Related drugs of malignant transformation related genes |
| Identification of chemicals and drugs interact with genes involved in malignant transfromation |
| (DGIdb 4.0) |
| Entrez ID | Symbol | Category | Interaction Types | Drug Claim Name | Drug Name | PMIDs |
| Page: 1 |

Copyright 2023-Present -The University of Texas Health Science Center at Houston |