
|
|||||
|
 | |
| |
| |
| |
| |
| |
|
Gene: NSF |
Gene summary for NSF |
| Gene information | Species | Human | Gene symbol | NSF | Gene ID | 4905 |
| Gene name | N-ethylmaleimide sensitive factor, vesicle fusing ATPase | |
| Gene Alias | DEE96 | |
| Cytomap | 17q21.31 | |
| Gene Type | protein-coding | GO ID | GO:0001881 | UniProtAcc | P46459 |
Top |
Malignant transformation analysis |
| Identification of the aberrant gene expression in precancerous and cancerous lesions by comparing the gene expression of stem-like cells in diseased tissues with normal stem cells |
| Entrez ID | Symbol | Replicates | Species | Organ | Tissue | Adj P-value | Log2FC | Malignancy |
| 4905 | NSF | CCI_1 | Human | Cervix | CC | 3.87e-02 | 5.67e-01 | 0.528 |
| 4905 | NSF | CCI_2 | Human | Cervix | CC | 7.92e-03 | 6.12e-01 | 0.5249 |
| 4905 | NSF | CCI_3 | Human | Cervix | CC | 4.32e-25 | 1.34e+00 | 0.516 |
| 4905 | NSF | HTA11_3410_2000001011 | Human | Colorectum | AD | 4.90e-15 | -5.16e-01 | 0.0155 |
| 4905 | NSF | HTA11_696_2000001011 | Human | Colorectum | AD | 2.93e-03 | -2.79e-01 | -0.1464 |
| 4905 | NSF | HTA11_2992_2000001011 | Human | Colorectum | SER | 7.52e-04 | -5.06e-01 | -0.1706 |
| 4905 | NSF | HTA11_866_3004761011 | Human | Colorectum | AD | 2.03e-02 | -3.30e-01 | 0.096 |
| 4905 | NSF | HTA11_10711_2000001011 | Human | Colorectum | AD | 1.04e-05 | -4.66e-01 | 0.0338 |
| 4905 | NSF | HTA11_7696_3000711011 | Human | Colorectum | AD | 4.03e-03 | -3.10e-01 | 0.0674 |
| 4905 | NSF | HTA11_6818_2000001021 | Human | Colorectum | AD | 7.23e-04 | -5.07e-01 | 0.0588 |
| 4905 | NSF | HTA11_99999974143_84620 | Human | Colorectum | MSS | 1.61e-18 | -4.94e-01 | 0.3005 |
| 4905 | NSF | A002-C-010 | Human | Colorectum | FAP | 2.66e-02 | -1.69e-01 | 0.242 |
| 4905 | NSF | A001-C-207 | Human | Colorectum | FAP | 1.60e-06 | -3.83e-01 | 0.1278 |
| 4905 | NSF | A015-C-203 | Human | Colorectum | FAP | 2.41e-30 | -4.75e-01 | -0.1294 |
| 4905 | NSF | A015-C-204 | Human | Colorectum | FAP | 3.02e-05 | -2.30e-01 | -0.0228 |
| 4905 | NSF | A014-C-040 | Human | Colorectum | FAP | 8.72e-08 | -5.77e-01 | -0.1184 |
| 4905 | NSF | A002-C-201 | Human | Colorectum | FAP | 2.48e-23 | -5.76e-01 | 0.0324 |
| 4905 | NSF | A002-C-203 | Human | Colorectum | FAP | 1.07e-08 | -3.52e-01 | 0.2786 |
| 4905 | NSF | A001-C-119 | Human | Colorectum | FAP | 3.36e-13 | -5.77e-01 | -0.1557 |
| 4905 | NSF | A001-C-108 | Human | Colorectum | FAP | 1.17e-24 | -5.03e-01 | -0.0272 |
| Page: 1 2 3 4 5 6 7 |
| Tissue | Expression Dynamics | Abbreviation |
| Cervix | 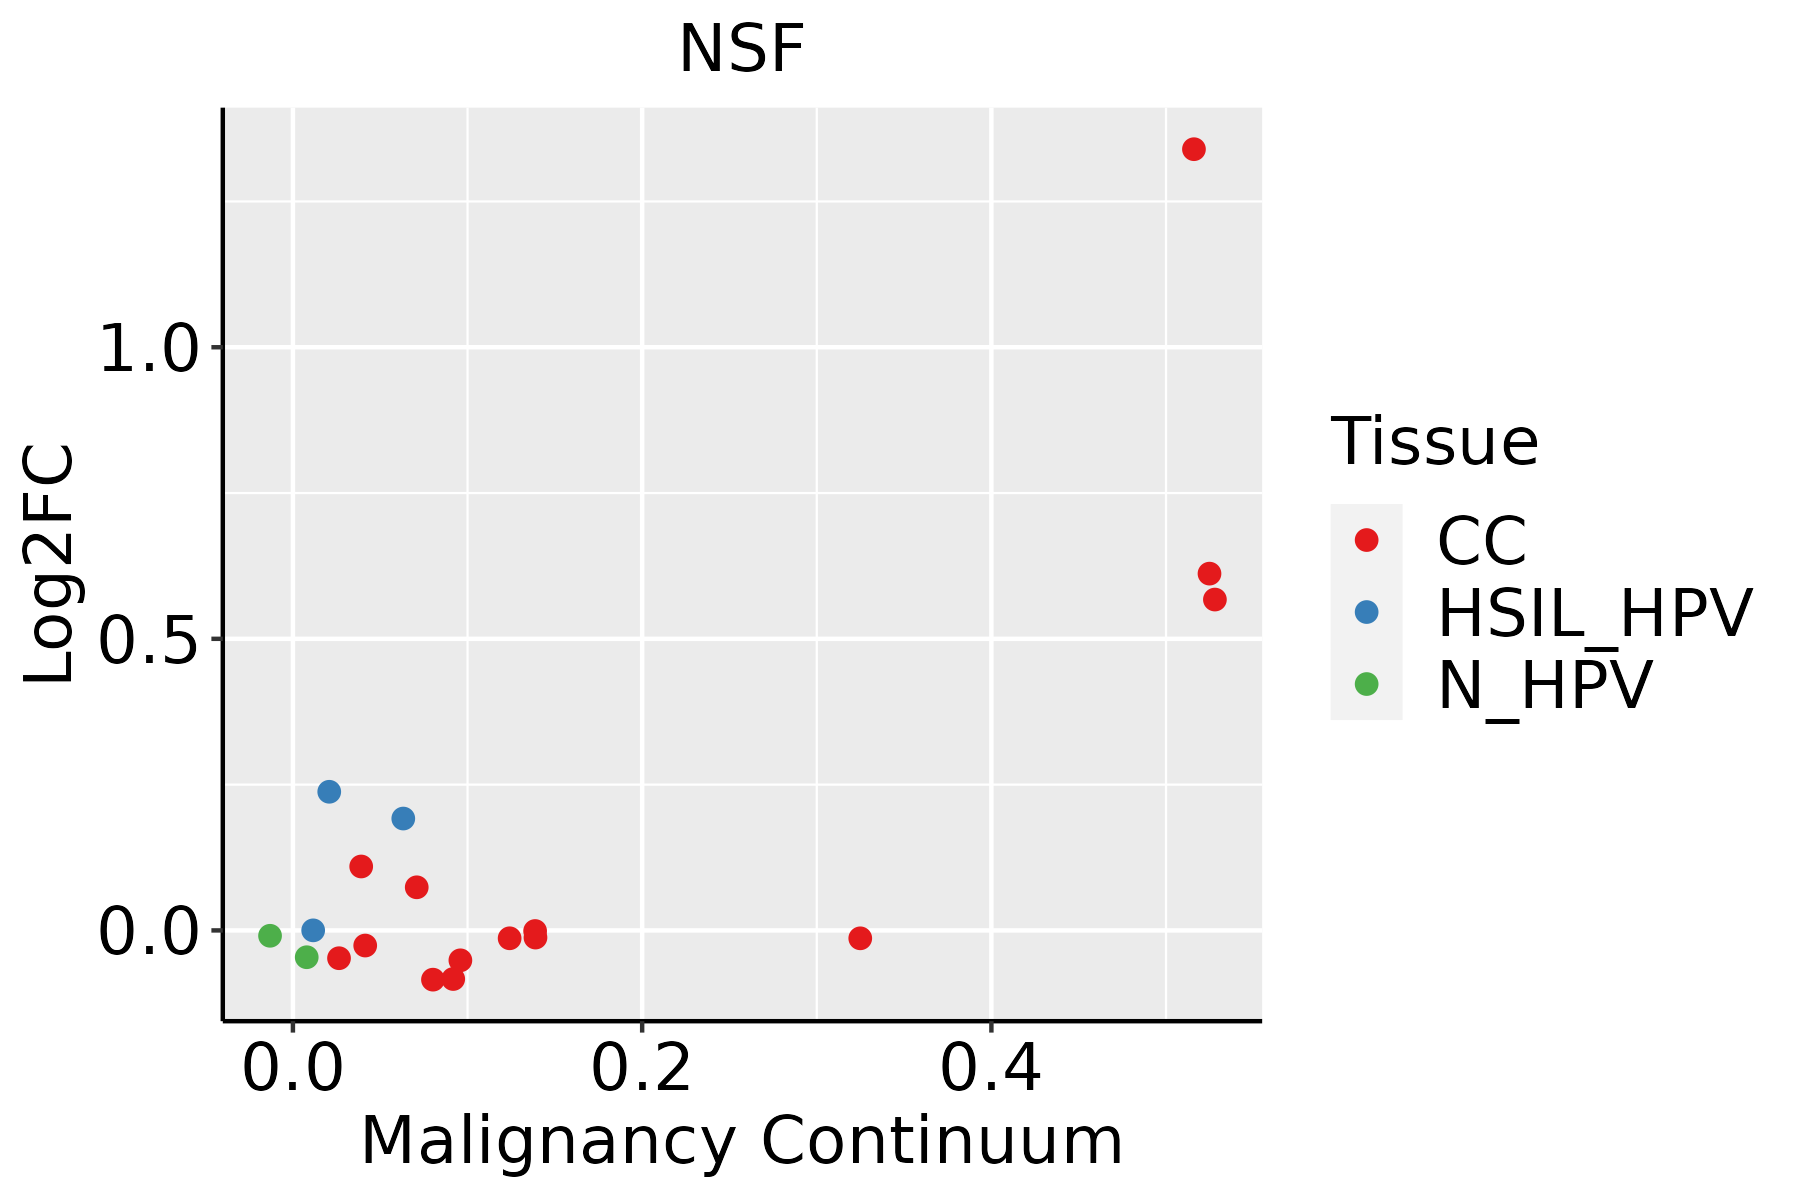 | CC: Cervix cancer |
| HSIL_HPV: HPV-infected high-grade squamous intraepithelial lesions | ||
| N_HPV: HPV-infected normal cervix | ||
| Colorectum (GSE201348) |  | FAP: Familial adenomatous polyposis |
| CRC: Colorectal cancer | ||
| Colorectum (HTA11) |  | AD: Adenomas |
| SER: Sessile serrated lesions | ||
| MSI-H: Microsatellite-high colorectal cancer | ||
| MSS: Microsatellite stable colorectal cancer | ||
| Esophagus |  | ESCC: Esophageal squamous cell carcinoma |
| HGIN: High-grade intraepithelial neoplasias | ||
| LGIN: Low-grade intraepithelial neoplasias | ||
| Liver | 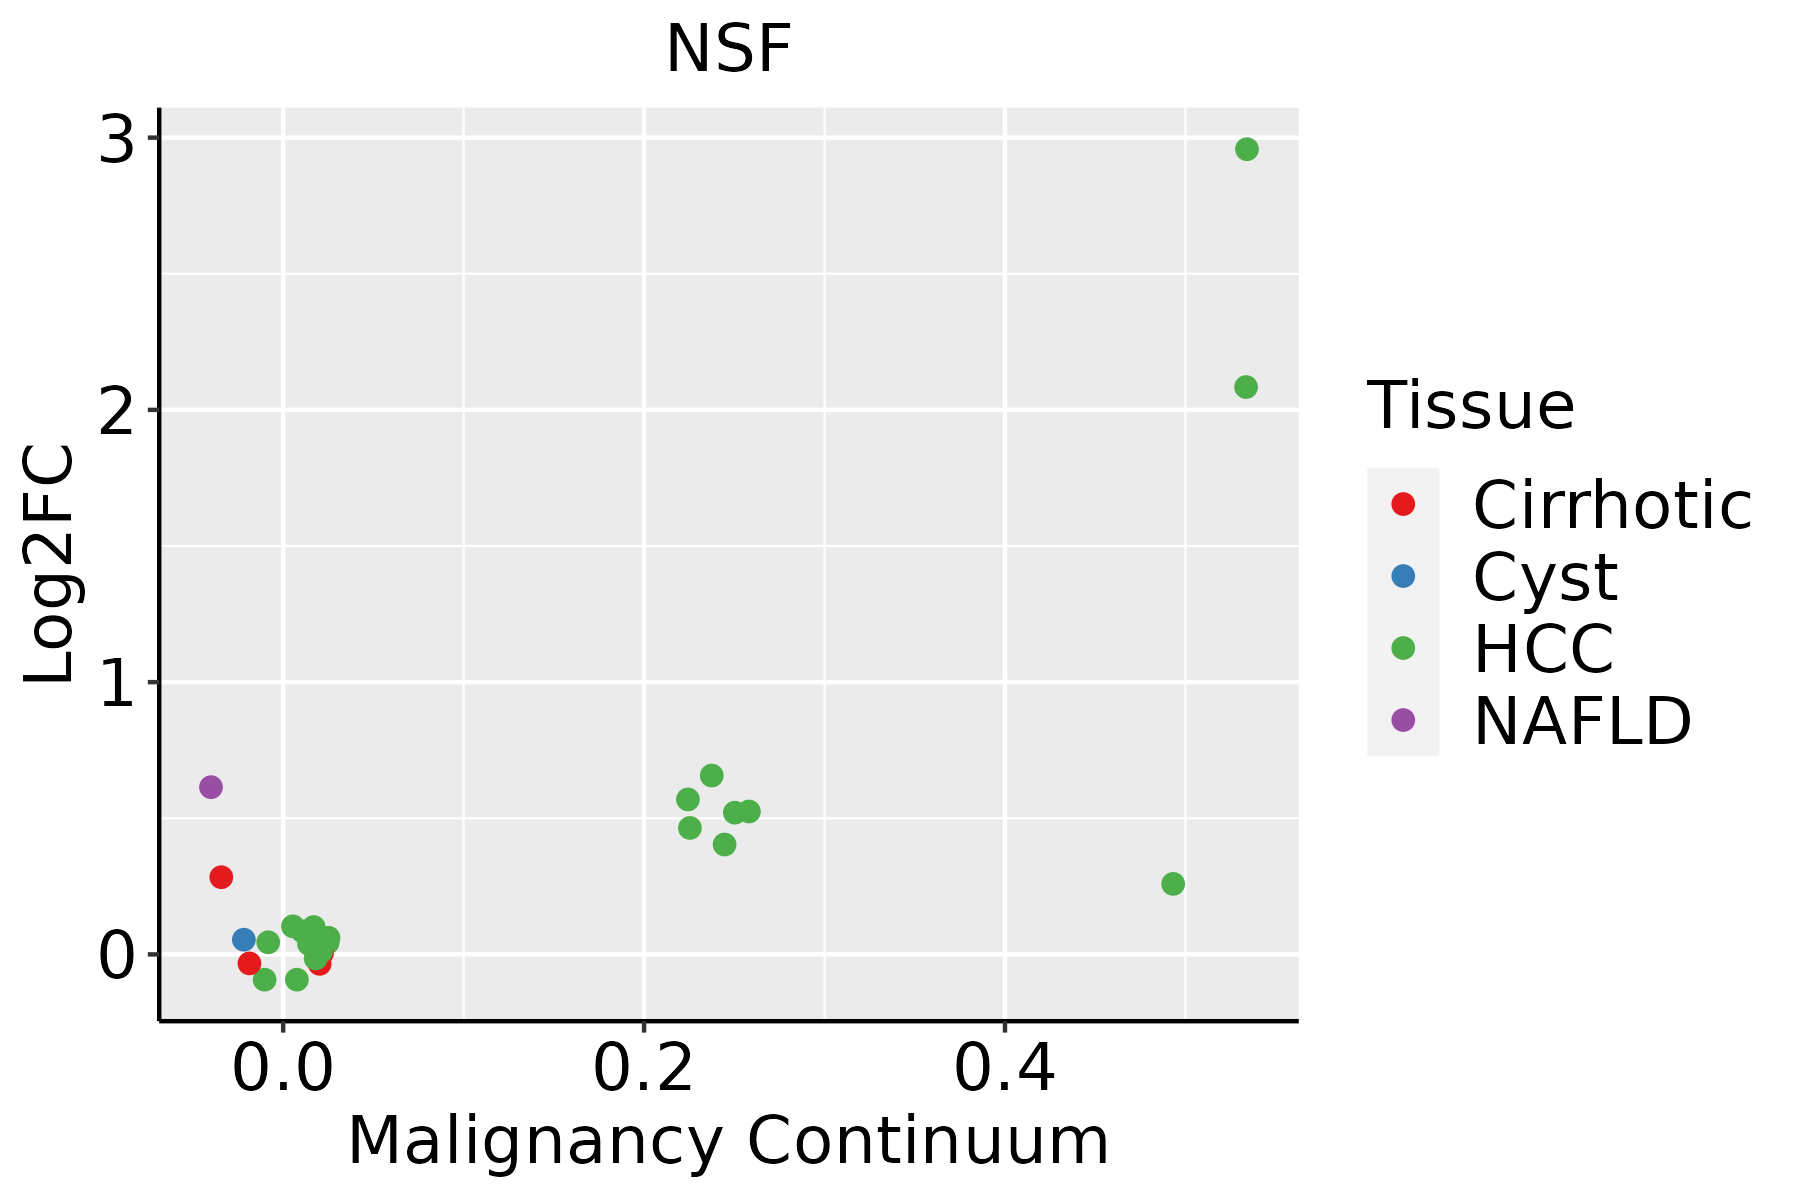 | HCC: Hepatocellular carcinoma |
| NAFLD: Non-alcoholic fatty liver disease | ||
| Thyroid | 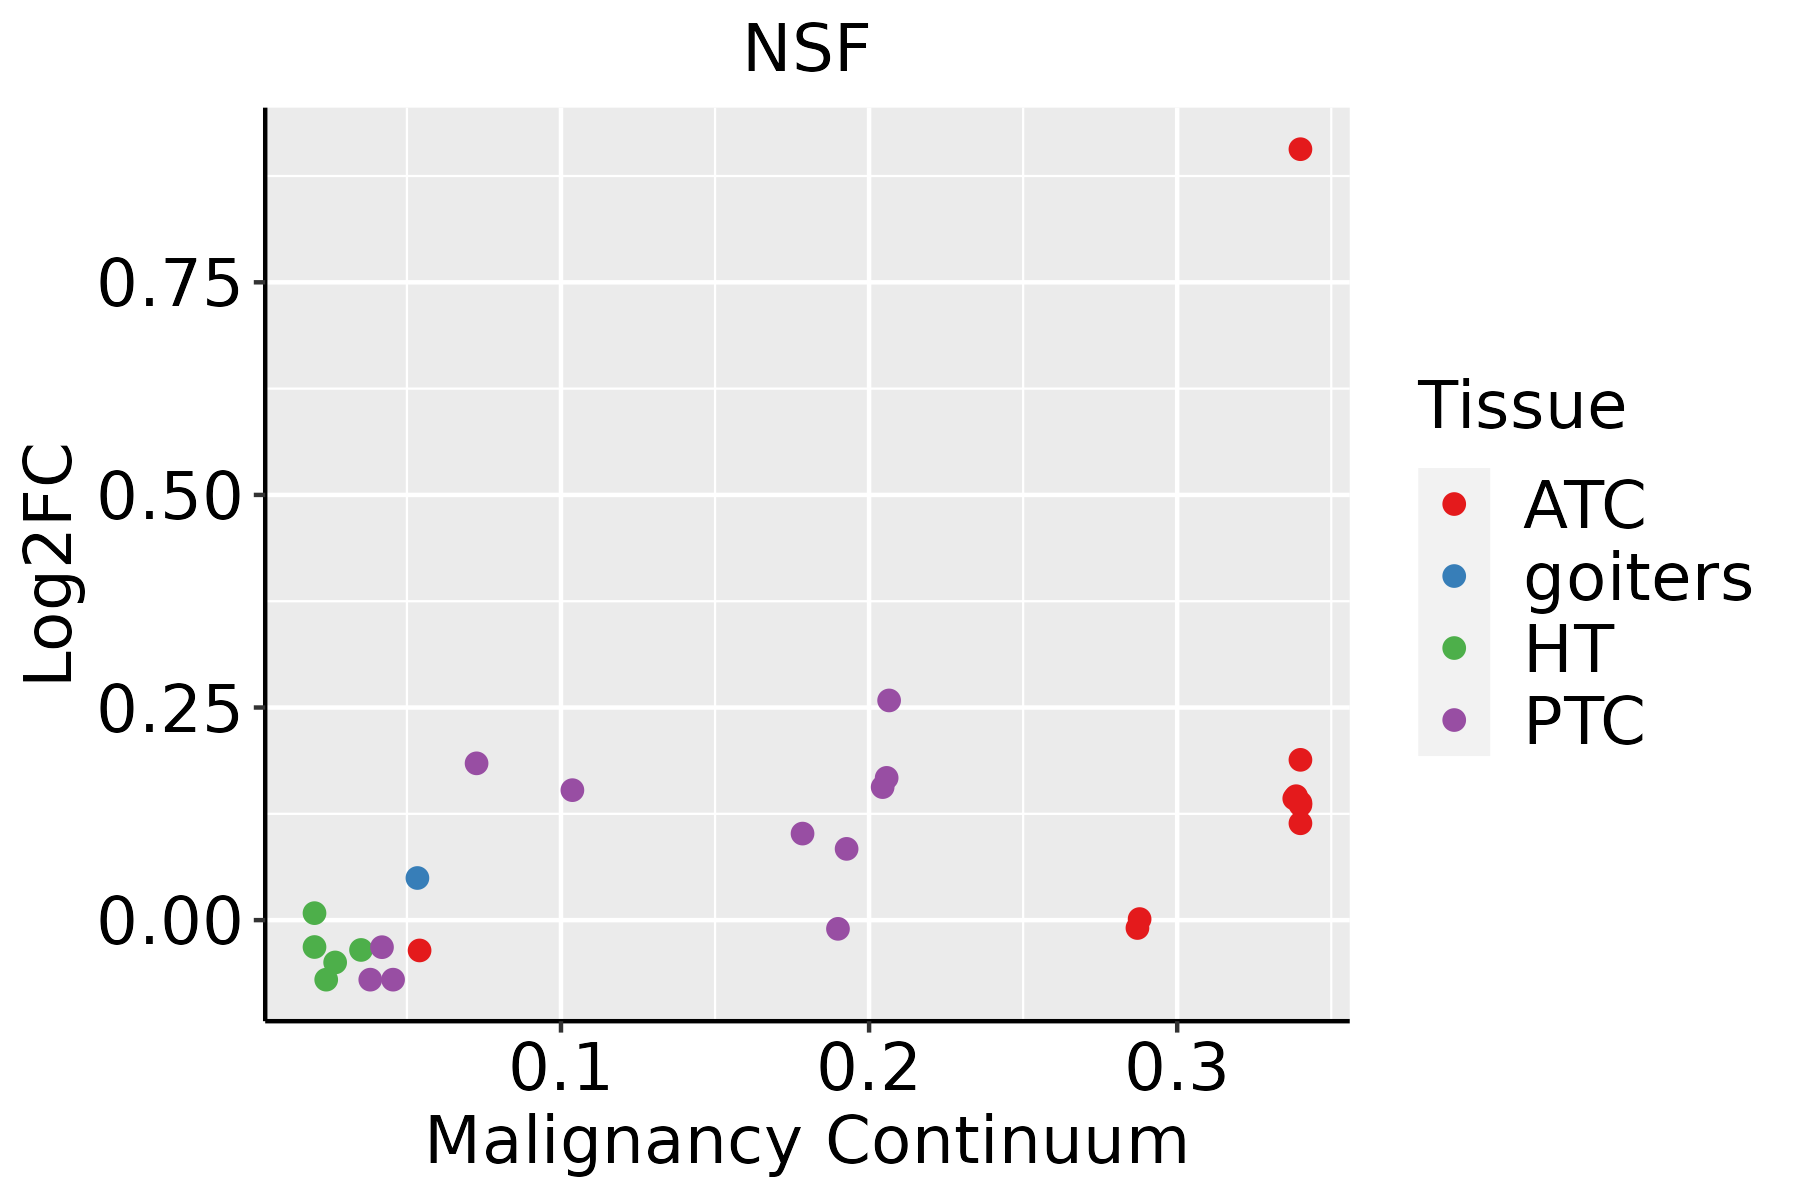 | ATC: Anaplastic thyroid cancer |
| HT: Hashimoto's thyroiditis | ||
| PTC: Papillary thyroid cancer |
| ∗log2FC in expression of this searched gene in stem-like cells from each diseased tissue sample relative to stem-like cells in normal samples in each tissue plotted against the malignancy continuum. Samples are colored based on if they are from different disease stage. |
Top |
Malignant transformation related pathway analysis |
| Find out the enriched GO biological processes and KEGG pathways involved in transition from healthy to precancer to cancer |
| Tissue | Disease Stage | Enriched GO biological Processes |
| Colorectum | AD |  |
| Colorectum | SER |  |
| Colorectum | MSS |  |
| Colorectum | MSI-H |  |
| Colorectum | FAP |  |
| ∗Top 15 enriched GO BP terms are showed in the bar plot of each disease state in each tissue. Each row represents a significant GO biological process which is colored according to the -log10(p.adjust). |
| Page: 1 2 3 4 5 6 7 8 9 |
| GO ID | Tissue | Disease Stage | Description | Gene Ratio | Bg Ratio | pvalue | p.adjust | Count |
| GO:004217610 | Cervix | CC | regulation of protein catabolic process | 104/2311 | 391/18723 | 9.39e-15 | 9.36e-12 | 104 |
| GO:004573210 | Cervix | CC | positive regulation of protein catabolic process | 65/2311 | 231/18723 | 7.44e-11 | 1.39e-08 | 65 |
| GO:007265910 | Cervix | CC | protein localization to plasma membrane | 73/2311 | 284/18723 | 4.95e-10 | 6.73e-08 | 73 |
| GO:000989610 | Cervix | CC | positive regulation of catabolic process | 109/2311 | 492/18723 | 5.26e-10 | 6.99e-08 | 109 |
| GO:19907788 | Cervix | CC | protein localization to cell periphery | 78/2311 | 333/18723 | 1.22e-08 | 9.73e-07 | 78 |
| GO:00988767 | Cervix | CC | vesicle-mediated transport to the plasma membrane | 34/2311 | 136/18723 | 3.75e-05 | 5.91e-04 | 34 |
| GO:00068927 | Cervix | CC | post-Golgi vesicle-mediated transport | 28/2311 | 104/18723 | 4.31e-05 | 6.61e-04 | 28 |
| GO:002241110 | Cervix | CC | cellular component disassembly | 83/2311 | 443/18723 | 6.04e-05 | 8.68e-04 | 83 |
| GO:00901509 | Cervix | CC | establishment of protein localization to membrane | 54/2311 | 260/18723 | 7.67e-05 | 1.05e-03 | 54 |
| GO:00481938 | Cervix | CC | Golgi vesicle transport | 58/2311 | 296/18723 | 2.24e-04 | 2.54e-03 | 58 |
| GO:00431127 | Cervix | CC | receptor metabolic process | 37/2311 | 166/18723 | 2.31e-04 | 2.58e-03 | 37 |
| GO:00068936 | Cervix | CC | Golgi to plasma membrane transport | 16/2311 | 60/18723 | 2.00e-03 | 1.46e-02 | 16 |
| GO:00619516 | Cervix | CC | establishment of protein localization to plasma membrane | 16/2311 | 60/18723 | 2.00e-03 | 1.46e-02 | 16 |
| GO:00430016 | Cervix | CC | Golgi to plasma membrane protein transport | 12/2311 | 40/18723 | 2.44e-03 | 1.71e-02 | 12 |
| GO:00171574 | Cervix | CC | regulation of exocytosis | 39/2311 | 202/18723 | 2.90e-03 | 1.93e-02 | 39 |
| GO:00329847 | Cervix | CC | protein-containing complex disassembly | 41/2311 | 224/18723 | 6.13e-03 | 3.48e-02 | 41 |
| GO:00070092 | Cervix | CC | plasma membrane organization | 28/2311 | 142/18723 | 7.85e-03 | 4.14e-02 | 28 |
| GO:00068873 | Cervix | CC | exocytosis | 59/2311 | 352/18723 | 8.74e-03 | 4.48e-02 | 59 |
| GO:0042176 | Colorectum | AD | regulation of protein catabolic process | 160/3918 | 391/18723 | 1.06e-19 | 7.34e-17 | 160 |
| GO:0072659 | Colorectum | AD | protein localization to plasma membrane | 122/3918 | 284/18723 | 2.86e-17 | 1.49e-14 | 122 |
| Page: 1 2 3 4 5 6 7 8 9 10 11 12 13 14 15 16 17 18 19 20 21 22 23 24 25 |
| Pathway ID | Tissue | Disease Stage | Description | Gene Ratio | Bg Ratio | pvalue | p.adjust | qvalue | Count |
| hsa04962 | Colorectum | AD | Vasopressin-regulated water reabsorption | 19/2092 | 44/8465 | 5.48e-03 | 2.48e-02 | 1.58e-02 | 19 |
| hsa049621 | Colorectum | AD | Vasopressin-regulated water reabsorption | 19/2092 | 44/8465 | 5.48e-03 | 2.48e-02 | 1.58e-02 | 19 |
| hsa049622 | Colorectum | MSS | Vasopressin-regulated water reabsorption | 17/1875 | 44/8465 | 9.76e-03 | 3.55e-02 | 2.18e-02 | 17 |
| hsa049623 | Colorectum | MSS | Vasopressin-regulated water reabsorption | 17/1875 | 44/8465 | 9.76e-03 | 3.55e-02 | 2.18e-02 | 17 |
| hsa0496223 | Esophagus | ESCC | Vasopressin-regulated water reabsorption | 33/4205 | 44/8465 | 5.27e-04 | 1.78e-03 | 9.13e-04 | 33 |
| hsa0496233 | Esophagus | ESCC | Vasopressin-regulated water reabsorption | 33/4205 | 44/8465 | 5.27e-04 | 1.78e-03 | 9.13e-04 | 33 |
| hsa049624 | Liver | HCC | Vasopressin-regulated water reabsorption | 30/4020 | 44/8465 | 4.41e-03 | 1.32e-02 | 7.34e-03 | 30 |
| hsa0496211 | Liver | HCC | Vasopressin-regulated water reabsorption | 30/4020 | 44/8465 | 4.41e-03 | 1.32e-02 | 7.34e-03 | 30 |
| Page: 1 |
Top |
Cell-cell communication analysis |
| Identification of potential cell-cell interactions between two cell types and their ligand-receptor pairs for different disease states |
| Ligand | Receptor | LRpair | Pathway | Tissue | Disease Stage |
| Page: 1 |
Top |
Single-cell gene regulatory network inference analysis |
| Find out the significant the regulons (TFs) and the target genes of each regulon across cell types for different disease states |
| TF | Cell Type | Tissue | Disease Stage | Target Gene | RSS | Regulon Activity |
| ∗The dot plots of a searched regulon are shown for all cell subpopulations in each disease state of each tissue based on the regulon specific score inferred using pySCENIC and by calculating the average expression. |
| Page: 1 |
Top |
Somatic mutation of malignant transformation related genes |
| Annotation of somatic variants for genes involved in malignant transformation |
| Hugo Symbol | Variant Class | Variant Classification | dbSNP RS | HGVSc | HGVSp | HGVSp Short | SWISSPROT | BIOTYPE | SIFT | PolyPhen | Tumor Sample Barcode | Tissue | Histology | Sex | Age | Stage | Therapy Types | Drugs | Outcome |
| NSF | SNV | Missense_Mutation | c.1732G>A | p.Glu578Lys | p.E578K | P46459 | protein_coding | deleterious(0) | probably_damaging(0.987) | TCGA-A8-A093-01 | Breast | breast invasive carcinoma | Female | <65 | I/II | Hormone Therapy | tamoxiphen | SD | |
| NSF | SNV | Missense_Mutation | c.1558G>A | p.Asp520Asn | p.D520N | P46459 | protein_coding | tolerated(0.05) | possibly_damaging(0.633) | TCGA-JW-A5VL-01 | Cervix | cervical & endocervical cancer | Female | <65 | I/II | Unknown | Unknown | SD | |
| NSF | SNV | Missense_Mutation | novel | c.1498G>A | p.Ala500Thr | p.A500T | P46459 | protein_coding | tolerated(0.22) | benign(0) | TCGA-5M-AAT6-01 | Colorectum | colon adenocarcinoma | Female | <65 | III/IV | Unknown | Unknown | PD |
| NSF | SNV | Missense_Mutation | novel | c.1917G>T | p.Lys639Asn | p.K639N | P46459 | protein_coding | deleterious(0) | probably_damaging(0.942) | TCGA-AA-A01R-01 | Colorectum | colon adenocarcinoma | Male | <65 | III/IV | Chemotherapy | 5-fluorouracil | PD |
| NSF | SNV | Missense_Mutation | c.1934C>T | p.Thr645Ile | p.T645I | P46459 | protein_coding | deleterious(0) | probably_damaging(1) | TCGA-CK-4951-01 | Colorectum | colon adenocarcinoma | Female | >=65 | I/II | Unknown | Unknown | PD | |
| NSF | SNV | Missense_Mutation | c.1598G>A | p.Arg533His | p.R533H | P46459 | protein_coding | tolerated(0.08) | benign(0.003) | TCGA-D5-6930-01 | Colorectum | colon adenocarcinoma | Male | >=65 | I/II | Unknown | Unknown | SD | |
| NSF | SNV | Missense_Mutation | novel | c.953C>A | p.Ala318Asp | p.A318D | P46459 | protein_coding | tolerated(1) | benign(0.048) | TCGA-F4-6856-01 | Colorectum | colon adenocarcinoma | Male | <65 | I/II | Ancillary | leucovorin | CR |
| NSF | SNV | Missense_Mutation | rs747396788 | c.1031N>T | p.Thr344Met | p.T344M | P46459 | protein_coding | deleterious(0) | probably_damaging(0.989) | TCGA-NH-A5IV-01 | Colorectum | colon adenocarcinoma | Female | >=65 | I/II | Unknown | Unknown | SD |
| NSF | SNV | Missense_Mutation | c.1448N>A | p.Ser483Tyr | p.S483Y | P46459 | protein_coding | deleterious(0) | possibly_damaging(0.781) | TCGA-EI-6917-01 | Colorectum | rectum adenocarcinoma | Male | <65 | III/IV | Chemotherapy | 5fluorouracil+oxaciplatina+l-folinian | SD | |
| NSF | SNV | Missense_Mutation | novel | c.1766N>G | p.Phe589Cys | p.F589C | P46459 | protein_coding | deleterious(0) | probably_damaging(1) | TCGA-F5-6814-01 | Colorectum | rectum adenocarcinoma | Male | <65 | I/II | Unknown | Unknown | SD |
| Page: 1 2 3 4 |
Top |
Related drugs of malignant transformation related genes |
| Identification of chemicals and drugs interact with genes involved in malignant transfromation |
| (DGIdb 4.0) |
| Entrez ID | Symbol | Category | Interaction Types | Drug Claim Name | Drug Name | PMIDs |
| Page: 1 |

Copyright 2023-Present -The University of Texas Health Science Center at Houston |