
|
|||||
|
 | |
| |
| |
| |
| |
| |
|
Gene: NSDHL |
Gene summary for NSDHL |
| Gene information | Species | Human | Gene symbol | NSDHL | Gene ID | 50814 |
| Gene name | NAD(P) dependent steroid dehydrogenase-like | |
| Gene Alias | H105E3 | |
| Cytomap | Xq28 | |
| Gene Type | protein-coding | GO ID | GO:0000003 | UniProtAcc | Q15738 |
Top |
Malignant transformation analysis |
| Identification of the aberrant gene expression in precancerous and cancerous lesions by comparing the gene expression of stem-like cells in diseased tissues with normal stem cells |
| Entrez ID | Symbol | Replicates | Species | Organ | Tissue | Adj P-value | Log2FC | Malignancy |
| 50814 | NSDHL | LZE2T | Human | Esophagus | ESCC | 2.39e-02 | 3.07e-01 | 0.082 |
| 50814 | NSDHL | LZE4T | Human | Esophagus | ESCC | 6.31e-06 | 2.53e-01 | 0.0811 |
| 50814 | NSDHL | LZE7T | Human | Esophagus | ESCC | 7.44e-08 | 5.64e-01 | 0.0667 |
| 50814 | NSDHL | LZE24T | Human | Esophagus | ESCC | 3.59e-10 | 2.93e-01 | 0.0596 |
| 50814 | NSDHL | LZE6T | Human | Esophagus | ESCC | 3.07e-02 | 2.26e-01 | 0.0845 |
| 50814 | NSDHL | P1T-E | Human | Esophagus | ESCC | 3.41e-09 | 3.92e-01 | 0.0875 |
| 50814 | NSDHL | P2T-E | Human | Esophagus | ESCC | 2.61e-16 | 3.19e-01 | 0.1177 |
| 50814 | NSDHL | P4T-E | Human | Esophagus | ESCC | 1.41e-16 | 4.79e-01 | 0.1323 |
| 50814 | NSDHL | P5T-E | Human | Esophagus | ESCC | 2.71e-16 | 3.46e-01 | 0.1327 |
| 50814 | NSDHL | P8T-E | Human | Esophagus | ESCC | 1.19e-11 | 2.06e-01 | 0.0889 |
| 50814 | NSDHL | P9T-E | Human | Esophagus | ESCC | 5.56e-15 | 3.58e-01 | 0.1131 |
| 50814 | NSDHL | P10T-E | Human | Esophagus | ESCC | 5.61e-26 | 6.96e-01 | 0.116 |
| 50814 | NSDHL | P11T-E | Human | Esophagus | ESCC | 3.51e-03 | 2.11e-01 | 0.1426 |
| 50814 | NSDHL | P12T-E | Human | Esophagus | ESCC | 3.68e-19 | 3.49e-01 | 0.1122 |
| 50814 | NSDHL | P15T-E | Human | Esophagus | ESCC | 9.75e-09 | 2.76e-01 | 0.1149 |
| 50814 | NSDHL | P16T-E | Human | Esophagus | ESCC | 2.19e-11 | 8.46e-02 | 0.1153 |
| 50814 | NSDHL | P19T-E | Human | Esophagus | ESCC | 1.02e-08 | 6.90e-01 | 0.1662 |
| 50814 | NSDHL | P20T-E | Human | Esophagus | ESCC | 6.09e-12 | 3.35e-01 | 0.1124 |
| 50814 | NSDHL | P21T-E | Human | Esophagus | ESCC | 7.74e-36 | 6.43e-01 | 0.1617 |
| 50814 | NSDHL | P22T-E | Human | Esophagus | ESCC | 9.98e-60 | 1.08e+00 | 0.1236 |
| Page: 1 2 3 4 5 |
| Tissue | Expression Dynamics | Abbreviation |
| Esophagus | 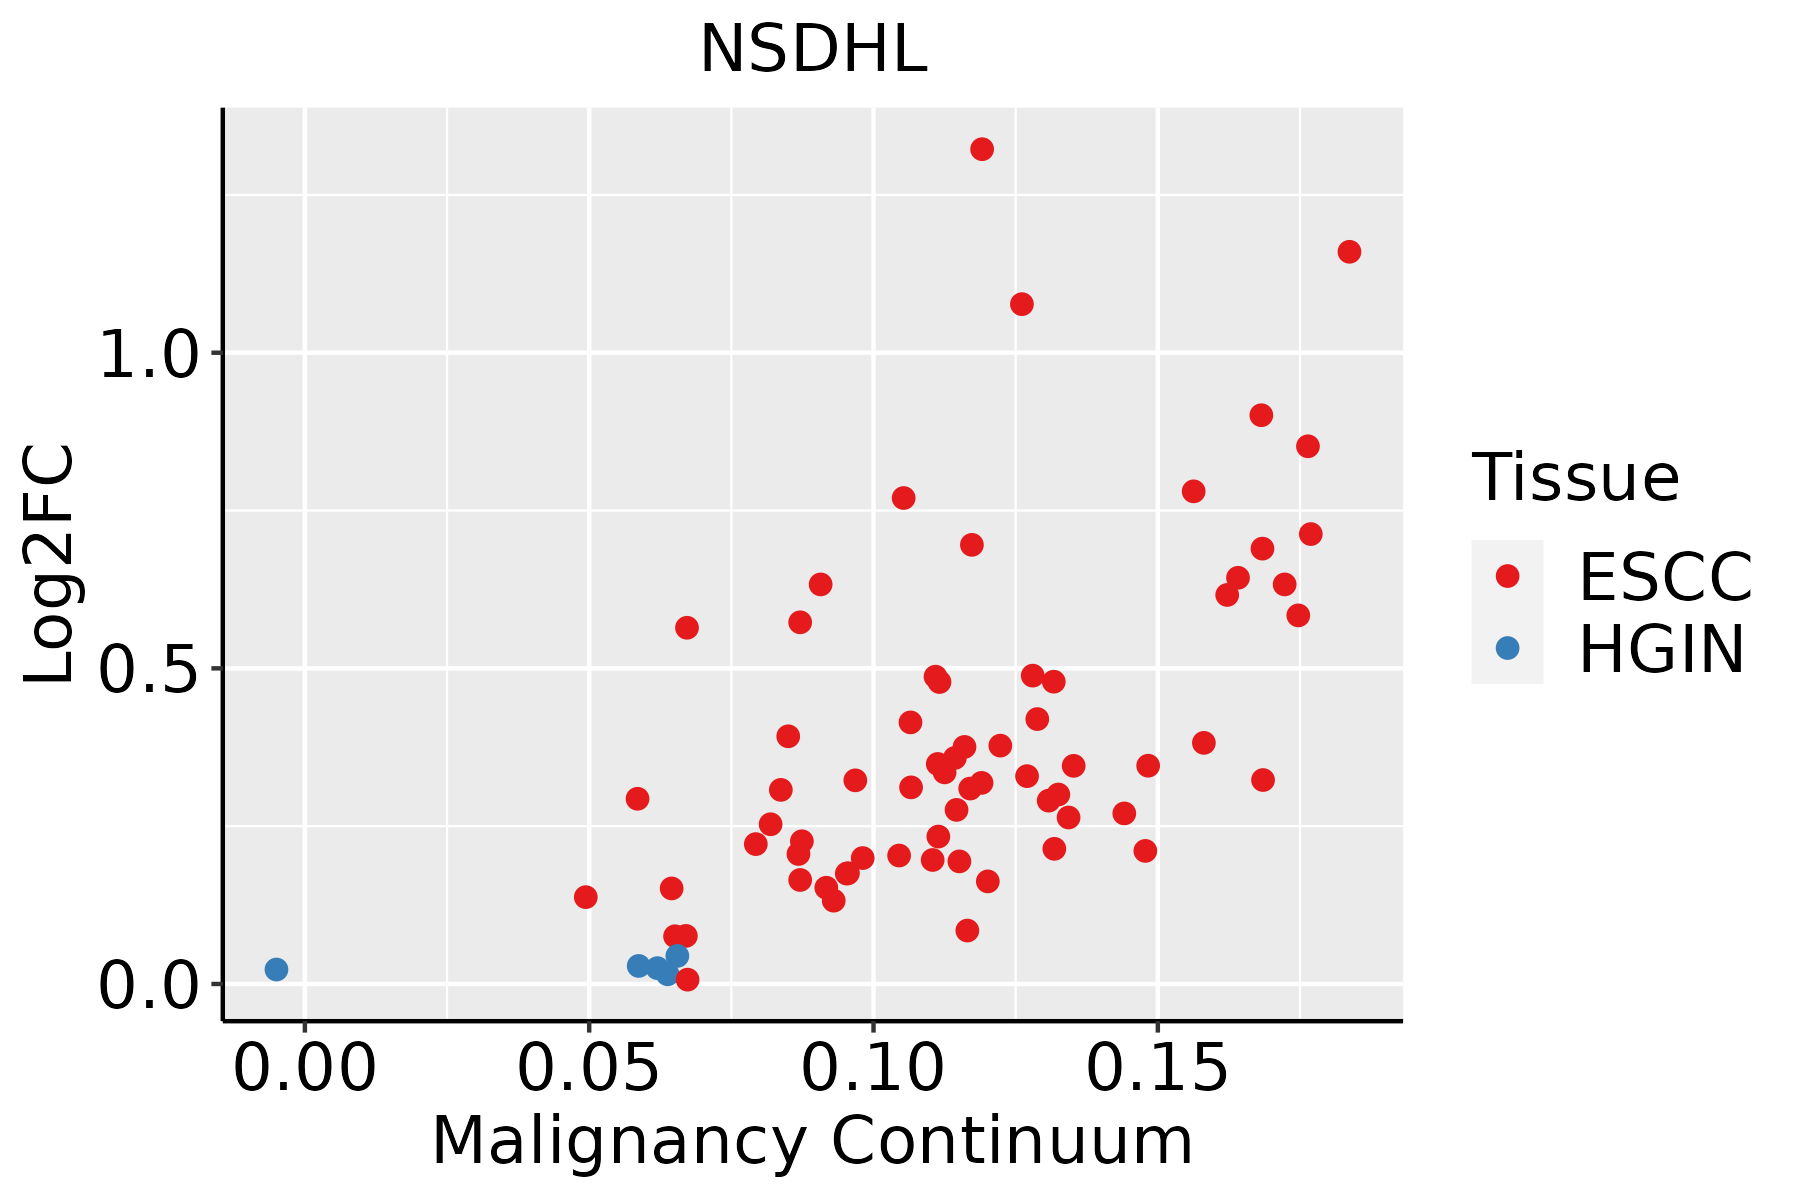 | ESCC: Esophageal squamous cell carcinoma |
| HGIN: High-grade intraepithelial neoplasias | ||
| LGIN: Low-grade intraepithelial neoplasias | ||
| Liver |  | HCC: Hepatocellular carcinoma |
| NAFLD: Non-alcoholic fatty liver disease | ||
| Oral Cavity |  | EOLP: Erosive Oral lichen planus |
| LP: leukoplakia | ||
| NEOLP: Non-erosive oral lichen planus | ||
| OSCC: Oral squamous cell carcinoma | ||
| Skin |  | AK: Actinic keratosis |
| cSCC: Cutaneous squamous cell carcinoma | ||
| SCCIS:squamous cell carcinoma in situ |
| ∗log2FC in expression of this searched gene in stem-like cells from each diseased tissue sample relative to stem-like cells in normal samples in each tissue plotted against the malignancy continuum. Samples are colored based on if they are from different disease stage. |
Top |
Malignant transformation related pathway analysis |
| Find out the enriched GO biological processes and KEGG pathways involved in transition from healthy to precancer to cancer |
| Tissue | Disease Stage | Enriched GO biological Processes |
| Colorectum | AD |  |
| Colorectum | SER |  |
| Colorectum | MSS |  |
| Colorectum | MSI-H |  |
| Colorectum | FAP |  |
| ∗Top 15 enriched GO BP terms are showed in the bar plot of each disease state in each tissue. Each row represents a significant GO biological process which is colored according to the -log10(p.adjust). |
| Page: 1 2 3 4 5 6 7 8 9 |
| GO ID | Tissue | Disease Stage | Description | Gene Ratio | Bg Ratio | pvalue | p.adjust | Count |
| GO:000170119 | Esophagus | ESCC | in utero embryonic development | 243/8552 | 367/18723 | 1.00e-15 | 6.86e-14 | 243 |
| GO:0001890110 | Esophagus | ESCC | placenta development | 98/8552 | 144/18723 | 4.46e-08 | 8.11e-07 | 98 |
| GO:00435888 | Esophagus | ESCC | skin development | 163/8552 | 263/18723 | 6.48e-08 | 1.14e-06 | 163 |
| GO:0061458110 | Esophagus | ESCC | reproductive system development | 247/8552 | 427/18723 | 2.24e-07 | 3.42e-06 | 247 |
| GO:004860818 | Esophagus | ESCC | reproductive structure development | 245/8552 | 424/18723 | 2.82e-07 | 4.14e-06 | 245 |
| GO:000854410 | Esophagus | ESCC | epidermis development | 193/8552 | 324/18723 | 2.87e-07 | 4.19e-06 | 193 |
| GO:00060668 | Esophagus | ESCC | alcohol metabolic process | 202/8552 | 353/18723 | 7.32e-06 | 7.26e-05 | 202 |
| GO:000189219 | Esophagus | ESCC | embryonic placenta development | 57/8552 | 82/18723 | 1.06e-05 | 1.01e-04 | 57 |
| GO:00161263 | Esophagus | ESCC | sterol biosynthetic process | 46/8552 | 64/18723 | 1.91e-05 | 1.67e-04 | 46 |
| GO:00066953 | Esophagus | ESCC | cholesterol biosynthetic process | 41/8552 | 57/18723 | 5.25e-05 | 4.06e-04 | 41 |
| GO:19026533 | Esophagus | ESCC | secondary alcohol biosynthetic process | 41/8552 | 57/18723 | 5.25e-05 | 4.06e-04 | 41 |
| GO:19026524 | Esophagus | ESCC | secondary alcohol metabolic process | 87/8552 | 147/18723 | 6.58e-04 | 3.50e-03 | 87 |
| GO:00485687 | Esophagus | ESCC | embryonic organ development | 228/8552 | 427/18723 | 7.28e-04 | 3.79e-03 | 228 |
| GO:00461653 | Esophagus | ESCC | alcohol biosynthetic process | 83/8552 | 140/18723 | 8.04e-04 | 4.16e-03 | 83 |
| GO:00224043 | Esophagus | ESCC | molting cycle process | 53/8552 | 84/18723 | 9.62e-04 | 4.88e-03 | 53 |
| GO:00224053 | Esophagus | ESCC | hair cycle process | 53/8552 | 84/18723 | 9.62e-04 | 4.88e-03 | 53 |
| GO:0001942 | Esophagus | ESCC | hair follicle development | 51/8552 | 81/18723 | 1.27e-03 | 6.14e-03 | 51 |
| GO:0098773 | Esophagus | ESCC | skin epidermis development | 53/8552 | 85/18723 | 1.43e-03 | 6.77e-03 | 53 |
| GO:00607119 | Esophagus | ESCC | labyrinthine layer development | 30/8552 | 44/18723 | 2.14e-03 | 9.54e-03 | 30 |
| GO:00423033 | Esophagus | ESCC | molting cycle | 64/8552 | 107/18723 | 2.24e-03 | 9.85e-03 | 64 |
| Page: 1 2 3 4 5 6 |
| Pathway ID | Tissue | Disease Stage | Description | Gene Ratio | Bg Ratio | pvalue | p.adjust | qvalue | Count |
| hsa001005 | Esophagus | ESCC | Steroid biosynthesis | 18/4205 | 20/8465 | 1.78e-04 | 6.79e-04 | 3.48e-04 | 18 |
| hsa0010012 | Esophagus | ESCC | Steroid biosynthesis | 18/4205 | 20/8465 | 1.78e-04 | 6.79e-04 | 3.48e-04 | 18 |
| hsa00100 | Liver | Cirrhotic | Steroid biosynthesis | 12/2530 | 20/8465 | 4.92e-03 | 1.76e-02 | 1.09e-02 | 12 |
| hsa001001 | Liver | Cirrhotic | Steroid biosynthesis | 12/2530 | 20/8465 | 4.92e-03 | 1.76e-02 | 1.09e-02 | 12 |
| hsa001002 | Liver | HCC | Steroid biosynthesis | 15/4020 | 20/8465 | 1.17e-02 | 2.97e-02 | 1.65e-02 | 15 |
| hsa001003 | Liver | HCC | Steroid biosynthesis | 15/4020 | 20/8465 | 1.17e-02 | 2.97e-02 | 1.65e-02 | 15 |
| hsa001004 | Oral cavity | OSCC | Steroid biosynthesis | 15/3704 | 20/8465 | 4.62e-03 | 1.13e-02 | 5.75e-03 | 15 |
| hsa0010011 | Oral cavity | OSCC | Steroid biosynthesis | 15/3704 | 20/8465 | 4.62e-03 | 1.13e-02 | 5.75e-03 | 15 |
| hsa0010021 | Oral cavity | LP | Steroid biosynthesis | 11/2418 | 20/8465 | 1.16e-02 | 3.91e-02 | 2.52e-02 | 11 |
| hsa0010031 | Oral cavity | LP | Steroid biosynthesis | 11/2418 | 20/8465 | 1.16e-02 | 3.91e-02 | 2.52e-02 | 11 |
| Page: 1 |
Top |
Cell-cell communication analysis |
| Identification of potential cell-cell interactions between two cell types and their ligand-receptor pairs for different disease states |
| Ligand | Receptor | LRpair | Pathway | Tissue | Disease Stage |
| Page: 1 |
Top |
Single-cell gene regulatory network inference analysis |
| Find out the significant the regulons (TFs) and the target genes of each regulon across cell types for different disease states |
| TF | Cell Type | Tissue | Disease Stage | Target Gene | RSS | Regulon Activity |
| ∗The dot plots of a searched regulon are shown for all cell subpopulations in each disease state of each tissue based on the regulon specific score inferred using pySCENIC and by calculating the average expression. |
| Page: 1 |
Top |
Somatic mutation of malignant transformation related genes |
| Annotation of somatic variants for genes involved in malignant transformation |
| Hugo Symbol | Variant Class | Variant Classification | dbSNP RS | HGVSc | HGVSp | HGVSp Short | SWISSPROT | BIOTYPE | SIFT | PolyPhen | Tumor Sample Barcode | Tissue | Histology | Sex | Age | Stage | Therapy Types | Drugs | Outcome |
| NSDHL | SNV | Missense_Mutation | c.130N>A | p.Gly44Ser | p.G44S | Q15738 | protein_coding | deleterious(0) | probably_damaging(1) | TCGA-BH-A0WA-01 | Breast | breast invasive carcinoma | Female | >=65 | I/II | Unknown | Unknown | SD | |
| NSDHL | SNV | Missense_Mutation | rs782205394 | c.29N>A | p.Arg10Lys | p.R10K | Q15738 | protein_coding | tolerated_low_confidence(0.82) | benign(0) | TCGA-GM-A2D9-01 | Breast | breast invasive carcinoma | Female | >=65 | I/II | Hormone Therapy | arimidex | SD |
| NSDHL | SNV | Missense_Mutation | rs781879080 | c.263N>A | p.Arg88Gln | p.R88Q | Q15738 | protein_coding | tolerated(0.43) | benign(0) | TCGA-OL-A5S0-01 | Breast | breast invasive carcinoma | Female | >=65 | I/II | Chemotherapy | taxol | CR |
| NSDHL | insertion | Frame_Shift_Ins | novel | c.826_827insATTTACAGCAGTTGCAAGCGTGCAGACAGGAATCA | p.Trp276TyrfsTer20 | p.W276Yfs*20 | Q15738 | protein_coding | TCGA-A8-A09D-01 | Breast | breast invasive carcinoma | Female | <65 | I/II | Chemotherapy | doxorubicin | CR | ||
| NSDHL | insertion | Nonsense_Mutation | novel | c.365_366insAAT | p.Tyr122delinsTer | p.Y122delins* | Q15738 | protein_coding | TCGA-AR-A0TY-01 | Breast | breast invasive carcinoma | Female | <65 | I/II | Unspecific | Paclitaxel | PD | ||
| NSDHL | insertion | In_Frame_Ins | novel | c.367_368insAACAGACCTGTTTTAAAAATCCCTTTCAGG | p.Ile123delinsLysGlnThrCysPheLysAsnProPheGlnVal | p.I123delinsKQTCFKNPFQV | Q15738 | protein_coding | TCGA-AR-A0TY-01 | Breast | breast invasive carcinoma | Female | <65 | I/II | Unspecific | Paclitaxel | PD | ||
| NSDHL | insertion | Frame_Shift_Ins | novel | c.307dupC | p.His103ProfsTer10 | p.H103Pfs*10 | Q15738 | protein_coding | TCGA-D8-A1JF-01 | Breast | breast invasive carcinoma | Female | >=65 | III/IV | Unknown | Unknown | SD | ||
| NSDHL | SNV | Missense_Mutation | novel | c.274N>C | p.Tyr92His | p.Y92H | Q15738 | protein_coding | tolerated(0.14) | possibly_damaging(0.744) | TCGA-2W-A8YY-01 | Cervix | cervical & endocervical cancer | Female | <65 | I/II | Chemotherapy | cisplatin | CR |
| NSDHL | SNV | Missense_Mutation | c.202N>C | p.Asp68His | p.D68H | Q15738 | protein_coding | deleterious(0) | probably_damaging(0.986) | TCGA-C5-A2LS-01 | Cervix | cervical & endocervical cancer | Female | <65 | I/II | Unknown | Unknown | SD | |
| NSDHL | SNV | Missense_Mutation | novel | c.616C>G | p.Pro206Ala | p.P206A | Q15738 | protein_coding | deleterious(0) | probably_damaging(0.993) | TCGA-C5-A8XH-01 | Cervix | cervical & endocervical cancer | Female | <65 | I/II | Unknown | Unknown | SD |
| Page: 1 2 3 4 5 6 7 |
Top |
Related drugs of malignant transformation related genes |
| Identification of chemicals and drugs interact with genes involved in malignant transfromation |
| (DGIdb 4.0) |
| Entrez ID | Symbol | Category | Interaction Types | Drug Claim Name | Drug Name | PMIDs |
| Page: 1 |

Copyright 2023-Present -The University of Texas Health Science Center at Houston |