
|
|||||
|
 | |
| |
| |
| |
| |
| |
|
Gene: NSD3 |
Gene summary for NSD3 |
| Gene information | Species | Human | Gene symbol | NSD3 | Gene ID | 54904 |
| Gene name | nuclear receptor binding SET domain protein 3 | |
| Gene Alias | KMT3F | |
| Cytomap | 8p11.23 | |
| Gene Type | protein-coding | GO ID | GO:0000414 | UniProtAcc | Q9BZ95 |
Top |
Malignant transformation analysis |
| Identification of the aberrant gene expression in precancerous and cancerous lesions by comparing the gene expression of stem-like cells in diseased tissues with normal stem cells |
| Entrez ID | Symbol | Replicates | Species | Organ | Tissue | Adj P-value | Log2FC | Malignancy |
| 54904 | NSD3 | GSM4909281 | Human | Breast | IDC | 3.80e-09 | 3.38e-01 | 0.21 |
| 54904 | NSD3 | GSM4909282 | Human | Breast | IDC | 1.33e-10 | 4.14e-01 | -0.0288 |
| 54904 | NSD3 | GSM4909286 | Human | Breast | IDC | 3.09e-15 | 3.07e-01 | 0.1081 |
| 54904 | NSD3 | GSM4909297 | Human | Breast | IDC | 2.95e-22 | 6.63e-01 | 0.1517 |
| 54904 | NSD3 | GSM4909298 | Human | Breast | IDC | 2.56e-75 | 1.09e+00 | 0.1551 |
| 54904 | NSD3 | GSM4909304 | Human | Breast | IDC | 3.27e-02 | 2.07e-01 | 0.1636 |
| 54904 | NSD3 | GSM4909305 | Human | Breast | IDC | 2.10e-03 | 3.02e-01 | 0.0436 |
| 54904 | NSD3 | GSM4909306 | Human | Breast | IDC | 7.40e-07 | 3.48e-01 | 0.1564 |
| 54904 | NSD3 | GSM4909307 | Human | Breast | IDC | 1.36e-02 | 2.51e-01 | 0.1569 |
| 54904 | NSD3 | GSM4909308 | Human | Breast | IDC | 3.24e-07 | 2.89e-01 | 0.158 |
| 54904 | NSD3 | GSM4909309 | Human | Breast | IDC | 2.15e-06 | 4.34e-01 | 0.0483 |
| 54904 | NSD3 | GSM4909311 | Human | Breast | IDC | 1.08e-04 | -1.70e-01 | 0.1534 |
| 54904 | NSD3 | GSM4909317 | Human | Breast | IDC | 1.47e-55 | 1.05e+00 | 0.1355 |
| 54904 | NSD3 | GSM4909318 | Human | Breast | IDC | 6.46e-19 | 1.08e+00 | 0.2031 |
| 54904 | NSD3 | GSM4909319 | Human | Breast | IDC | 2.18e-11 | -6.66e-02 | 0.1563 |
| 54904 | NSD3 | brca1 | Human | Breast | Precancer | 8.25e-07 | -2.20e-01 | -0.0338 |
| 54904 | NSD3 | brca2 | Human | Breast | Precancer | 8.30e-08 | -2.20e-01 | -0.024 |
| 54904 | NSD3 | brca3 | Human | Breast | Precancer | 3.84e-07 | -2.20e-01 | -0.0263 |
| 54904 | NSD3 | M1 | Human | Breast | IDC | 7.26e-22 | 6.92e-01 | 0.1577 |
| 54904 | NSD3 | NCCBC2 | Human | Breast | DCIS | 1.04e-13 | 9.10e-01 | 0.1554 |
| Page: 1 2 3 4 5 6 7 8 9 |
| Tissue | Expression Dynamics | Abbreviation |
| Breast | 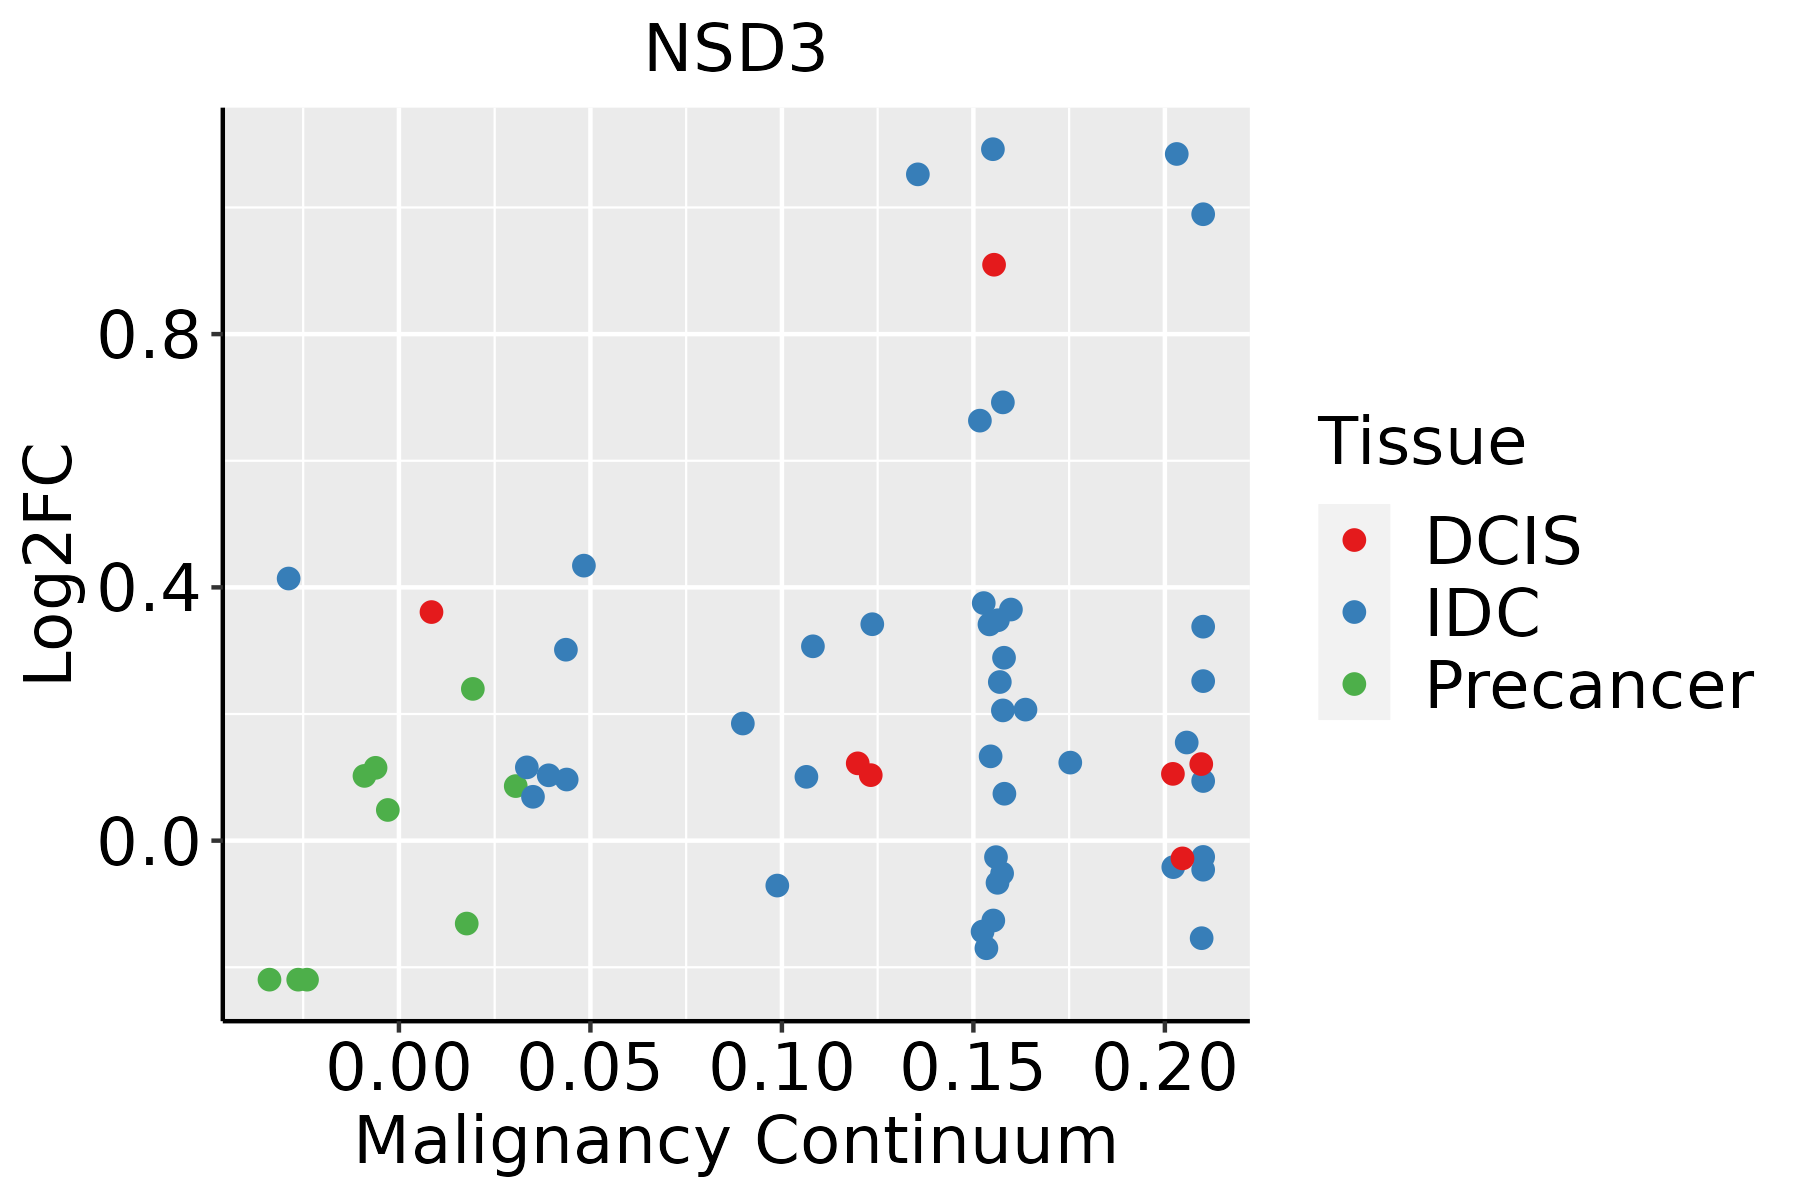 | IDC: Invasive ductal carcinoma |
| DCIS: Ductal carcinoma in situ | ||
| Precancer(BRCA1-mut): Precancerous lesion from BRCA1 mutation carriers | ||
| Cervix |  | CC: Cervix cancer |
| HSIL_HPV: HPV-infected high-grade squamous intraepithelial lesions | ||
| N_HPV: HPV-infected normal cervix | ||
| Colorectum (GSE201348) |  | FAP: Familial adenomatous polyposis |
| CRC: Colorectal cancer | ||
| Colorectum (HTA11) |  | AD: Adenomas |
| SER: Sessile serrated lesions | ||
| MSI-H: Microsatellite-high colorectal cancer | ||
| MSS: Microsatellite stable colorectal cancer | ||
| Endometrium | 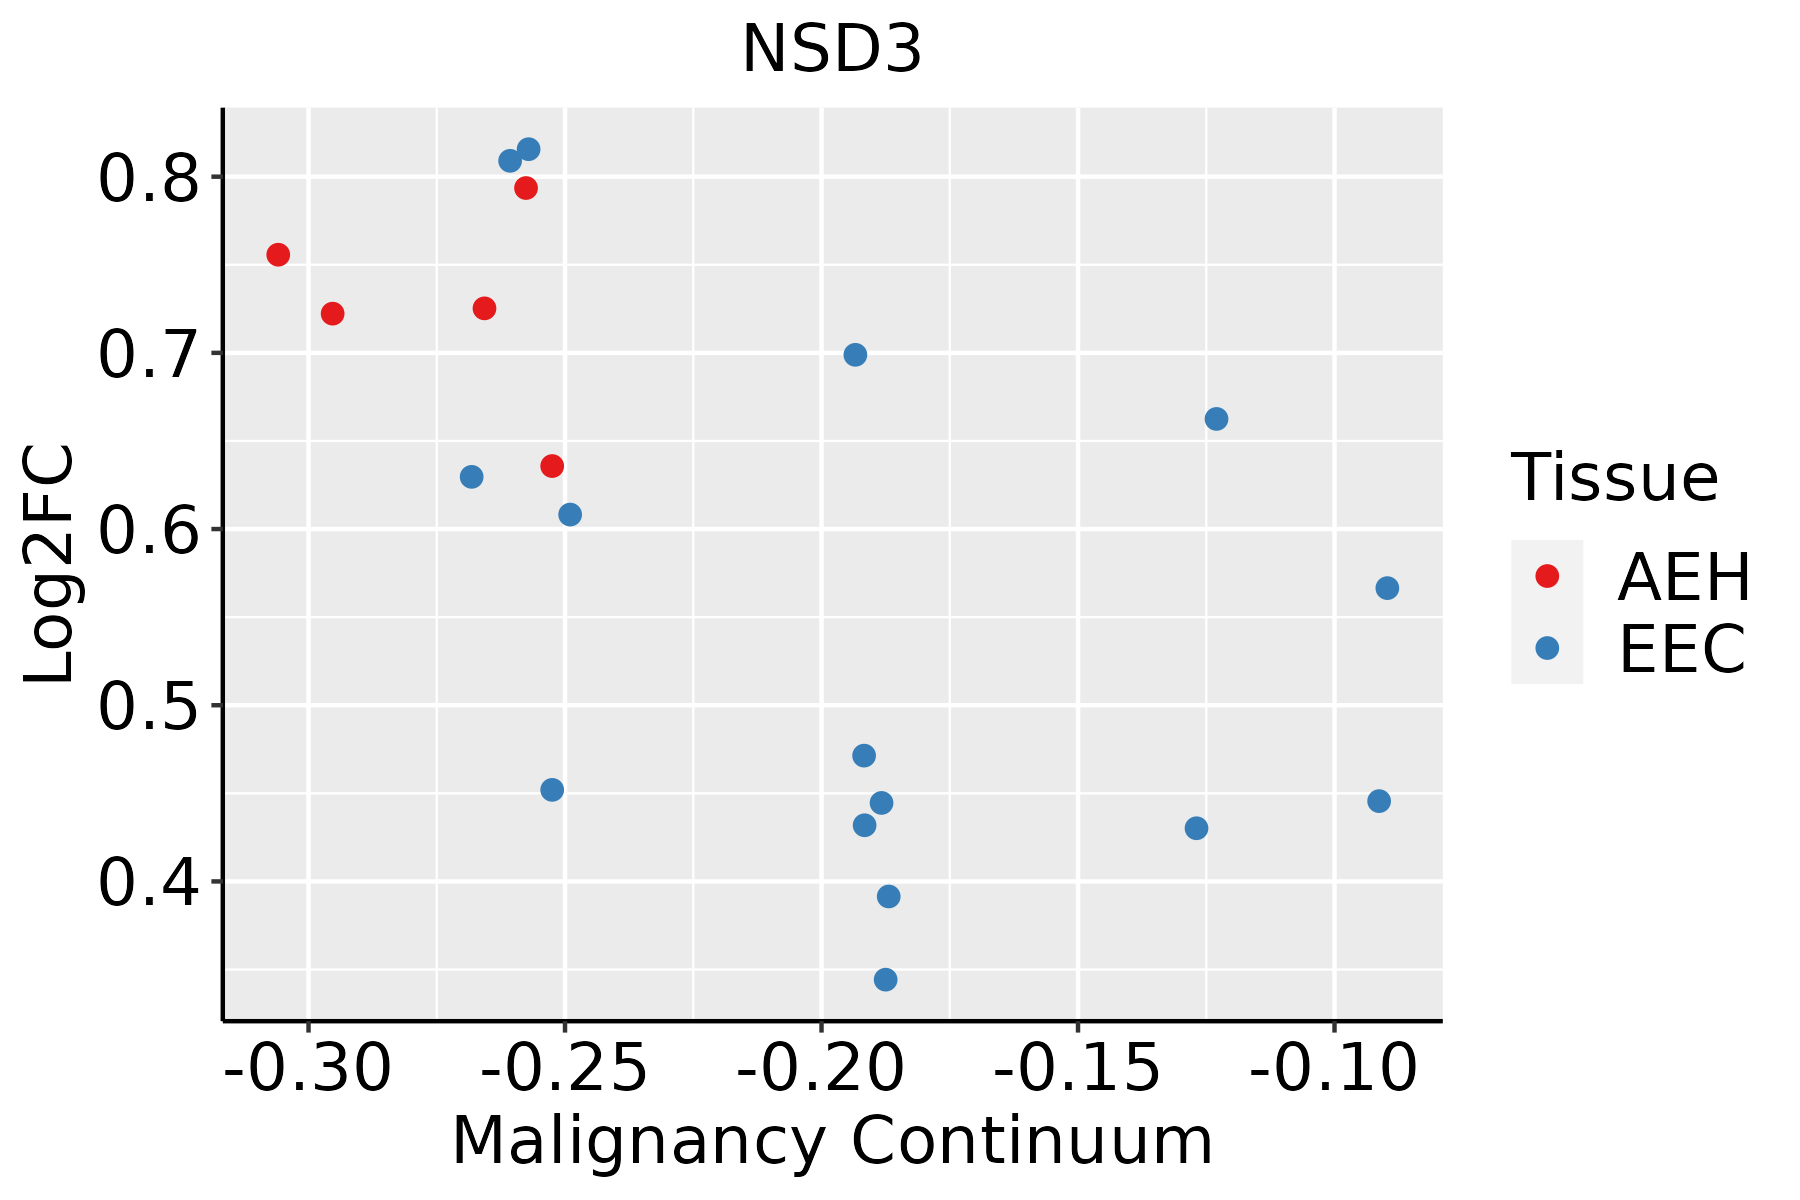 | AEH: Atypical endometrial hyperplasia |
| EEC: Endometrioid Cancer | ||
| Esophagus | 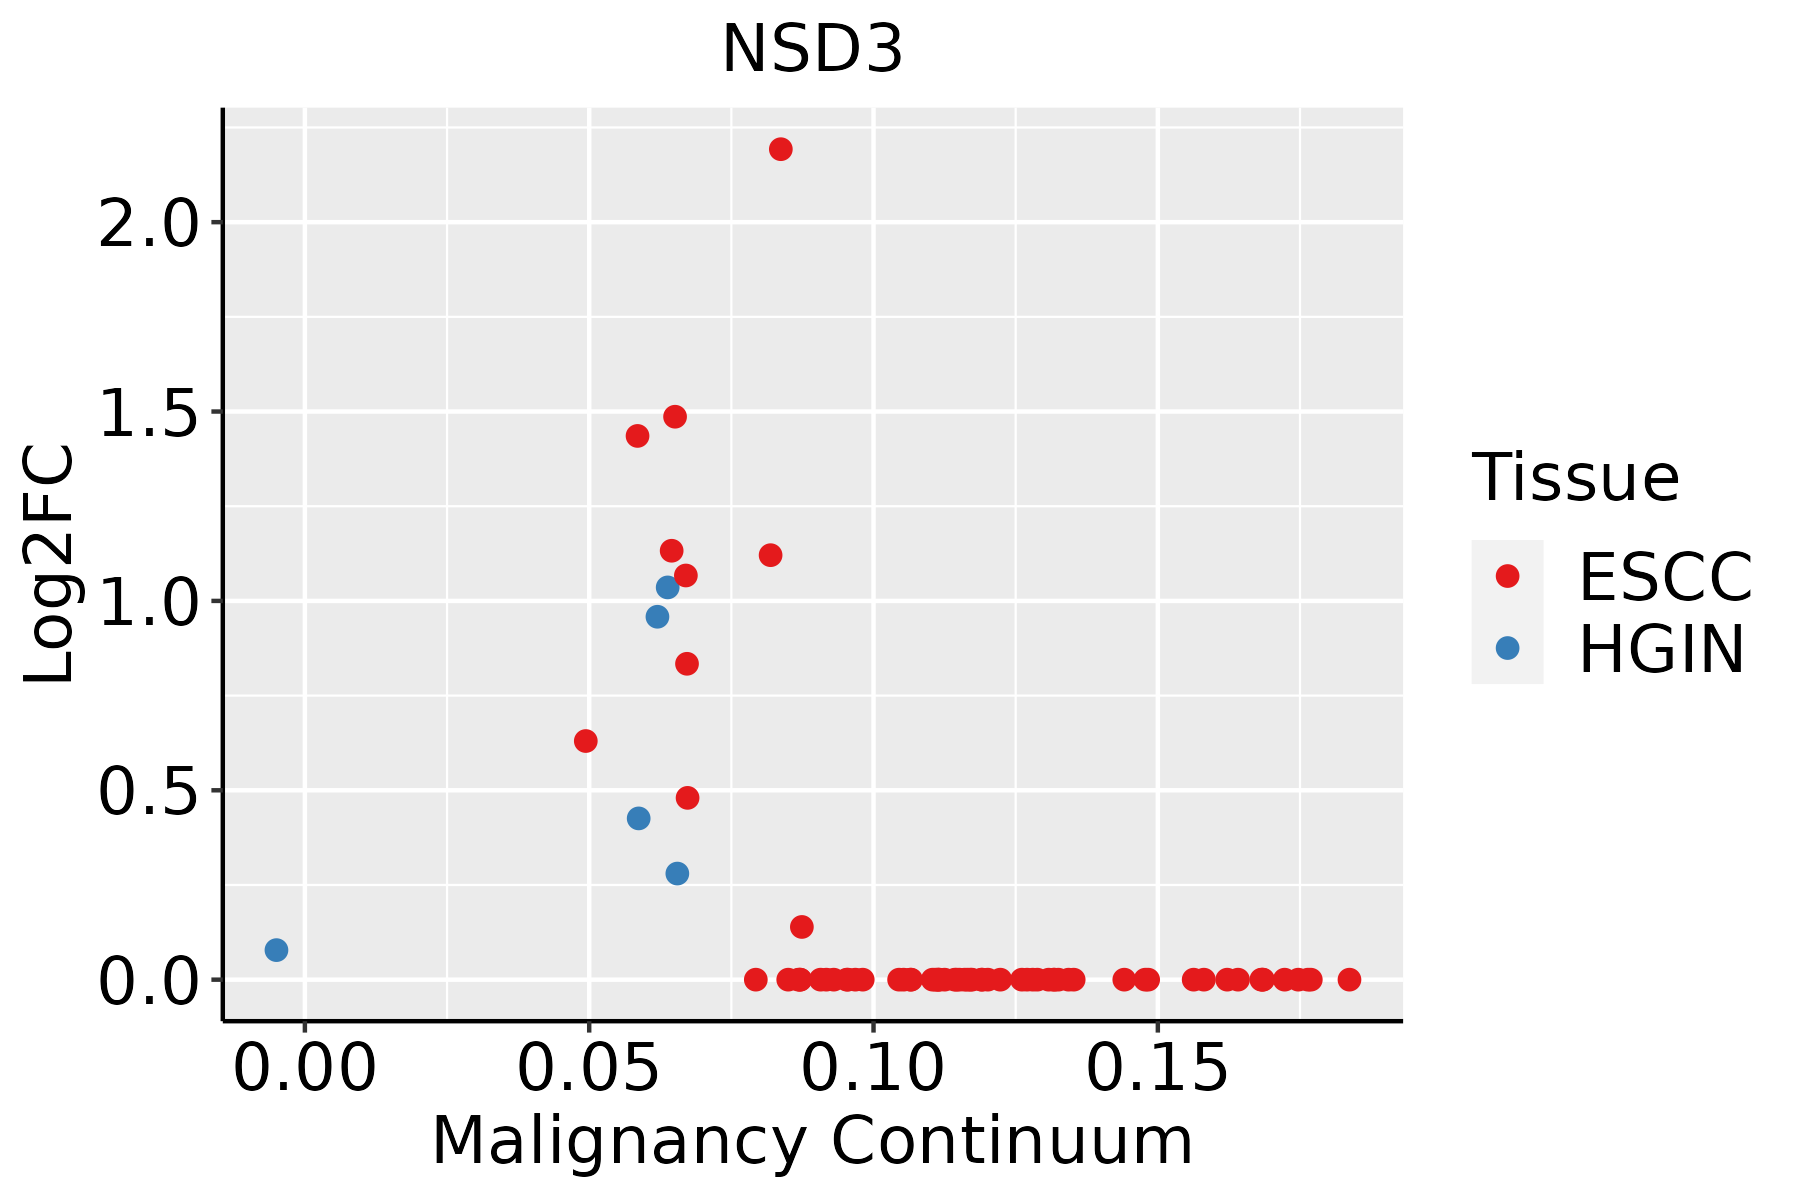 | ESCC: Esophageal squamous cell carcinoma |
| HGIN: High-grade intraepithelial neoplasias | ||
| LGIN: Low-grade intraepithelial neoplasias | ||
| Liver |  | HCC: Hepatocellular carcinoma |
| NAFLD: Non-alcoholic fatty liver disease | ||
| Lung | 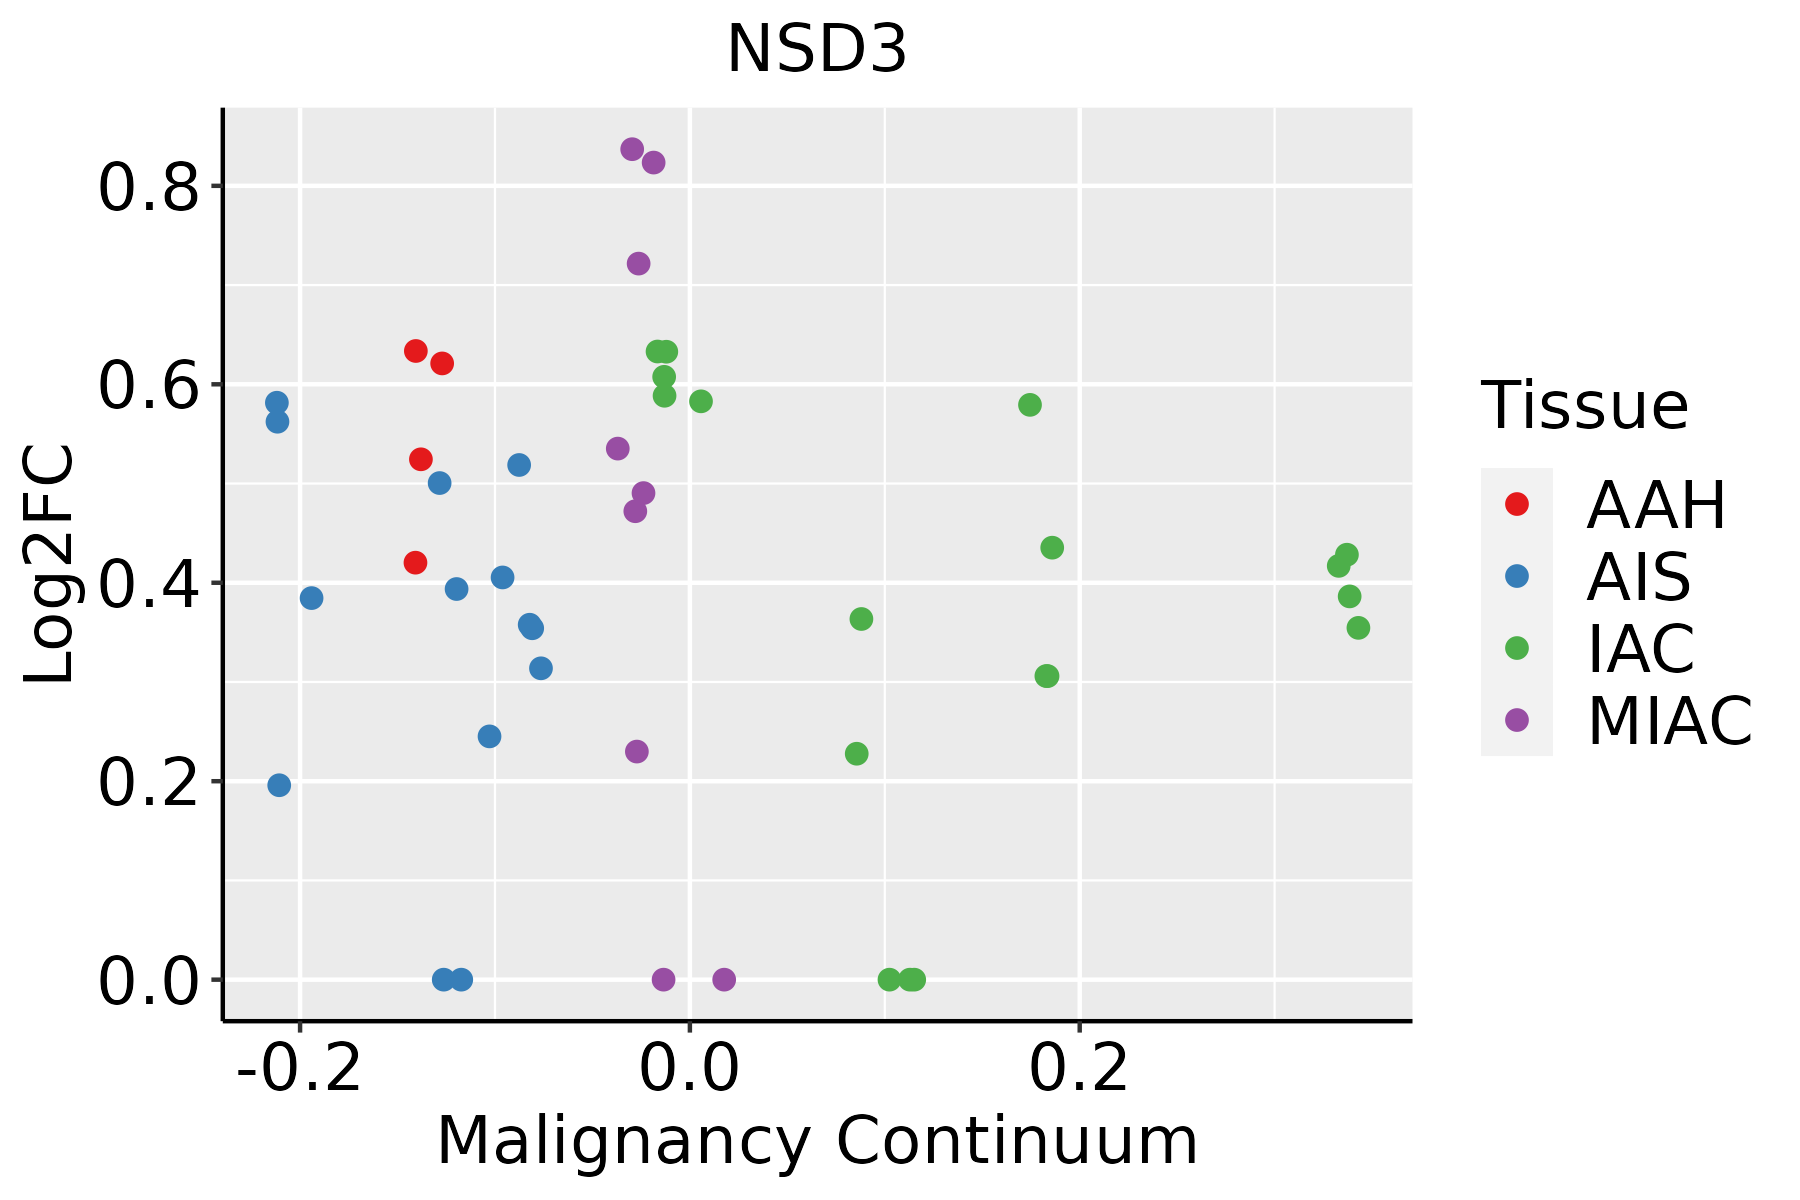 | AAH: Atypical adenomatous hyperplasia |
| AIS: Adenocarcinoma in situ | ||
| IAC: Invasive lung adenocarcinoma | ||
| MIA: Minimally invasive adenocarcinoma | ||
| Prostate | 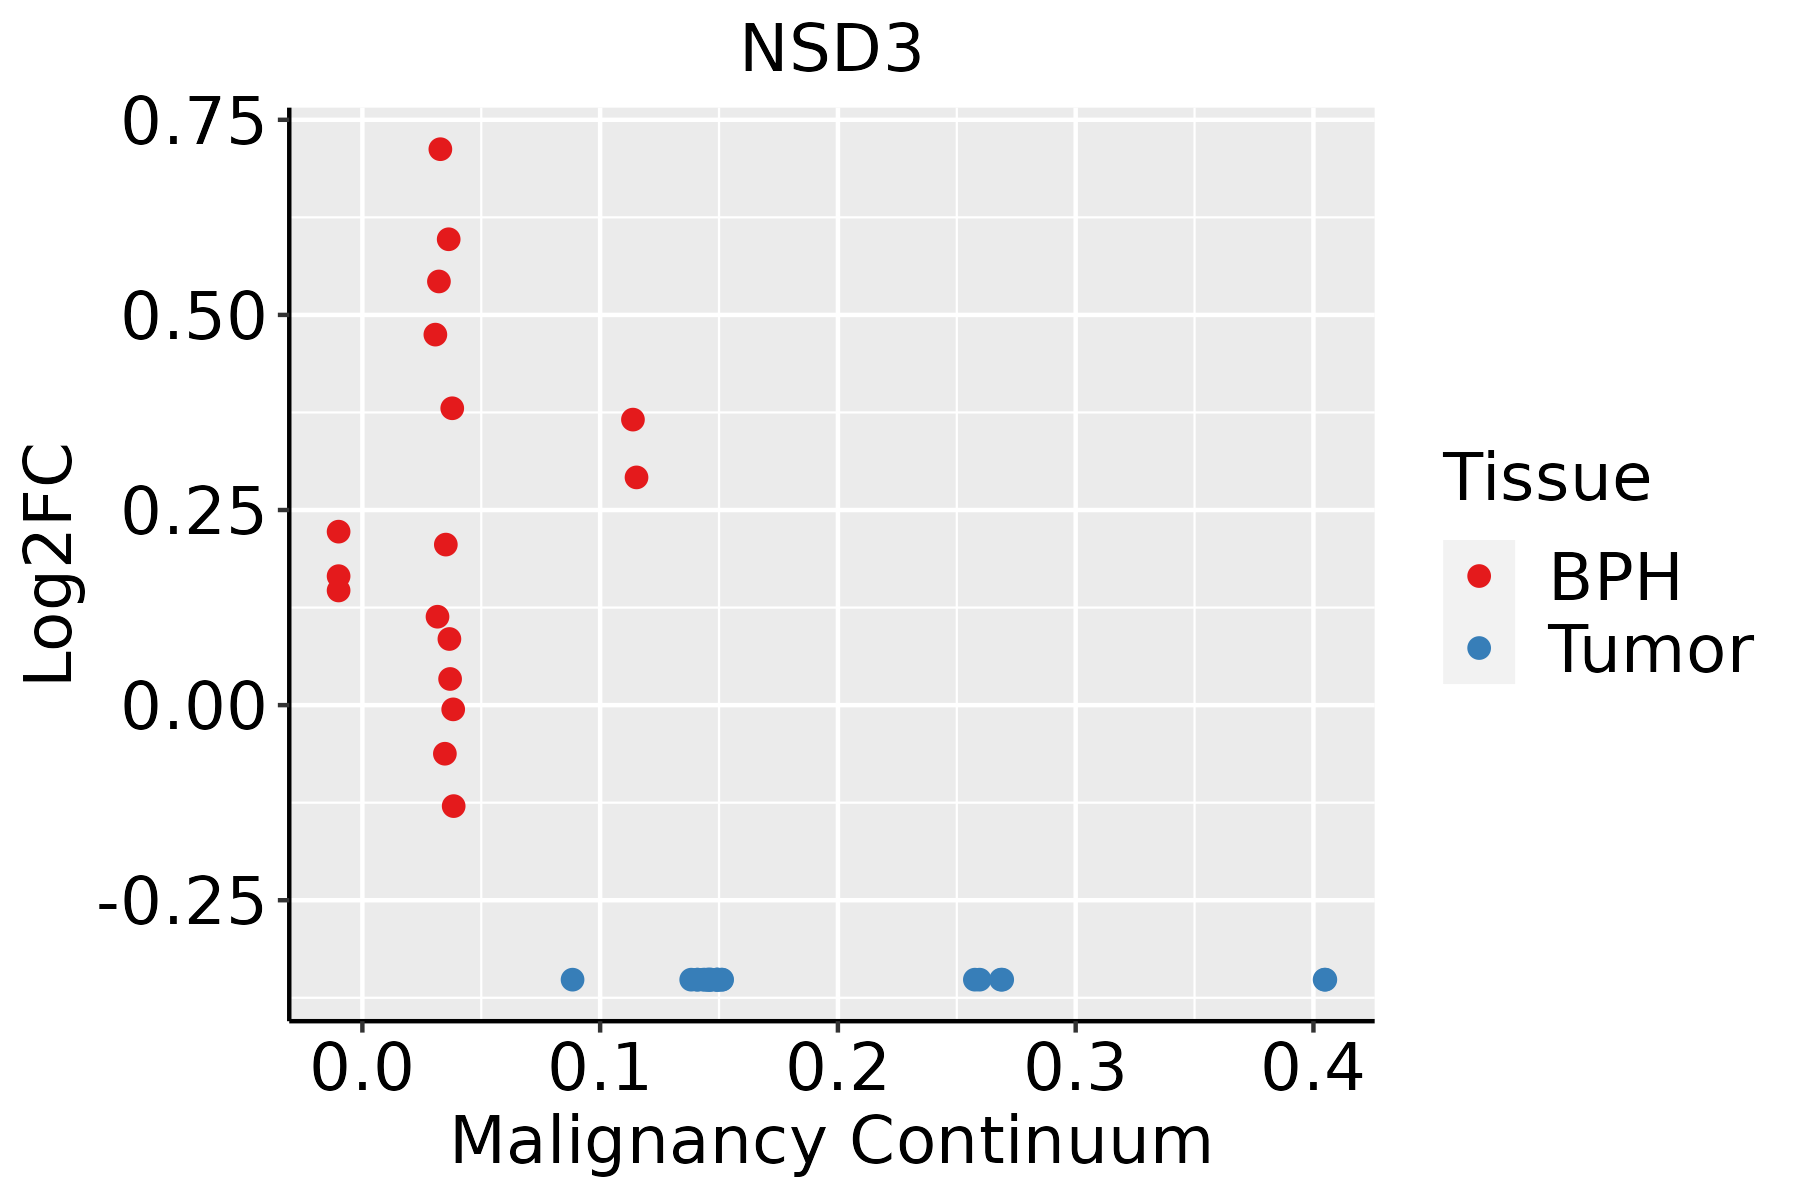 | BPH: Benign Prostatic Hyperplasia |
| Thyroid | 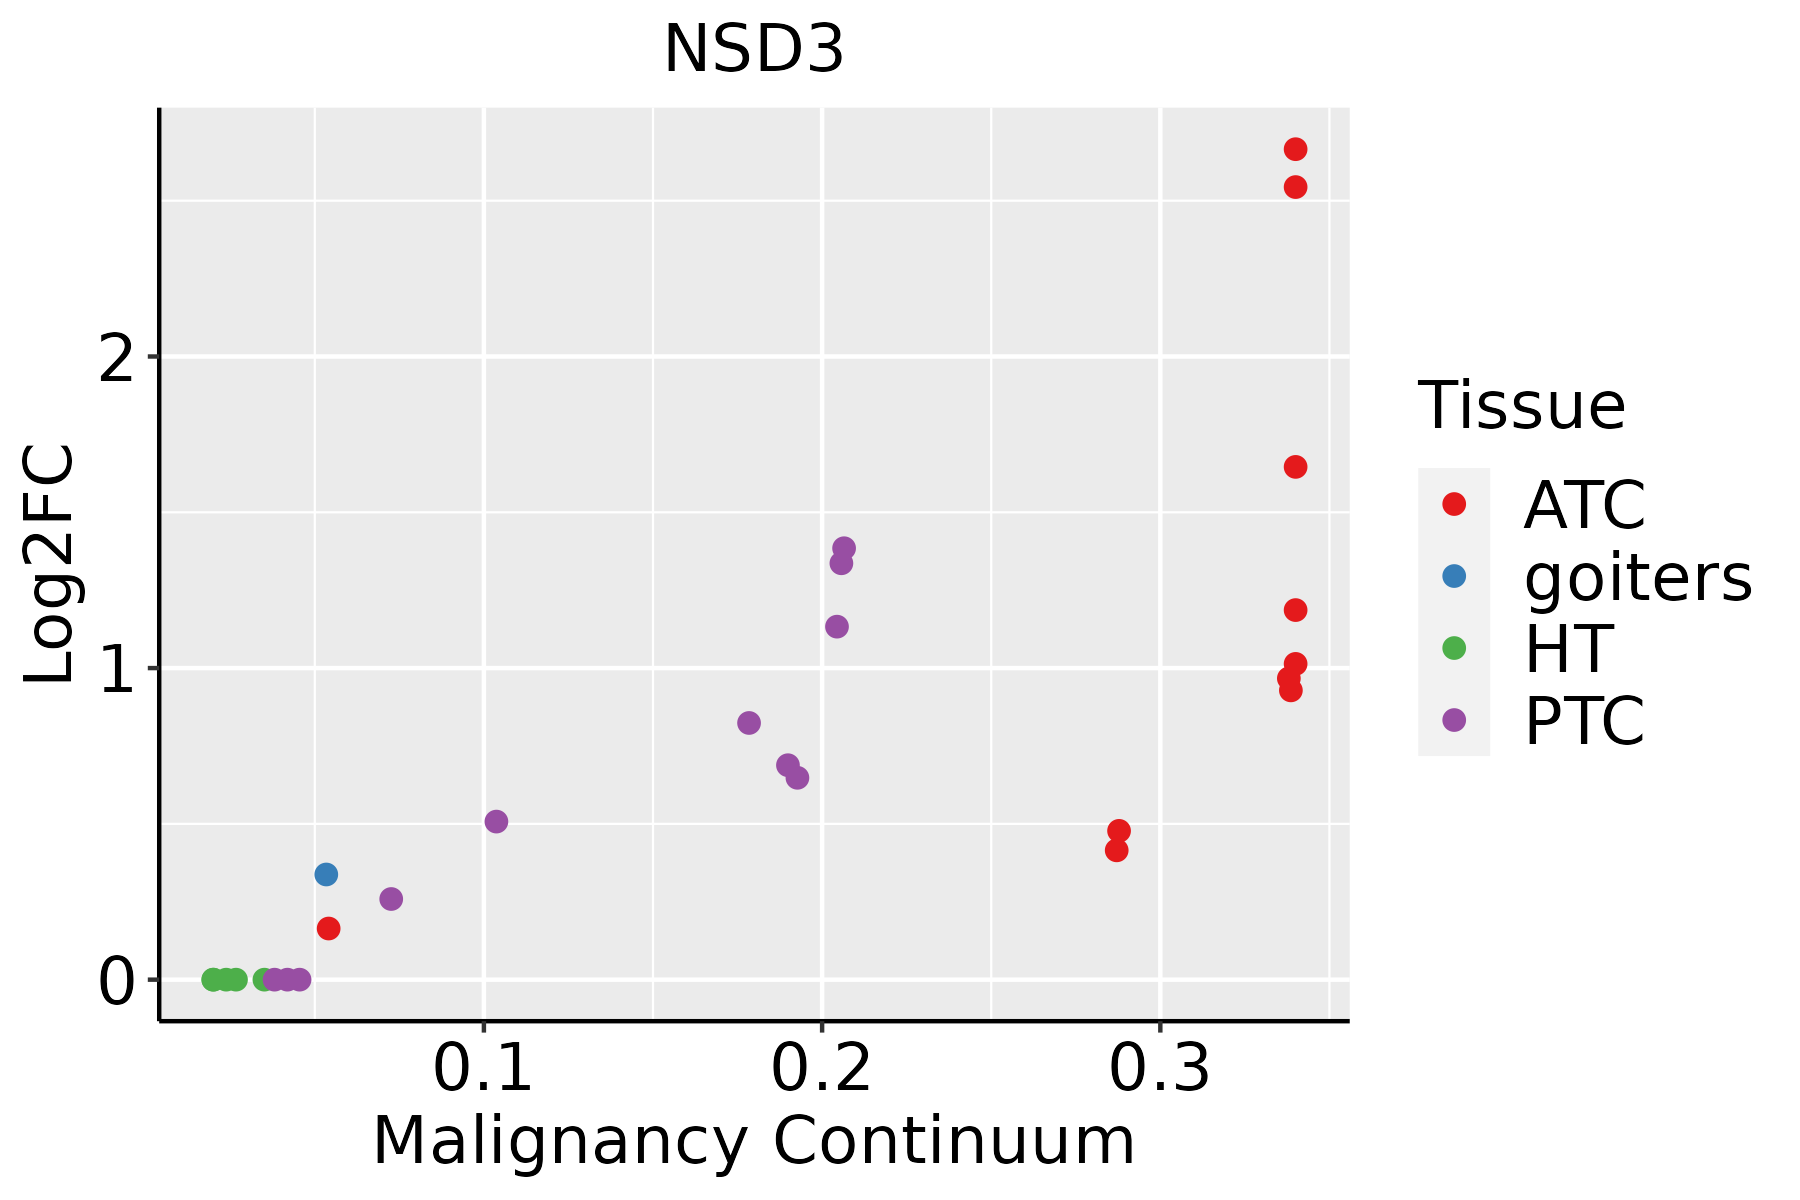 | ATC: Anaplastic thyroid cancer |
| HT: Hashimoto's thyroiditis | ||
| PTC: Papillary thyroid cancer |
| ∗log2FC in expression of this searched gene in stem-like cells from each diseased tissue sample relative to stem-like cells in normal samples in each tissue plotted against the malignancy continuum. Samples are colored based on if they are from different disease stage. |
Top |
Malignant transformation related pathway analysis |
| Find out the enriched GO biological processes and KEGG pathways involved in transition from healthy to precancer to cancer |
| Tissue | Disease Stage | Enriched GO biological Processes |
| Colorectum | AD |  |
| Colorectum | SER |  |
| Colorectum | MSS |  |
| Colorectum | MSI-H |  |
| Colorectum | FAP |  |
| ∗Top 15 enriched GO BP terms are showed in the bar plot of each disease state in each tissue. Each row represents a significant GO biological process which is colored according to the -log10(p.adjust). |
| Page: 1 2 3 4 5 6 7 8 9 |
| GO ID | Tissue | Disease Stage | Description | Gene Ratio | Bg Ratio | pvalue | p.adjust | Count |
| GO:00104525 | Cervix | CC | histone H3-K36 methylation | 8/2311 | 15/18723 | 1.53e-04 | 1.85e-03 | 8 |
| GO:00165705 | Cervix | CC | histone modification | 84/2311 | 463/18723 | 1.70e-04 | 2.01e-03 | 84 |
| GO:00349685 | Cervix | CC | histone lysine methylation | 27/2311 | 115/18723 | 6.61e-04 | 6.09e-03 | 27 |
| GO:00310565 | Cervix | CC | regulation of histone modification | 33/2311 | 152/18723 | 7.97e-04 | 7.00e-03 | 33 |
| GO:00165715 | Cervix | CC | histone methylation | 30/2311 | 141/18723 | 1.88e-03 | 1.39e-02 | 30 |
| GO:00180224 | Cervix | CC | peptidyl-lysine methylation | 28/2311 | 131/18723 | 2.43e-03 | 1.71e-02 | 28 |
| GO:00064795 | Cervix | CC | protein methylation | 36/2311 | 181/18723 | 2.46e-03 | 1.71e-02 | 36 |
| GO:00082135 | Cervix | CC | protein alkylation | 36/2311 | 181/18723 | 2.46e-03 | 1.71e-02 | 36 |
| GO:00182054 | Cervix | CC | peptidyl-lysine modification | 62/2311 | 376/18723 | 1.04e-02 | 4.97e-02 | 62 |
| GO:0010452 | Colorectum | AD | histone H3-K36 methylation | 8/3918 | 15/18723 | 5.67e-03 | 3.64e-02 | 8 |
| GO:0031056 | Colorectum | AD | regulation of histone modification | 45/3918 | 152/18723 | 7.05e-03 | 4.31e-02 | 45 |
| GO:00310561 | Colorectum | SER | regulation of histone modification | 37/2897 | 152/18723 | 2.80e-03 | 2.50e-02 | 37 |
| GO:0016570 | Colorectum | MSS | histone modification | 113/3467 | 463/18723 | 8.37e-04 | 8.68e-03 | 113 |
| GO:00310562 | Colorectum | MSS | regulation of histone modification | 41/3467 | 152/18723 | 6.41e-03 | 4.27e-02 | 41 |
| GO:00165701 | Colorectum | FAP | histone modification | 94/2622 | 463/18723 | 1.06e-04 | 1.76e-03 | 94 |
| GO:00104521 | Colorectum | FAP | histone H3-K36 methylation | 8/2622 | 15/18723 | 3.75e-04 | 4.63e-03 | 8 |
| GO:0006479 | Colorectum | FAP | protein methylation | 39/2622 | 181/18723 | 3.60e-03 | 2.58e-02 | 39 |
| GO:0008213 | Colorectum | FAP | protein alkylation | 39/2622 | 181/18723 | 3.60e-03 | 2.58e-02 | 39 |
| GO:0034968 | Colorectum | FAP | histone lysine methylation | 27/2622 | 115/18723 | 4.23e-03 | 2.90e-02 | 27 |
| GO:0016571 | Colorectum | FAP | histone methylation | 31/2622 | 141/18723 | 6.47e-03 | 4.03e-02 | 31 |
| Page: 1 2 3 4 5 6 7 8 |
| Pathway ID | Tissue | Disease Stage | Description | Gene Ratio | Bg Ratio | pvalue | p.adjust | qvalue | Count |
| hsa00310 | Colorectum | AD | Lysine degradation | 27/2092 | 63/8465 | 1.17e-03 | 7.75e-03 | 4.94e-03 | 27 |
| hsa003101 | Colorectum | AD | Lysine degradation | 27/2092 | 63/8465 | 1.17e-03 | 7.75e-03 | 4.94e-03 | 27 |
| hsa003102 | Colorectum | MSS | Lysine degradation | 24/1875 | 63/8465 | 2.94e-03 | 1.39e-02 | 8.50e-03 | 24 |
| hsa003103 | Colorectum | MSS | Lysine degradation | 24/1875 | 63/8465 | 2.94e-03 | 1.39e-02 | 8.50e-03 | 24 |
| hsa003104 | Colorectum | FAP | Lysine degradation | 23/1404 | 63/8465 | 1.04e-04 | 9.46e-04 | 5.76e-04 | 23 |
| hsa003105 | Colorectum | FAP | Lysine degradation | 23/1404 | 63/8465 | 1.04e-04 | 9.46e-04 | 5.76e-04 | 23 |
| hsa003106 | Colorectum | CRC | Lysine degradation | 18/1091 | 63/8465 | 7.21e-04 | 6.34e-03 | 4.30e-03 | 18 |
| hsa003107 | Colorectum | CRC | Lysine degradation | 18/1091 | 63/8465 | 7.21e-04 | 6.34e-03 | 4.30e-03 | 18 |
| hsa0031010 | Esophagus | ESCC | Lysine degradation | 41/4205 | 63/8465 | 9.63e-03 | 2.27e-02 | 1.16e-02 | 41 |
| hsa0031013 | Esophagus | ESCC | Lysine degradation | 41/4205 | 63/8465 | 9.63e-03 | 2.27e-02 | 1.16e-02 | 41 |
| hsa003108 | Liver | NAFLD | Lysine degradation | 21/1043 | 63/8465 | 1.09e-05 | 3.58e-04 | 2.89e-04 | 21 |
| hsa0031011 | Liver | NAFLD | Lysine degradation | 21/1043 | 63/8465 | 1.09e-05 | 3.58e-04 | 2.89e-04 | 21 |
| hsa0031021 | Liver | Cirrhotic | Lysine degradation | 29/2530 | 63/8465 | 4.81e-03 | 1.74e-02 | 1.07e-02 | 29 |
| hsa0031031 | Liver | Cirrhotic | Lysine degradation | 29/2530 | 63/8465 | 4.81e-03 | 1.74e-02 | 1.07e-02 | 29 |
| hsa0031041 | Liver | HCC | Lysine degradation | 47/4020 | 63/8465 | 1.02e-05 | 7.58e-05 | 4.22e-05 | 47 |
| hsa0031051 | Liver | HCC | Lysine degradation | 47/4020 | 63/8465 | 1.02e-05 | 7.58e-05 | 4.22e-05 | 47 |
| hsa003109 | Lung | IAC | Lysine degradation | 17/1053 | 63/8465 | 1.35e-03 | 8.63e-03 | 5.73e-03 | 17 |
| hsa0031012 | Lung | IAC | Lysine degradation | 17/1053 | 63/8465 | 1.35e-03 | 8.63e-03 | 5.73e-03 | 17 |
| hsa0031022 | Lung | AIS | Lysine degradation | 16/961 | 63/8465 | 1.41e-03 | 9.49e-03 | 6.07e-03 | 16 |
| hsa0031032 | Lung | AIS | Lysine degradation | 16/961 | 63/8465 | 1.41e-03 | 9.49e-03 | 6.07e-03 | 16 |
| Page: 1 2 |
Top |
Cell-cell communication analysis |
| Identification of potential cell-cell interactions between two cell types and their ligand-receptor pairs for different disease states |
| Ligand | Receptor | LRpair | Pathway | Tissue | Disease Stage |
| Page: 1 |
Top |
Single-cell gene regulatory network inference analysis |
| Find out the significant the regulons (TFs) and the target genes of each regulon across cell types for different disease states |
| TF | Cell Type | Tissue | Disease Stage | Target Gene | RSS | Regulon Activity |
| ∗The dot plots of a searched regulon are shown for all cell subpopulations in each disease state of each tissue based on the regulon specific score inferred using pySCENIC and by calculating the average expression. |
| Page: 1 |
Top |
Somatic mutation of malignant transformation related genes |
| Annotation of somatic variants for genes involved in malignant transformation |
| Hugo Symbol | Variant Class | Variant Classification | dbSNP RS | HGVSc | HGVSp | HGVSp Short | SWISSPROT | BIOTYPE | SIFT | PolyPhen | Tumor Sample Barcode | Tissue | Histology | Sex | Age | Stage | Therapy Types | Drugs | Outcome |
| NSD3 | SNV | Missense_Mutation | novel | c.3271N>A | p.Asp1091Asn | p.D1091N | Q9BZ95 | protein_coding | deleterious(0) | probably_damaging(0.991) | TCGA-5L-AAT1-01 | Breast | breast invasive carcinoma | Female | <65 | III/IV | Hormone Therapy | letrozol | SD |
| NSD3 | SNV | Missense_Mutation | c.2126G>C | p.Ser709Thr | p.S709T | Q9BZ95 | protein_coding | tolerated(0.13) | benign(0) | TCGA-A8-A09M-01 | Breast | breast invasive carcinoma | Female | >=65 | III/IV | Chemotherapy | paclitaxel | CR | |
| NSD3 | SNV | Missense_Mutation | c.2042N>T | p.Ser681Phe | p.S681F | Q9BZ95 | protein_coding | deleterious(0.03) | probably_damaging(0.996) | TCGA-AC-A23H-01 | Breast | breast invasive carcinoma | Female | >=65 | I/II | Unknown | Unknown | PD | |
| NSD3 | SNV | Missense_Mutation | rs200818177 | c.3461G>A | p.Arg1154Gln | p.R1154Q | Q9BZ95 | protein_coding | tolerated(0.13) | benign(0.389) | TCGA-AO-A1KS-01 | Breast | breast invasive carcinoma | Female | >=65 | I/II | Hormone Therapy | arimidex | SD |
| NSD3 | SNV | Missense_Mutation | rs199766344 | c.2291N>A | p.Arg764His | p.R764H | Q9BZ95 | protein_coding | deleterious(0) | probably_damaging(0.996) | TCGA-E2-A1II-01 | Breast | breast invasive carcinoma | Female | <65 | I/II | Chemotherapy | doxorubicin | SD |
| NSD3 | SNV | Missense_Mutation | novel | c.1658N>G | p.Glu553Gly | p.E553G | Q9BZ95 | protein_coding | tolerated(0.12) | benign(0.113) | TCGA-S3-AA10-01 | Breast | breast invasive carcinoma | Female | >=65 | I/II | Chemotherapy | cytoxan | CR |
| NSD3 | SNV | Missense_Mutation | c.1926G>T | p.Met642Ile | p.M642I | Q9BZ95 | protein_coding | tolerated(0.4) | benign(0.006) | TCGA-XX-A899-01 | Breast | breast invasive carcinoma | Female | <65 | III/IV | Chemotherapy | cytoxan | CR | |
| NSD3 | insertion | Nonsense_Mutation | novel | c.3049_3050insAATTATAAACACAAAATGTTGAATGTACAATATTTGCTCTTA | p.Phe1017delinsTer | p.F1017delins* | Q9BZ95 | protein_coding | TCGA-BH-A0AY-01 | Breast | breast invasive carcinoma | Female | <65 | I/II | Chemotherapy | SD | |||
| NSD3 | deletion | Frame_Shift_Del | novel | c.3854delN | p.Gly1285GlufsTer21 | p.G1285Efs*21 | Q9BZ95 | protein_coding | TCGA-D8-A27V-01 | Breast | breast invasive carcinoma | Female | <65 | I/II | Hormone Therapy | tamoxiphen | SD | ||
| NSD3 | deletion | Frame_Shift_Del | novel | c.2125delN | p.Ser709AlafsTer6 | p.S709Afs*6 | Q9BZ95 | protein_coding | TCGA-D8-A27V-01 | Breast | breast invasive carcinoma | Female | <65 | I/II | Hormone Therapy | tamoxiphen | SD |
| Page: 1 2 3 4 5 6 7 8 9 10 11 12 13 14 15 16 17 |
Top |
Related drugs of malignant transformation related genes |
| Identification of chemicals and drugs interact with genes involved in malignant transfromation |
| (DGIdb 4.0) |
| Entrez ID | Symbol | Category | Interaction Types | Drug Claim Name | Drug Name | PMIDs |
| Page: 1 |

Copyright 2023-Present -The University of Texas Health Science Center at Houston |