
|
|||||
|
 | |
| |
| |
| |
| |
| |
|
Gene: NSD1 |
Gene summary for NSD1 |
| Gene information | Species | Human | Gene symbol | NSD1 | Gene ID | 64324 |
| Gene name | nuclear receptor binding SET domain protein 1 | |
| Gene Alias | ARA267 | |
| Cytomap | 5q35.3 | |
| Gene Type | protein-coding | GO ID | GO:0000122 | UniProtAcc | Q96L73 |
Top |
Malignant transformation analysis |
| Identification of the aberrant gene expression in precancerous and cancerous lesions by comparing the gene expression of stem-like cells in diseased tissues with normal stem cells |
| Entrez ID | Symbol | Replicates | Species | Organ | Tissue | Adj P-value | Log2FC | Malignancy |
| 64324 | NSD1 | CA_HPV_1 | Human | Cervix | CC | 2.98e-05 | -1.08e-01 | 0.0264 |
| 64324 | NSD1 | CCI_2 | Human | Cervix | CC | 1.24e-10 | 1.15e+00 | 0.5249 |
| 64324 | NSD1 | CCI_3 | Human | Cervix | CC | 6.91e-05 | 6.96e-01 | 0.516 |
| 64324 | NSD1 | L1 | Human | Cervix | CC | 3.19e-02 | -2.09e-01 | 0.0802 |
| 64324 | NSD1 | AEH-subject3 | Human | Endometrium | AEH | 1.52e-02 | -2.18e-03 | -0.2576 |
| 64324 | NSD1 | EEC-subject3 | Human | Endometrium | EEC | 5.76e-06 | -2.31e-01 | -0.2525 |
| 64324 | NSD1 | GSM5276934 | Human | Endometrium | EEC | 1.22e-08 | -2.64e-01 | -0.0913 |
| 64324 | NSD1 | GSM6177620_NYU_UCEC1_lib1_lib1 | Human | Endometrium | EEC | 2.42e-14 | -9.74e-02 | -0.1869 |
| 64324 | NSD1 | GSM6177620_NYU_UCEC1_lib2_lib2 | Human | Endometrium | EEC | 1.01e-19 | -2.52e-01 | -0.1875 |
| 64324 | NSD1 | GSM6177620_NYU_UCEC1_lib3_lib3 | Human | Endometrium | EEC | 1.31e-15 | -2.23e-01 | -0.1883 |
| 64324 | NSD1 | GSM6177621_NYU_UCEC2_lib1_lib1 | Human | Endometrium | EEC | 1.99e-18 | -2.22e-01 | -0.1934 |
| 64324 | NSD1 | GSM6177622_NYU_UCEC3_lib1_lib1 | Human | Endometrium | EEC | 1.18e-30 | -7.64e-02 | -0.1917 |
| 64324 | NSD1 | GSM6177622_NYU_UCEC3_lib2_lib2 | Human | Endometrium | EEC | 1.54e-21 | -1.24e-01 | -0.1916 |
| 64324 | NSD1 | LZE2T | Human | Esophagus | ESCC | 1.92e-05 | 8.87e-01 | 0.082 |
| 64324 | NSD1 | LZE4T | Human | Esophagus | ESCC | 1.93e-09 | 3.37e-01 | 0.0811 |
| 64324 | NSD1 | LZE7T | Human | Esophagus | ESCC | 2.20e-10 | 5.21e-01 | 0.0667 |
| 64324 | NSD1 | LZE8T | Human | Esophagus | ESCC | 1.64e-05 | 1.57e-01 | 0.067 |
| 64324 | NSD1 | LZE20T | Human | Esophagus | ESCC | 4.91e-05 | 3.08e-01 | 0.0662 |
| 64324 | NSD1 | LZE24T | Human | Esophagus | ESCC | 8.67e-15 | 4.01e-01 | 0.0596 |
| 64324 | NSD1 | LZE21T | Human | Esophagus | ESCC | 6.38e-03 | 2.11e-01 | 0.0655 |
| Page: 1 2 3 4 5 6 7 8 9 |
| Tissue | Expression Dynamics | Abbreviation |
| Cervix |  | CC: Cervix cancer |
| HSIL_HPV: HPV-infected high-grade squamous intraepithelial lesions | ||
| N_HPV: HPV-infected normal cervix | ||
| Endometrium |  | AEH: Atypical endometrial hyperplasia |
| EEC: Endometrioid Cancer | ||
| Esophagus | 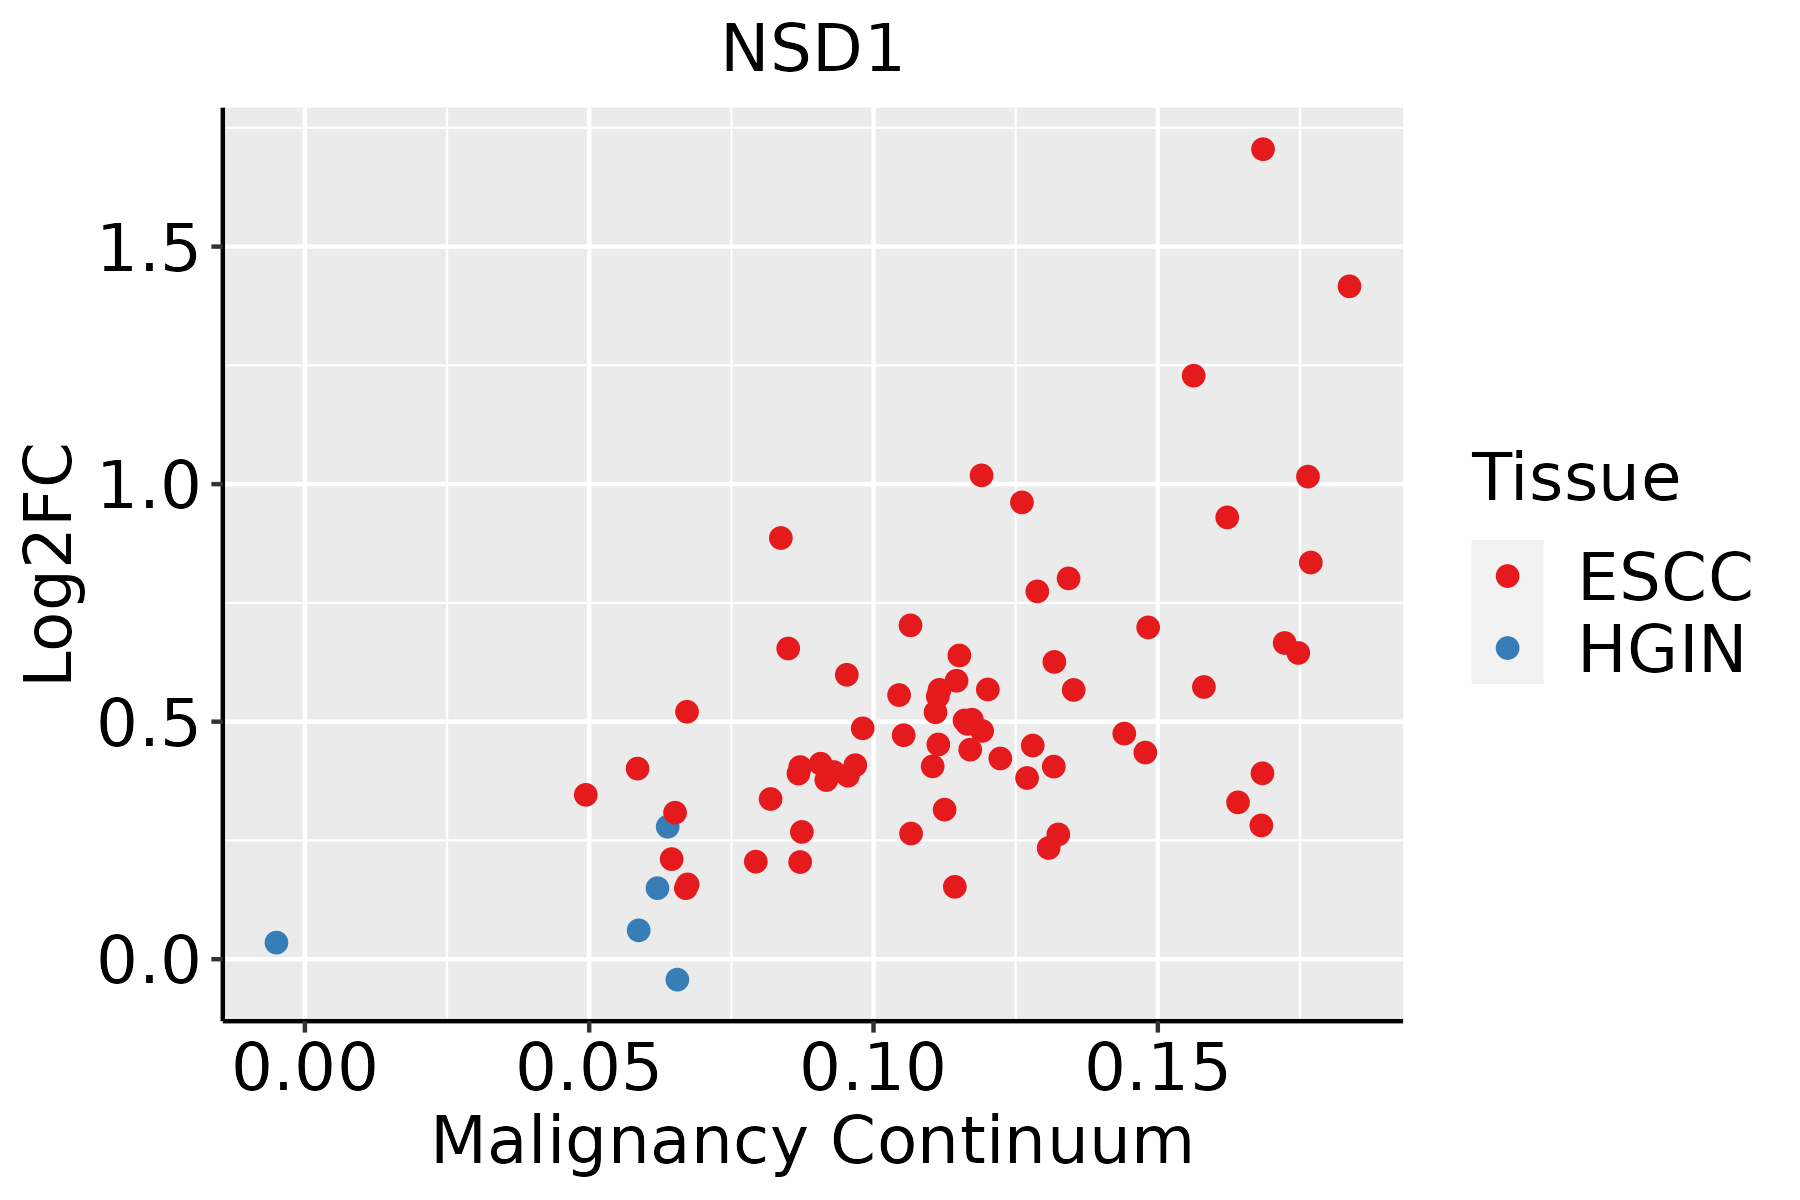 | ESCC: Esophageal squamous cell carcinoma |
| HGIN: High-grade intraepithelial neoplasias | ||
| LGIN: Low-grade intraepithelial neoplasias | ||
| Liver | 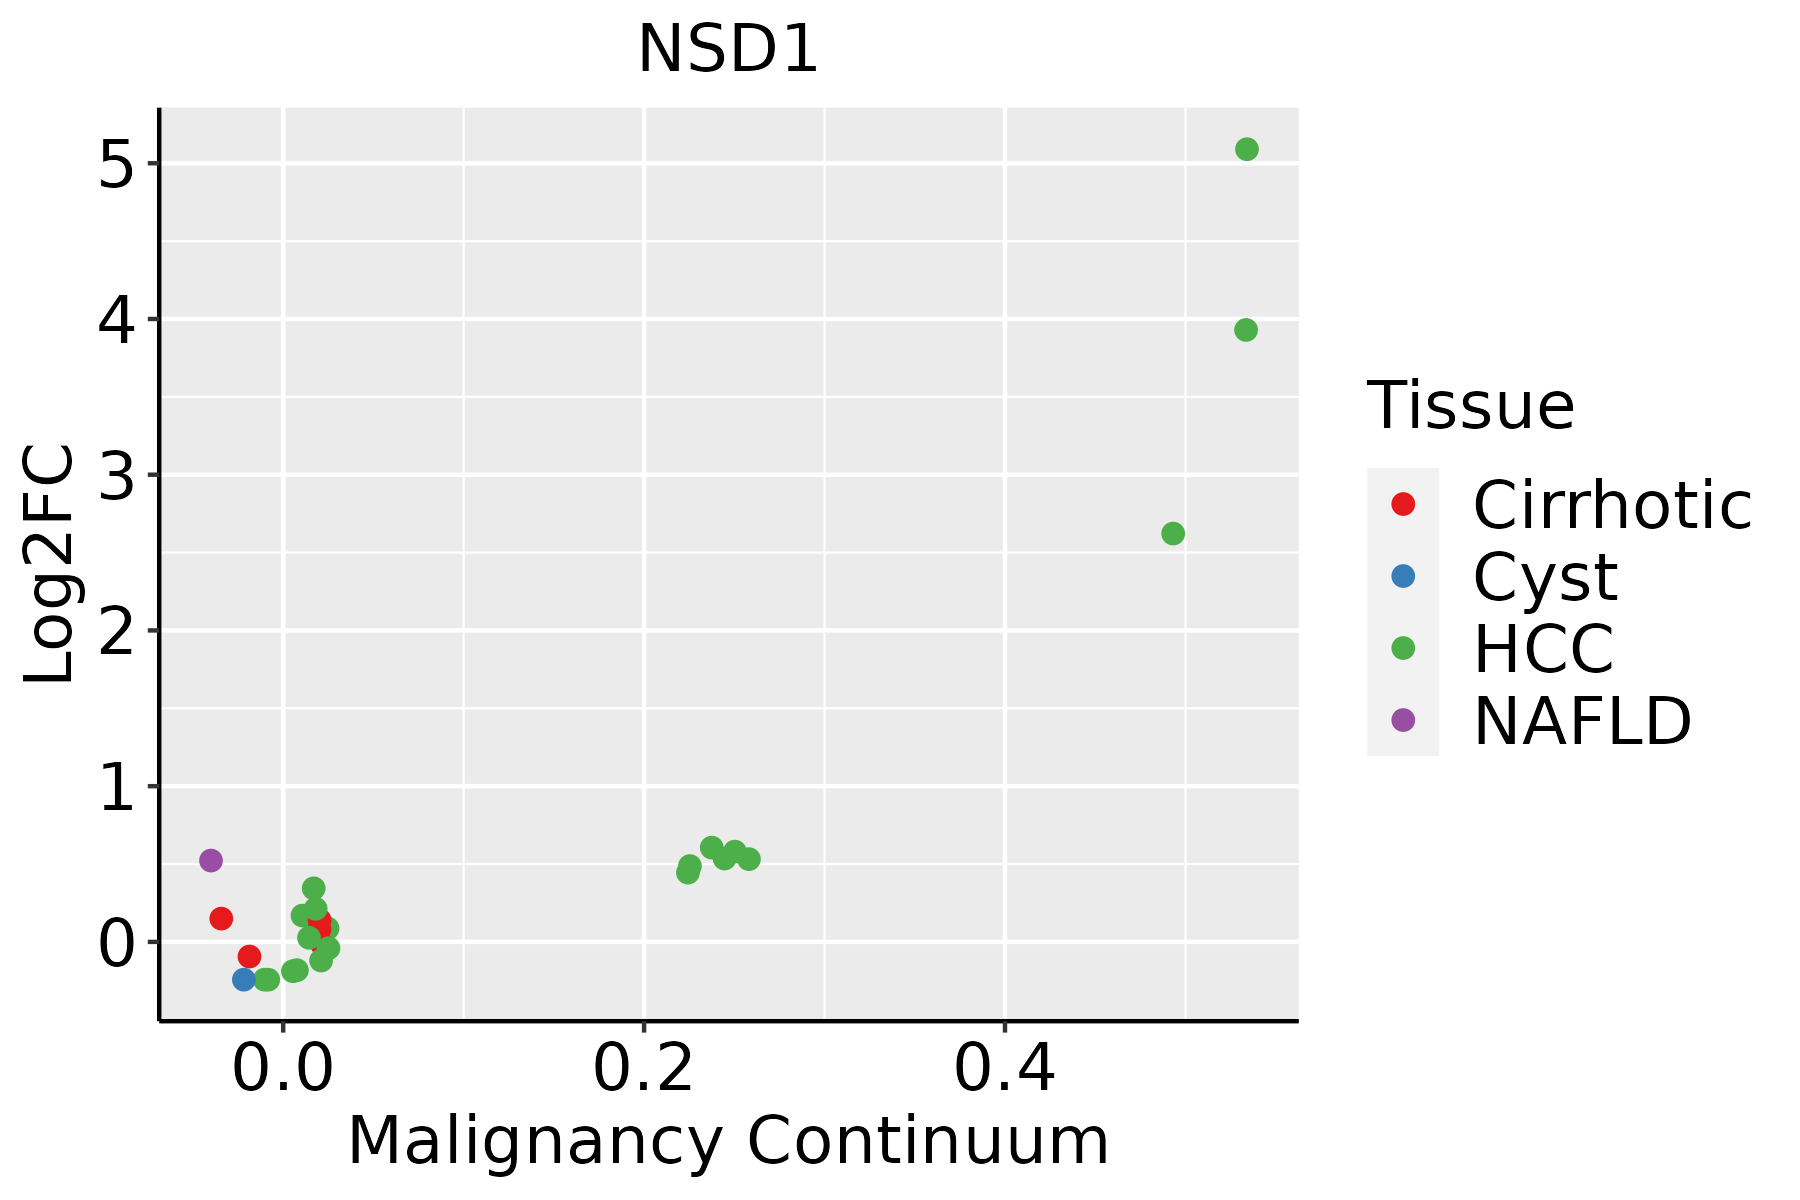 | HCC: Hepatocellular carcinoma |
| NAFLD: Non-alcoholic fatty liver disease | ||
| Lung | 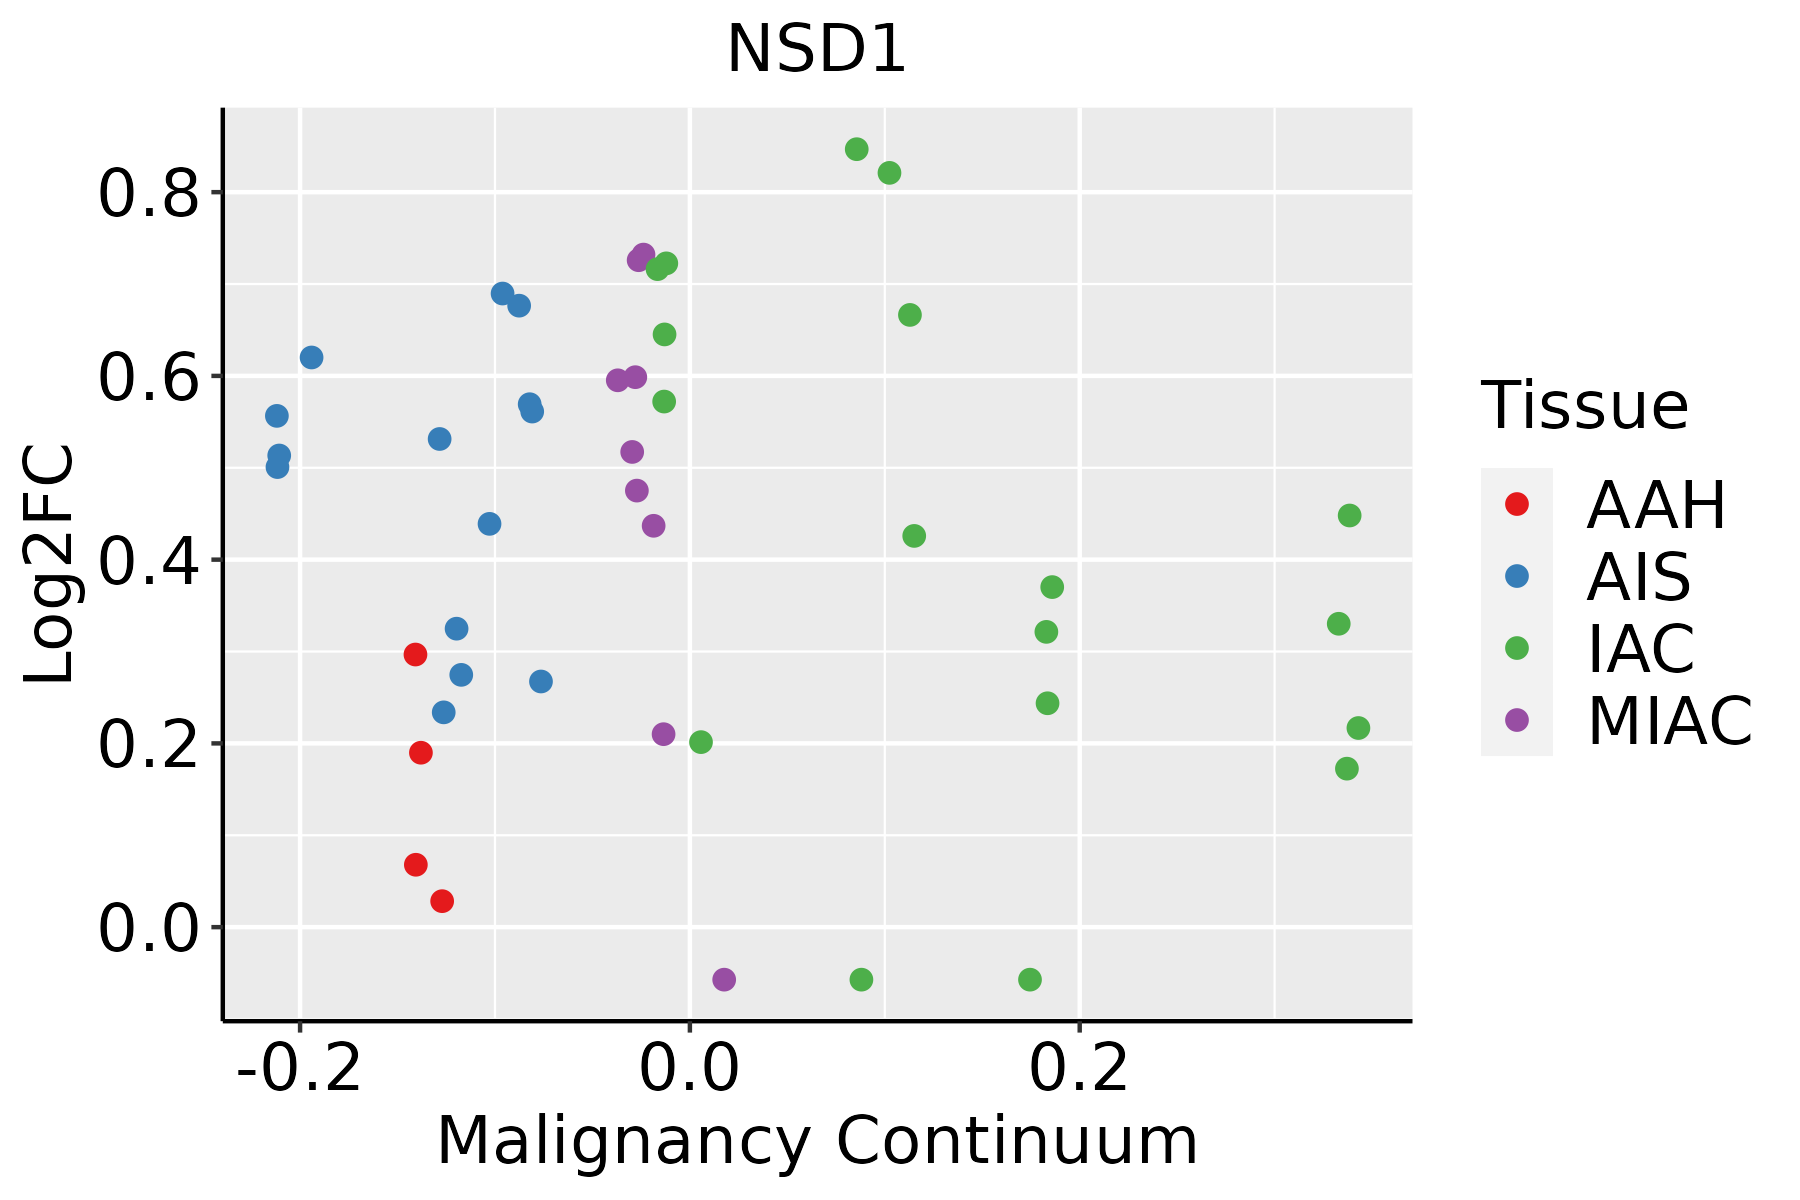 | AAH: Atypical adenomatous hyperplasia |
| AIS: Adenocarcinoma in situ | ||
| IAC: Invasive lung adenocarcinoma | ||
| MIA: Minimally invasive adenocarcinoma | ||
| Oral Cavity | 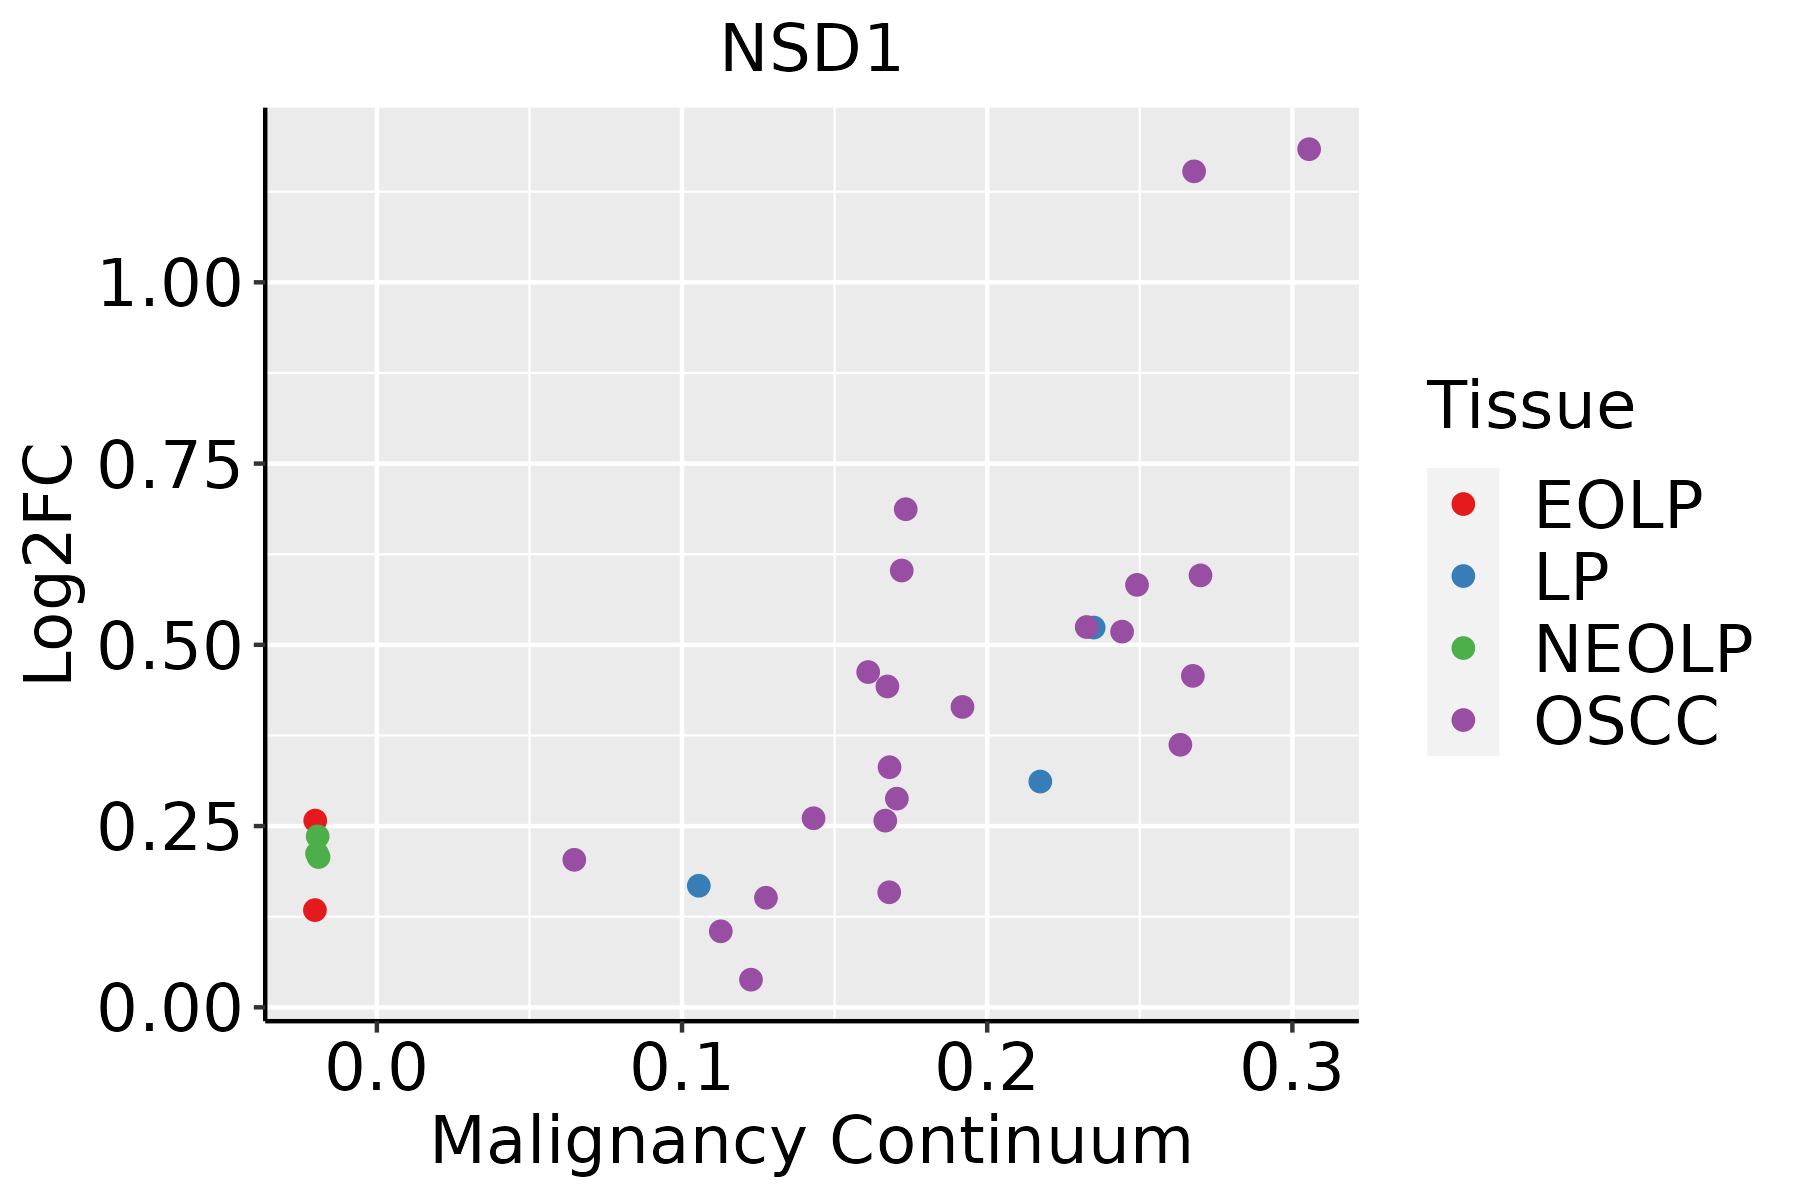 | EOLP: Erosive Oral lichen planus |
| LP: leukoplakia | ||
| NEOLP: Non-erosive oral lichen planus | ||
| OSCC: Oral squamous cell carcinoma | ||
| Prostate | 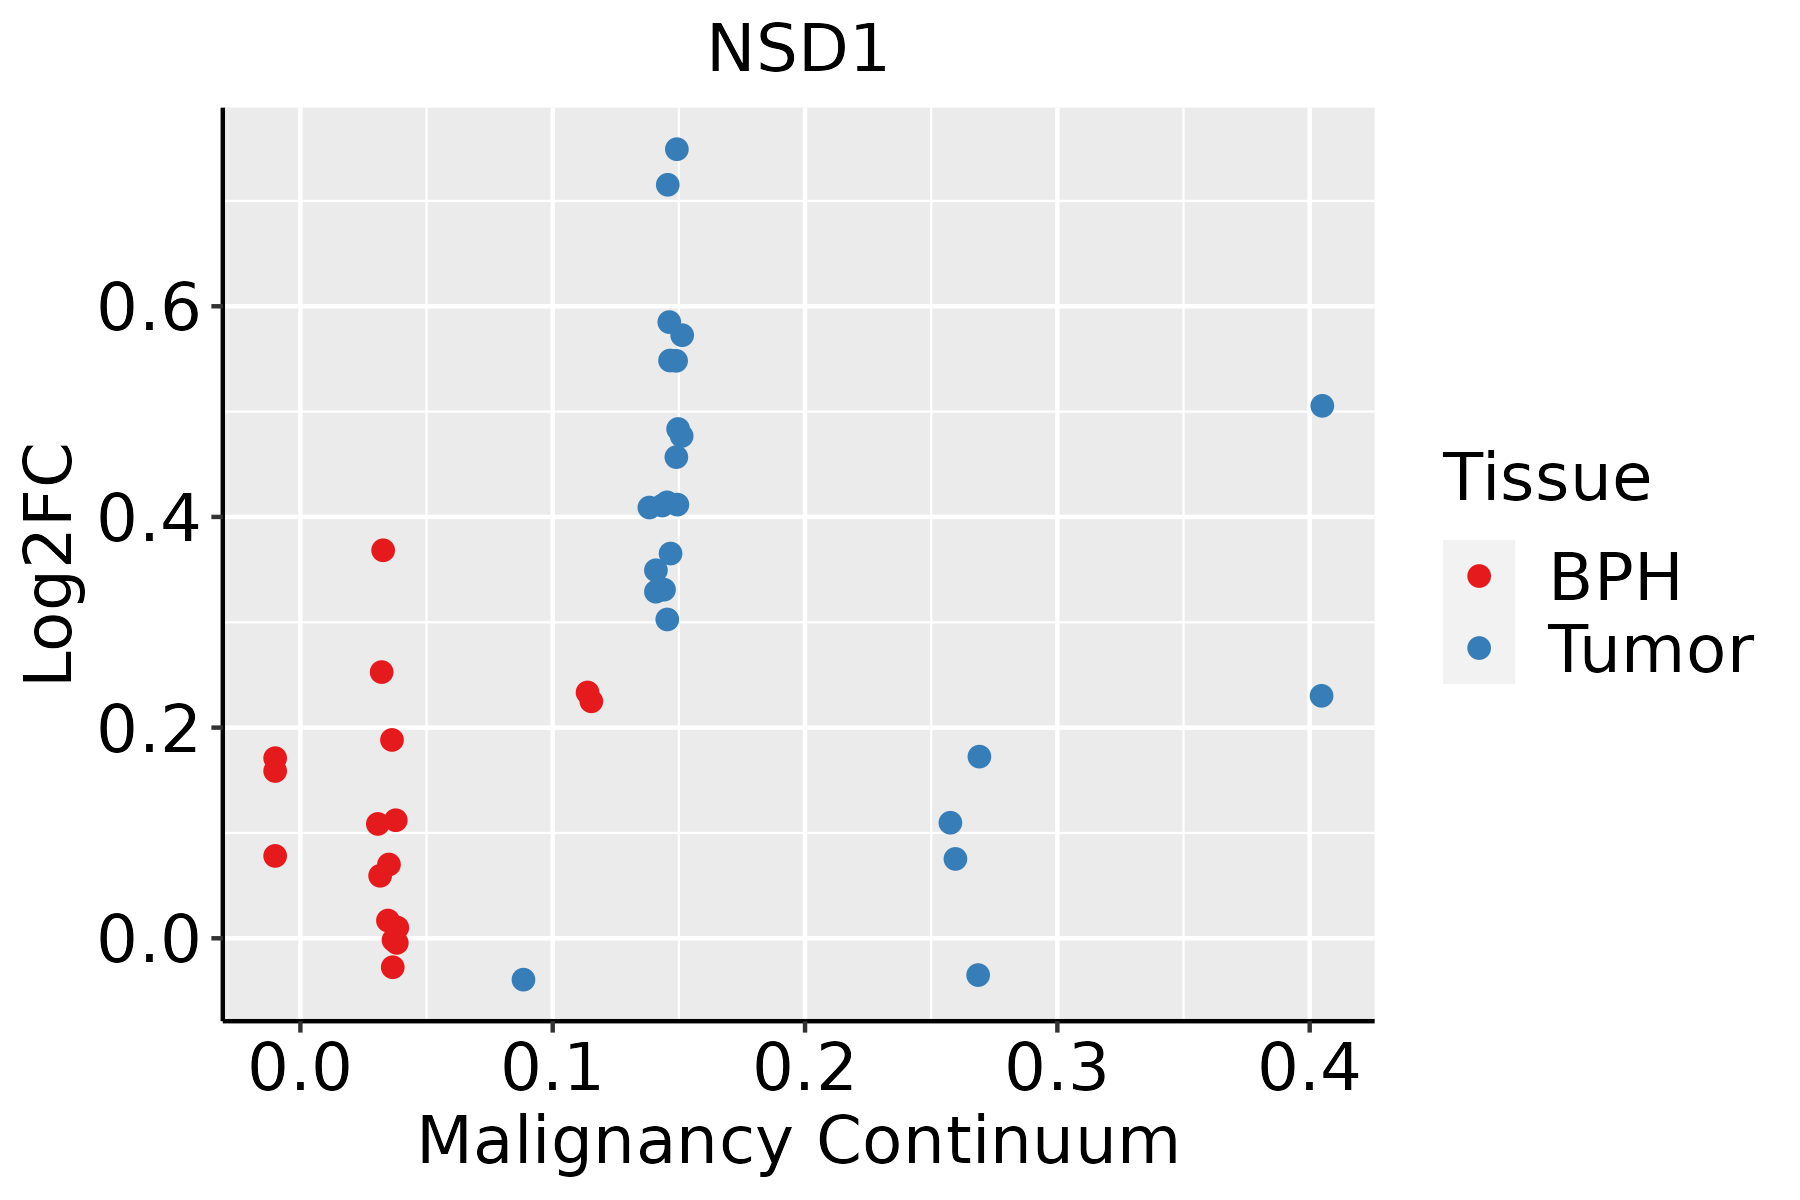 | BPH: Benign Prostatic Hyperplasia |
| Skin |  | AK: Actinic keratosis |
| cSCC: Cutaneous squamous cell carcinoma | ||
| SCCIS:squamous cell carcinoma in situ | ||
| Thyroid |  | ATC: Anaplastic thyroid cancer |
| HT: Hashimoto's thyroiditis | ||
| PTC: Papillary thyroid cancer |
| ∗log2FC in expression of this searched gene in stem-like cells from each diseased tissue sample relative to stem-like cells in normal samples in each tissue plotted against the malignancy continuum. Samples are colored based on if they are from different disease stage. |
Top |
Malignant transformation related pathway analysis |
| Find out the enriched GO biological processes and KEGG pathways involved in transition from healthy to precancer to cancer |
| Tissue | Disease Stage | Enriched GO biological Processes |
| Colorectum | AD |  |
| Colorectum | SER |  |
| Colorectum | MSS |  |
| Colorectum | MSI-H |  |
| Colorectum | FAP |  |
| ∗Top 15 enriched GO BP terms are showed in the bar plot of each disease state in each tissue. Each row represents a significant GO biological process which is colored according to the -log10(p.adjust). |
| Page: 1 2 3 4 5 6 7 8 9 |
| GO ID | Tissue | Disease Stage | Description | Gene Ratio | Bg Ratio | pvalue | p.adjust | Count |
| GO:005109810 | Cervix | CC | regulation of binding | 80/2311 | 363/18723 | 1.32e-07 | 6.42e-06 | 80 |
| GO:005110110 | Cervix | CC | regulation of DNA binding | 31/2311 | 118/18723 | 2.91e-05 | 4.81e-04 | 31 |
| GO:00181057 | Cervix | CC | peptidyl-serine phosphorylation | 63/2311 | 315/18723 | 6.65e-05 | 9.47e-04 | 63 |
| GO:00182096 | Cervix | CC | peptidyl-serine modification | 66/2311 | 338/18723 | 9.58e-05 | 1.25e-03 | 66 |
| GO:00104525 | Cervix | CC | histone H3-K36 methylation | 8/2311 | 15/18723 | 1.53e-04 | 1.85e-03 | 8 |
| GO:00165705 | Cervix | CC | histone modification | 84/2311 | 463/18723 | 1.70e-04 | 2.01e-03 | 84 |
| GO:00349685 | Cervix | CC | histone lysine methylation | 27/2311 | 115/18723 | 6.61e-04 | 6.09e-03 | 27 |
| GO:00310565 | Cervix | CC | regulation of histone modification | 33/2311 | 152/18723 | 7.97e-04 | 7.00e-03 | 33 |
| GO:00165715 | Cervix | CC | histone methylation | 30/2311 | 141/18723 | 1.88e-03 | 1.39e-02 | 30 |
| GO:00180224 | Cervix | CC | peptidyl-lysine methylation | 28/2311 | 131/18723 | 2.43e-03 | 1.71e-02 | 28 |
| GO:00064795 | Cervix | CC | protein methylation | 36/2311 | 181/18723 | 2.46e-03 | 1.71e-02 | 36 |
| GO:00082135 | Cervix | CC | protein alkylation | 36/2311 | 181/18723 | 2.46e-03 | 1.71e-02 | 36 |
| GO:00331353 | Cervix | CC | regulation of peptidyl-serine phosphorylation | 29/2311 | 144/18723 | 5.10e-03 | 3.01e-02 | 29 |
| GO:00182054 | Cervix | CC | peptidyl-lysine modification | 62/2311 | 376/18723 | 1.04e-02 | 4.97e-02 | 62 |
| GO:005109816 | Endometrium | AEH | regulation of binding | 77/2100 | 363/18723 | 2.21e-08 | 1.31e-06 | 77 |
| GO:005110116 | Endometrium | AEH | regulation of DNA binding | 28/2100 | 118/18723 | 8.80e-05 | 1.29e-03 | 28 |
| GO:00181058 | Endometrium | AEH | peptidyl-serine phosphorylation | 50/2100 | 315/18723 | 7.20e-03 | 4.13e-02 | 50 |
| GO:005109817 | Endometrium | EEC | regulation of binding | 83/2168 | 363/18723 | 6.72e-10 | 6.61e-08 | 83 |
| GO:005110117 | Endometrium | EEC | regulation of DNA binding | 31/2168 | 118/18723 | 8.11e-06 | 1.81e-04 | 31 |
| GO:001657015 | Esophagus | ESCC | histone modification | 323/8552 | 463/18723 | 2.61e-26 | 7.88e-24 | 323 |
| Page: 1 2 3 4 5 6 7 8 9 10 11 12 13 14 |
| Pathway ID | Tissue | Disease Stage | Description | Gene Ratio | Bg Ratio | pvalue | p.adjust | qvalue | Count |
| hsa0031010 | Esophagus | ESCC | Lysine degradation | 41/4205 | 63/8465 | 9.63e-03 | 2.27e-02 | 1.16e-02 | 41 |
| hsa0031013 | Esophagus | ESCC | Lysine degradation | 41/4205 | 63/8465 | 9.63e-03 | 2.27e-02 | 1.16e-02 | 41 |
| hsa003108 | Liver | NAFLD | Lysine degradation | 21/1043 | 63/8465 | 1.09e-05 | 3.58e-04 | 2.89e-04 | 21 |
| hsa0031011 | Liver | NAFLD | Lysine degradation | 21/1043 | 63/8465 | 1.09e-05 | 3.58e-04 | 2.89e-04 | 21 |
| hsa0031021 | Liver | Cirrhotic | Lysine degradation | 29/2530 | 63/8465 | 4.81e-03 | 1.74e-02 | 1.07e-02 | 29 |
| hsa0031031 | Liver | Cirrhotic | Lysine degradation | 29/2530 | 63/8465 | 4.81e-03 | 1.74e-02 | 1.07e-02 | 29 |
| hsa0031041 | Liver | HCC | Lysine degradation | 47/4020 | 63/8465 | 1.02e-05 | 7.58e-05 | 4.22e-05 | 47 |
| hsa0031051 | Liver | HCC | Lysine degradation | 47/4020 | 63/8465 | 1.02e-05 | 7.58e-05 | 4.22e-05 | 47 |
| hsa003109 | Lung | IAC | Lysine degradation | 17/1053 | 63/8465 | 1.35e-03 | 8.63e-03 | 5.73e-03 | 17 |
| hsa0031012 | Lung | IAC | Lysine degradation | 17/1053 | 63/8465 | 1.35e-03 | 8.63e-03 | 5.73e-03 | 17 |
| hsa0031022 | Lung | AIS | Lysine degradation | 16/961 | 63/8465 | 1.41e-03 | 9.49e-03 | 6.07e-03 | 16 |
| hsa0031032 | Lung | AIS | Lysine degradation | 16/961 | 63/8465 | 1.41e-03 | 9.49e-03 | 6.07e-03 | 16 |
| hsa0031042 | Lung | MIAC | Lysine degradation | 10/507 | 63/8465 | 3.93e-03 | 3.18e-02 | 2.30e-02 | 10 |
| hsa0031052 | Lung | MIAC | Lysine degradation | 10/507 | 63/8465 | 3.93e-03 | 3.18e-02 | 2.30e-02 | 10 |
| Page: 1 |
Top |
Cell-cell communication analysis |
| Identification of potential cell-cell interactions between two cell types and their ligand-receptor pairs for different disease states |
| Ligand | Receptor | LRpair | Pathway | Tissue | Disease Stage |
| Page: 1 |
Top |
Single-cell gene regulatory network inference analysis |
| Find out the significant the regulons (TFs) and the target genes of each regulon across cell types for different disease states |
| TF | Cell Type | Tissue | Disease Stage | Target Gene | RSS | Regulon Activity |
| ∗The dot plots of a searched regulon are shown for all cell subpopulations in each disease state of each tissue based on the regulon specific score inferred using pySCENIC and by calculating the average expression. |
| Page: 1 |
Top |
Somatic mutation of malignant transformation related genes |
| Annotation of somatic variants for genes involved in malignant transformation |
| Hugo Symbol | Variant Class | Variant Classification | dbSNP RS | HGVSc | HGVSp | HGVSp Short | SWISSPROT | BIOTYPE | SIFT | PolyPhen | Tumor Sample Barcode | Tissue | Histology | Sex | Age | Stage | Therapy Types | Drugs | Outcome |
| NSD1 | SNV | Missense_Mutation | novel | c.5920N>A | p.Glu1974Lys | p.E1974K | Q96L73 | protein_coding | deleterious(0) | probably_damaging(0.992) | TCGA-5L-AAT1-01 | Breast | breast invasive carcinoma | Female | <65 | III/IV | Hormone Therapy | letrozol | SD |
| NSD1 | SNV | Missense_Mutation | c.1964N>A | p.Ser655Asn | p.S655N | Q96L73 | protein_coding | tolerated_low_confidence(0.14) | benign(0.003) | TCGA-A7-A26G-01 | Breast | breast invasive carcinoma | Female | <65 | I/II | Chemotherapy | taxotere | SD | |
| NSD1 | SNV | Missense_Mutation | c.26N>A | p.Arg9Lys | p.R9K | Q96L73 | protein_coding | deleterious_low_confidence(0) | benign(0.237) | TCGA-AC-A23H-01 | Breast | breast invasive carcinoma | Female | >=65 | I/II | Unknown | Unknown | PD | |
| NSD1 | SNV | Missense_Mutation | c.4746N>G | p.Ile1582Met | p.I1582M | Q96L73 | protein_coding | deleterious(0.02) | possibly_damaging(0.514) | TCGA-AC-A23H-01 | Breast | breast invasive carcinoma | Female | >=65 | I/II | Unknown | Unknown | PD | |
| NSD1 | SNV | Missense_Mutation | rs776547552 | c.4211G>A | p.Arg1404His | p.R1404H | Q96L73 | protein_coding | deleterious(0) | probably_damaging(0.996) | TCGA-AC-A2B8-01 | Breast | breast invasive carcinoma | Female | >=65 | I/II | Chemotherapy | chemo | PD |
| NSD1 | SNV | Missense_Mutation | rs749199217 | c.3517N>T | p.Arg1173Cys | p.R1173C | Q96L73 | protein_coding | deleterious_low_confidence(0) | probably_damaging(0.952) | TCGA-AN-A046-01 | Breast | breast invasive carcinoma | Female | >=65 | I/II | Unknown | Unknown | SD |
| NSD1 | SNV | Missense_Mutation | c.6479C>T | p.Pro2160Leu | p.P2160L | Q96L73 | protein_coding | deleterious(0) | probably_damaging(1) | TCGA-AN-A0AK-01 | Breast | breast invasive carcinoma | Female | >=65 | I/II | Unknown | Unknown | SD | |
| NSD1 | SNV | Missense_Mutation | rs587784134 | c.4987N>T | p.Arg1663Cys | p.R1663C | Q96L73 | protein_coding | deleterious(0) | probably_damaging(0.999) | TCGA-AN-A0FZ-01 | Breast | breast invasive carcinoma | Female | <65 | III/IV | Unknown | Unknown | SD |
| NSD1 | SNV | Missense_Mutation | novel | c.7475N>T | p.Pro2492Leu | p.P2492L | Q96L73 | protein_coding | tolerated_low_confidence(0.1) | benign(0) | TCGA-BH-A0HF-01 | Breast | breast invasive carcinoma | Female | >=65 | I/II | Hormone Therapy | arimidex | SD |
| NSD1 | SNV | Missense_Mutation | novel | c.4924N>C | p.Thr1642Pro | p.T1642P | Q96L73 | protein_coding | deleterious(0.01) | probably_damaging(0.92) | TCGA-BH-A1F2-01 | Breast | breast invasive carcinoma | Female | <65 | III/IV | Unknown | Unknown | SD |
| Page: 1 2 3 4 5 6 7 8 9 10 11 12 13 14 15 16 17 18 19 20 21 22 23 24 25 26 27 28 29 30 31 32 33 |
Top |
Related drugs of malignant transformation related genes |
| Identification of chemicals and drugs interact with genes involved in malignant transfromation |
| (DGIdb 4.0) |
| Entrez ID | Symbol | Category | Interaction Types | Drug Claim Name | Drug Name | PMIDs |
| Page: 1 |

Copyright 2023-Present -The University of Texas Health Science Center at Houston |