
|
|||||
|
 | |
| |
| |
| |
| |
| |
|
Gene: NRXN3 |
Gene summary for NRXN3 |
| Gene information | Species | Human | Gene symbol | NRXN3 | Gene ID | 9369 |
| Gene name | neurexin 3 | |
| Gene Alias | C14orf60 | |
| Cytomap | 14q24.3-q31.1 | |
| Gene Type | protein-coding | GO ID | GO:0000902 | UniProtAcc | Q9HDB5 |
Top |
Malignant transformation analysis |
| Identification of the aberrant gene expression in precancerous and cancerous lesions by comparing the gene expression of stem-like cells in diseased tissues with normal stem cells |
| Entrez ID | Symbol | Replicates | Species | Organ | Tissue | Adj P-value | Log2FC | Malignancy |
| 9369 | NRXN3 | HTA11_3361_2000001011 | Human | Colorectum | AD | 8.74e-04 | 1.97e-02 | -0.1207 |
| 9369 | NRXN3 | HTA11_866_3004761011 | Human | Colorectum | AD | 1.08e-14 | 7.72e-01 | 0.096 |
| 9369 | NRXN3 | HTA11_7663_2000001011 | Human | Colorectum | SER | 1.81e-02 | 4.66e-01 | 0.0131 |
| 9369 | NRXN3 | HTA11_6818_2000001021 | Human | Colorectum | AD | 3.40e-03 | 5.81e-02 | 0.0588 |
| 9369 | NRXN3 | HTA11_99999970781_79442 | Human | Colorectum | MSS | 2.87e-25 | 1.05e+00 | 0.294 |
| 9369 | NRXN3 | HTA11_99999974143_84620 | Human | Colorectum | MSS | 2.86e-37 | 1.15e+00 | 0.3005 |
| 9369 | NRXN3 | A001-C-207 | Human | Colorectum | FAP | 4.99e-08 | 7.10e-01 | 0.1278 |
| 9369 | NRXN3 | A001-C-119 | Human | Colorectum | FAP | 4.76e-08 | 7.03e-01 | -0.1557 |
| 9369 | NRXN3 | A001-C-108 | Human | Colorectum | FAP | 2.03e-05 | 5.56e-01 | -0.0272 |
| 9369 | NRXN3 | A002-C-021 | Human | Colorectum | FAP | 1.11e-23 | 9.14e-01 | 0.1171 |
| 9369 | NRXN3 | A001-C-104 | Human | Colorectum | FAP | 6.43e-15 | 7.52e-01 | 0.0184 |
| 9369 | NRXN3 | A015-C-005 | Human | Colorectum | FAP | 7.36e-09 | 6.80e-01 | -0.0336 |
| 9369 | NRXN3 | A001-C-014 | Human | Colorectum | FAP | 4.66e-10 | 6.56e-01 | 0.0135 |
| 9369 | NRXN3 | A001-C-203 | Human | Colorectum | FAP | 2.44e-05 | 5.19e-01 | -0.0481 |
| 9369 | NRXN3 | CRC-1-8810 | Human | Colorectum | CRC | 3.99e-56 | 1.30e+00 | 0.6257 |
| 9369 | NRXN3 | AEH-subject5 | Human | Endometrium | AEH | 1.63e-13 | 5.75e-01 | -0.2953 |
| 9369 | NRXN3 | EEC-subject2 | Human | Endometrium | EEC | 3.20e-03 | 2.44e-01 | -0.2607 |
| 9369 | NRXN3 | EEC-subject4 | Human | Endometrium | EEC | 2.62e-07 | 3.69e-01 | -0.2571 |
| 9369 | NRXN3 | LZE22T | Human | Esophagus | ESCC | 1.57e-03 | 2.49e-01 | 0.068 |
| 9369 | NRXN3 | P9T-E | Human | Esophagus | ESCC | 4.01e-04 | 1.93e-01 | 0.1131 |
| Page: 1 2 3 |
| Tissue | Expression Dynamics | Abbreviation |
| Colorectum (GSE201348) |  | FAP: Familial adenomatous polyposis |
| CRC: Colorectal cancer | ||
| Colorectum (HTA11) |  | AD: Adenomas |
| SER: Sessile serrated lesions | ||
| MSI-H: Microsatellite-high colorectal cancer | ||
| MSS: Microsatellite stable colorectal cancer | ||
| Endometrium |  | AEH: Atypical endometrial hyperplasia |
| EEC: Endometrioid Cancer | ||
| Esophagus |  | ESCC: Esophageal squamous cell carcinoma |
| HGIN: High-grade intraepithelial neoplasias | ||
| LGIN: Low-grade intraepithelial neoplasias | ||
| Lung | 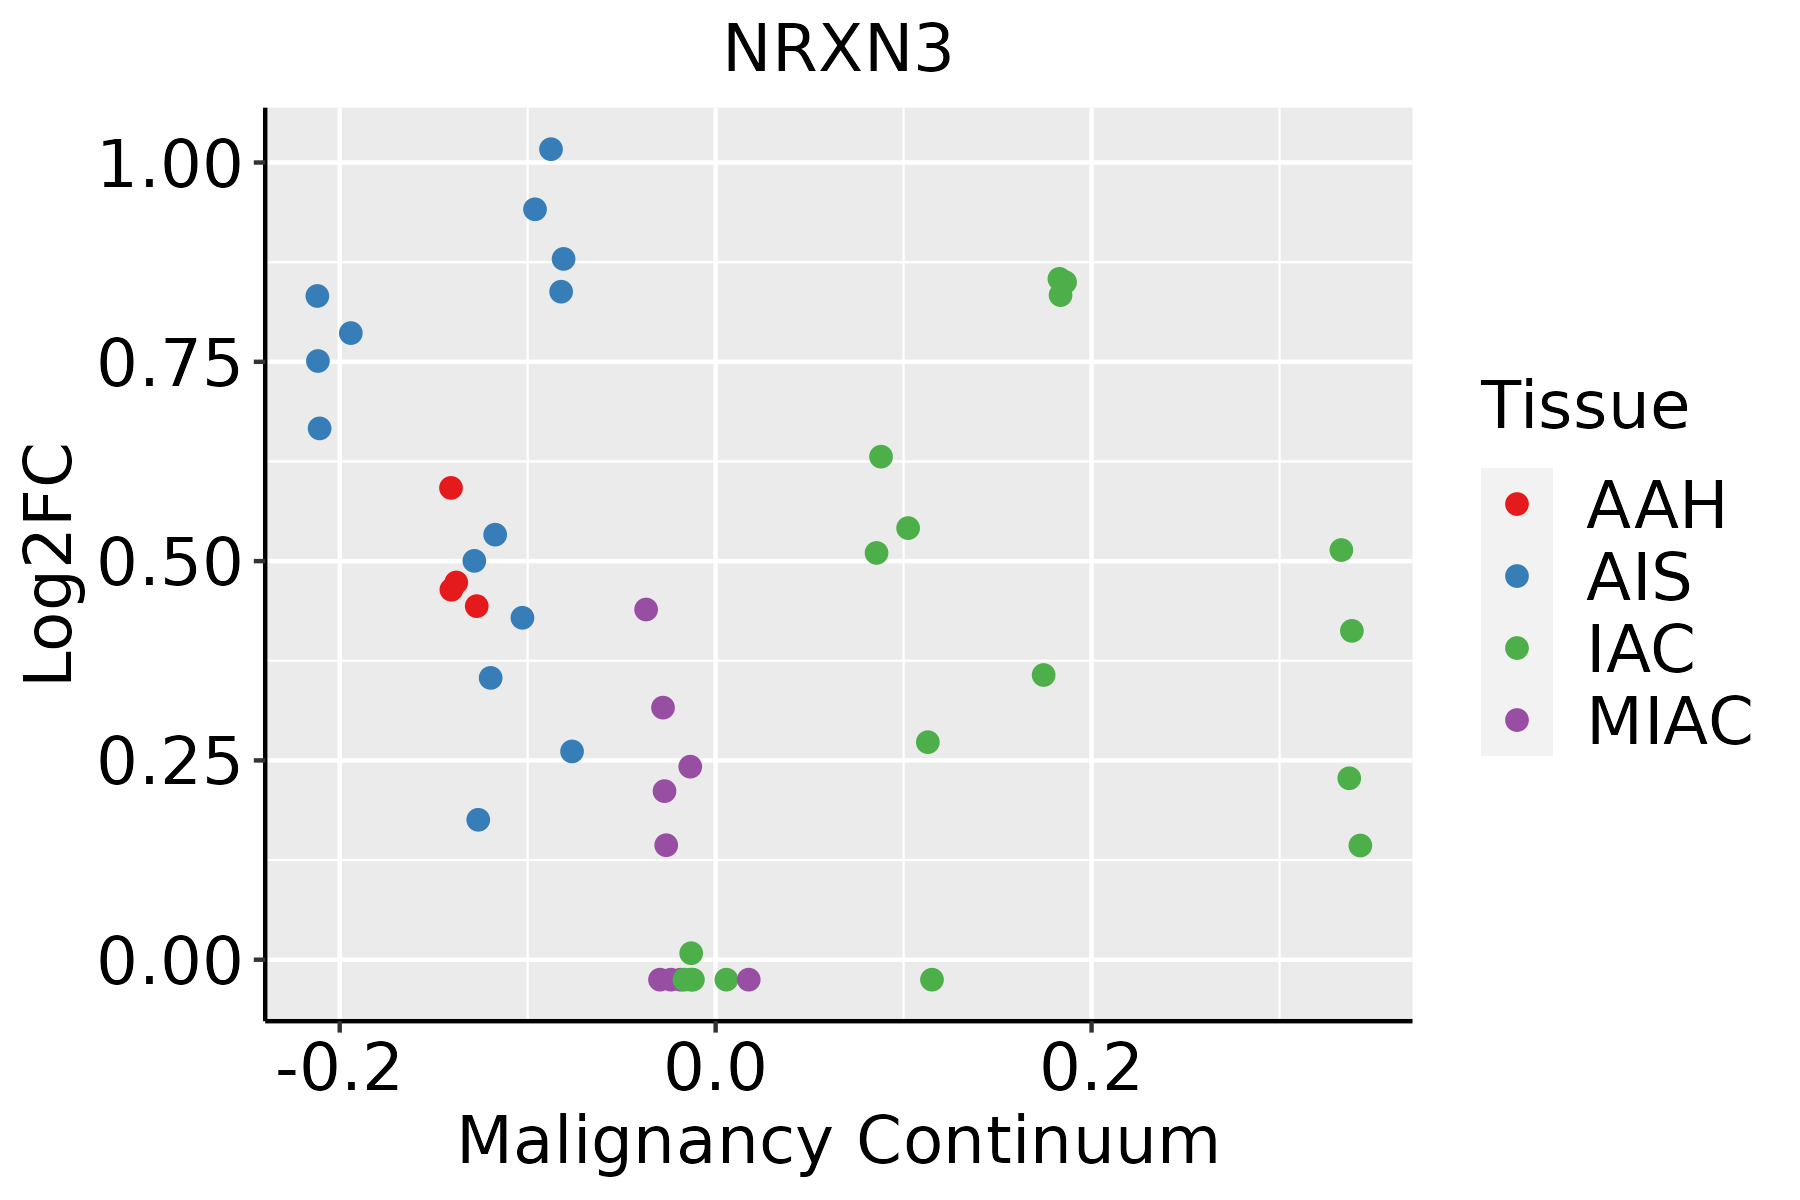 | AAH: Atypical adenomatous hyperplasia |
| AIS: Adenocarcinoma in situ | ||
| IAC: Invasive lung adenocarcinoma | ||
| MIA: Minimally invasive adenocarcinoma | ||
| Prostate |  | BPH: Benign Prostatic Hyperplasia |
| ∗log2FC in expression of this searched gene in stem-like cells from each diseased tissue sample relative to stem-like cells in normal samples in each tissue plotted against the malignancy continuum. Samples are colored based on if they are from different disease stage. |
Top |
Malignant transformation related pathway analysis |
| Find out the enriched GO biological processes and KEGG pathways involved in transition from healthy to precancer to cancer |
| Tissue | Disease Stage | Enriched GO biological Processes |
| Colorectum | AD |  |
| Colorectum | SER |  |
| Colorectum | MSS |  |
| Colorectum | MSI-H |  |
| Colorectum | FAP |  |
| ∗Top 15 enriched GO BP terms are showed in the bar plot of each disease state in each tissue. Each row represents a significant GO biological process which is colored according to the -log10(p.adjust). |
| Page: 1 2 3 4 5 6 7 8 9 |
| GO ID | Tissue | Disease Stage | Description | Gene Ratio | Bg Ratio | pvalue | p.adjust | Count |
| GO:0007409 | Colorectum | AD | axonogenesis | 122/3918 | 418/18723 | 3.36e-05 | 6.15e-04 | 122 |
| GO:0061564 | Colorectum | AD | axon development | 132/3918 | 467/18723 | 8.40e-05 | 1.31e-03 | 132 |
| GO:0007411 | Colorectum | AD | axon guidance | 64/3918 | 227/18723 | 5.41e-03 | 3.55e-02 | 64 |
| GO:0097485 | Colorectum | AD | neuron projection guidance | 64/3918 | 228/18723 | 6.02e-03 | 3.78e-02 | 64 |
| GO:00074111 | Colorectum | SER | axon guidance | 51/2897 | 227/18723 | 3.29e-03 | 2.82e-02 | 51 |
| GO:00974851 | Colorectum | SER | neuron projection guidance | 51/2897 | 228/18723 | 3.61e-03 | 3.03e-02 | 51 |
| GO:00615641 | Colorectum | SER | axon development | 94/2897 | 467/18723 | 3.78e-03 | 3.13e-02 | 94 |
| GO:00074091 | Colorectum | SER | axonogenesis | 84/2897 | 418/18723 | 6.20e-03 | 4.49e-02 | 84 |
| GO:00074092 | Colorectum | MSS | axonogenesis | 105/3467 | 418/18723 | 4.32e-04 | 5.23e-03 | 105 |
| GO:00615642 | Colorectum | MSS | axon development | 115/3467 | 467/18723 | 5.33e-04 | 6.00e-03 | 115 |
| GO:00615643 | Colorectum | FAP | axon development | 106/2622 | 467/18723 | 1.98e-07 | 1.21e-05 | 106 |
| GO:00074093 | Colorectum | FAP | axonogenesis | 97/2622 | 418/18723 | 2.20e-07 | 1.30e-05 | 97 |
| GO:00074094 | Colorectum | CRC | axonogenesis | 81/2078 | 418/18723 | 3.60e-07 | 2.99e-05 | 81 |
| GO:00615644 | Colorectum | CRC | axon development | 86/2078 | 467/18723 | 1.48e-06 | 8.12e-05 | 86 |
| GO:00074098 | Endometrium | AEH | axonogenesis | 81/2100 | 418/18723 | 5.54e-07 | 2.12e-05 | 81 |
| GO:00615648 | Endometrium | AEH | axon development | 88/2100 | 467/18723 | 6.39e-07 | 2.38e-05 | 88 |
| GO:006156412 | Endometrium | EEC | axon development | 93/2168 | 467/18723 | 9.60e-08 | 4.69e-06 | 93 |
| GO:000740912 | Endometrium | EEC | axonogenesis | 82/2168 | 418/18723 | 1.03e-06 | 3.49e-05 | 82 |
| GO:006156415 | Esophagus | ESCC | axon development | 251/8552 | 467/18723 | 2.41e-04 | 1.49e-03 | 251 |
| GO:000740915 | Esophagus | ESCC | axonogenesis | 219/8552 | 418/18723 | 3.14e-03 | 1.31e-02 | 219 |
| Page: 1 2 |
| Pathway ID | Tissue | Disease Stage | Description | Gene Ratio | Bg Ratio | pvalue | p.adjust | qvalue | Count |
| hsa045146 | Lung | IAC | Cell adhesion molecules | 30/1053 | 157/8465 | 1.03e-02 | 3.83e-02 | 2.54e-02 | 30 |
| hsa0451411 | Lung | IAC | Cell adhesion molecules | 30/1053 | 157/8465 | 1.03e-02 | 3.83e-02 | 2.54e-02 | 30 |
| Page: 1 |
Top |
Cell-cell communication analysis |
| Identification of potential cell-cell interactions between two cell types and their ligand-receptor pairs for different disease states |
| Ligand | Receptor | LRpair | Pathway | Tissue | Disease Stage |
| NRXN3 | NLGN1 | NRXN3_NLGN1 | NRXN | CRC | AD |
| NRXN3 | NLGN1 | NRXN3_NLGN1 | NRXN | CRC | ADJ |
| NRXN3 | NLGN1 | NRXN3_NLGN1 | NRXN | CRC | CRC |
| NRXN3 | NLGN1 | NRXN3_NLGN1 | NRXN | Endometrium | ADJ |
| NRXN3 | NLGN1 | NRXN3_NLGN1 | NRXN | Endometrium | AEH |
| NRXN3 | NLGN1 | NRXN3_NLGN1 | NRXN | Endometrium | EEC |
| NRXN3 | NLGN1 | NRXN3_NLGN1 | NRXN | Esophagus | ESCC |
| NRXN3 | NLGN2 | NRXN3_NLGN2 | NRXN | Esophagus | ESCC |
| NRXN3 | NLGN3 | NRXN3_NLGN3 | NRXN | Esophagus | ESCC |
| NRXN3 | NLGN1 | NRXN3_NLGN1 | NRXN | GC | ADJ |
| NRXN3 | NLGN1 | NRXN3_NLGN1 | NRXN | HNSCC | Precancer |
| NRXN3 | NLGN2 | NRXN3_NLGN2 | NRXN | HNSCC | Precancer |
| NRXN3 | NLGN1 | NRXN3_NLGN1 | NRXN | Lung | ADJ |
| NRXN3 | NLGN1 | NRXN3_NLGN1 | NRXN | Skin | ADJ |
| NRXN3 | NLGN2 | NRXN3_NLGN2 | NRXN | Skin | ADJ |
| NRXN3 | NLGN1 | NRXN3_NLGN1 | NRXN | Skin | SCCIS |
| Page: 1 |
Top |
Single-cell gene regulatory network inference analysis |
| Find out the significant the regulons (TFs) and the target genes of each regulon across cell types for different disease states |
| TF | Cell Type | Tissue | Disease Stage | Target Gene | RSS | Regulon Activity |
| ∗The dot plots of a searched regulon are shown for all cell subpopulations in each disease state of each tissue based on the regulon specific score inferred using pySCENIC and by calculating the average expression. |
| Page: 1 |
Top |
Somatic mutation of malignant transformation related genes |
| Annotation of somatic variants for genes involved in malignant transformation |
| Hugo Symbol | Variant Class | Variant Classification | dbSNP RS | HGVSc | HGVSp | HGVSp Short | SWISSPROT | BIOTYPE | SIFT | PolyPhen | Tumor Sample Barcode | Tissue | Histology | Sex | Age | Stage | Therapy Types | Drugs | Outcome |
| NRXN3 | SNV | Missense_Mutation | rs752029799 | c.1856N>A | p.Arg619His | p.R619H | protein_coding | deleterious(0) | probably_damaging(0.995) | TCGA-A8-A07W-01 | Breast | breast invasive carcinoma | Female | >=65 | III/IV | Hormone Therapy | exemestane | SD | |
| NRXN3 | SNV | Missense_Mutation | rs368725767 | c.4373G>T | p.Ser1458Ile | p.S1458I | protein_coding | tolerated_low_confidence(0.18) | benign(0.046) | TCGA-A8-A08C-01 | Breast | breast invasive carcinoma | Female | >=65 | I/II | Chemotherapy | 5-fluorouracil | CR | |
| NRXN3 | SNV | Missense_Mutation | novel | c.951G>T | p.Leu317Phe | p.L317F | protein_coding | deleterious(0.03) | probably_damaging(0.984) | TCGA-A8-A08F-01 | Breast | breast invasive carcinoma | Female | <65 | III/IV | Chemotherapy | 5-fluorouracil | CR | |
| NRXN3 | SNV | Missense_Mutation | rs776750366 | c.2839C>T | p.Arg947Cys | p.R947C | protein_coding | deleterious(0.01) | possibly_damaging(0.736) | TCGA-A8-A09Z-01 | Breast | breast invasive carcinoma | Female | >=65 | I/II | Unknown | Unknown | SD | |
| NRXN3 | SNV | Missense_Mutation | c.1140N>A | p.Phe380Leu | p.F380L | protein_coding | tolerated(0.31) | possibly_damaging(0.815) | TCGA-AN-A046-01 | Breast | breast invasive carcinoma | Female | >=65 | I/II | Unknown | Unknown | SD | ||
| NRXN3 | SNV | Missense_Mutation | rs144412380 | c.2338N>T | p.Arg780Trp | p.R780W | protein_coding | deleterious(0) | possibly_damaging(0.868) | TCGA-AN-A046-01 | Breast | breast invasive carcinoma | Female | >=65 | I/II | Unknown | Unknown | SD | |
| NRXN3 | SNV | Missense_Mutation | c.4570G>A | p.Asp1524Asn | p.D1524N | protein_coding | deleterious_low_confidence(0) | probably_damaging(0.981) | TCGA-AQ-A04H-01 | Breast | breast invasive carcinoma | Female | <65 | III/IV | Chemotherapy | taxotere | SD | ||
| NRXN3 | SNV | Missense_Mutation | c.2238N>A | p.Met746Ile | p.M746I | protein_coding | deleterious(0.01) | benign(0.023) | TCGA-AR-A0TX-01 | Breast | breast invasive carcinoma | Female | <65 | I/II | Unknown | Unknown | SD | ||
| NRXN3 | SNV | Missense_Mutation | c.1655N>T | p.Arg552Ile | p.R552I | protein_coding | deleterious(0) | probably_damaging(0.992) | TCGA-BH-A0BZ-01 | Breast | breast invasive carcinoma | Female | <65 | III/IV | Chemotherapy | doxorubicin | CR | ||
| NRXN3 | SNV | Missense_Mutation | c.2918C>T | p.Thr973Ile | p.T973I | protein_coding | deleterious(0.01) | benign(0.167) | TCGA-BH-A18G-01 | Breast | breast invasive carcinoma | Female | >=65 | I/II | Unknown | Unknown | SD |
| Page: 1 2 3 4 5 6 7 8 9 10 11 12 13 14 15 16 17 18 19 20 21 22 23 24 25 26 27 28 29 30 |
Top |
Related drugs of malignant transformation related genes |
| Identification of chemicals and drugs interact with genes involved in malignant transfromation |
| (DGIdb 4.0) |
| Entrez ID | Symbol | Category | Interaction Types | Drug Claim Name | Drug Name | PMIDs |
| Page: 1 |

Copyright 2023-Present -The University of Texas Health Science Center at Houston |