
|
|||||
|
 | |
| |
| |
| |
| |
| |
|
Gene: NRSN2 |
Gene summary for NRSN2 |
| Gene information | Species | Human | Gene symbol | NRSN2 | Gene ID | 80023 |
| Gene name | neurensin 2 | |
| Gene Alias | C20orf98 | |
| Cytomap | 20p13 | |
| Gene Type | protein-coding | GO ID | GO:0007275 | UniProtAcc | Q9GZP1 |
Top |
Malignant transformation analysis |
| Identification of the aberrant gene expression in precancerous and cancerous lesions by comparing the gene expression of stem-like cells in diseased tissues with normal stem cells |
| Entrez ID | Symbol | Replicates | Species | Organ | Tissue | Adj P-value | Log2FC | Malignancy |
| 80023 | NRSN2 | LZE4T | Human | Esophagus | ESCC | 6.56e-07 | 2.30e-01 | 0.0811 |
| 80023 | NRSN2 | LZE7T | Human | Esophagus | ESCC | 2.02e-04 | 1.73e-01 | 0.0667 |
| 80023 | NRSN2 | LZE24T | Human | Esophagus | ESCC | 1.67e-05 | 1.83e-01 | 0.0596 |
| 80023 | NRSN2 | P2T-E | Human | Esophagus | ESCC | 3.28e-14 | 2.81e-01 | 0.1177 |
| 80023 | NRSN2 | P4T-E | Human | Esophagus | ESCC | 3.98e-07 | 1.74e-01 | 0.1323 |
| 80023 | NRSN2 | P5T-E | Human | Esophagus | ESCC | 8.20e-06 | 1.14e-01 | 0.1327 |
| 80023 | NRSN2 | P8T-E | Human | Esophagus | ESCC | 1.97e-10 | 1.83e-01 | 0.0889 |
| 80023 | NRSN2 | P9T-E | Human | Esophagus | ESCC | 4.74e-05 | 1.99e-01 | 0.1131 |
| 80023 | NRSN2 | P10T-E | Human | Esophagus | ESCC | 2.56e-16 | 2.38e-01 | 0.116 |
| 80023 | NRSN2 | P11T-E | Human | Esophagus | ESCC | 3.75e-09 | 3.67e-01 | 0.1426 |
| 80023 | NRSN2 | P12T-E | Human | Esophagus | ESCC | 3.15e-16 | 3.47e-01 | 0.1122 |
| 80023 | NRSN2 | P15T-E | Human | Esophagus | ESCC | 1.60e-15 | 3.69e-01 | 0.1149 |
| 80023 | NRSN2 | P16T-E | Human | Esophagus | ESCC | 9.67e-18 | 2.96e-01 | 0.1153 |
| 80023 | NRSN2 | P19T-E | Human | Esophagus | ESCC | 1.30e-05 | 3.83e-01 | 0.1662 |
| 80023 | NRSN2 | P20T-E | Human | Esophagus | ESCC | 3.74e-11 | 1.56e-01 | 0.1124 |
| 80023 | NRSN2 | P21T-E | Human | Esophagus | ESCC | 4.05e-32 | 5.49e-01 | 0.1617 |
| 80023 | NRSN2 | P22T-E | Human | Esophagus | ESCC | 9.20e-06 | 1.14e-01 | 0.1236 |
| 80023 | NRSN2 | P23T-E | Human | Esophagus | ESCC | 5.45e-03 | 1.19e-01 | 0.108 |
| 80023 | NRSN2 | P24T-E | Human | Esophagus | ESCC | 1.76e-12 | 2.39e-01 | 0.1287 |
| 80023 | NRSN2 | P26T-E | Human | Esophagus | ESCC | 1.47e-14 | 2.82e-01 | 0.1276 |
| Page: 1 2 3 4 |
| Tissue | Expression Dynamics | Abbreviation |
| Esophagus | 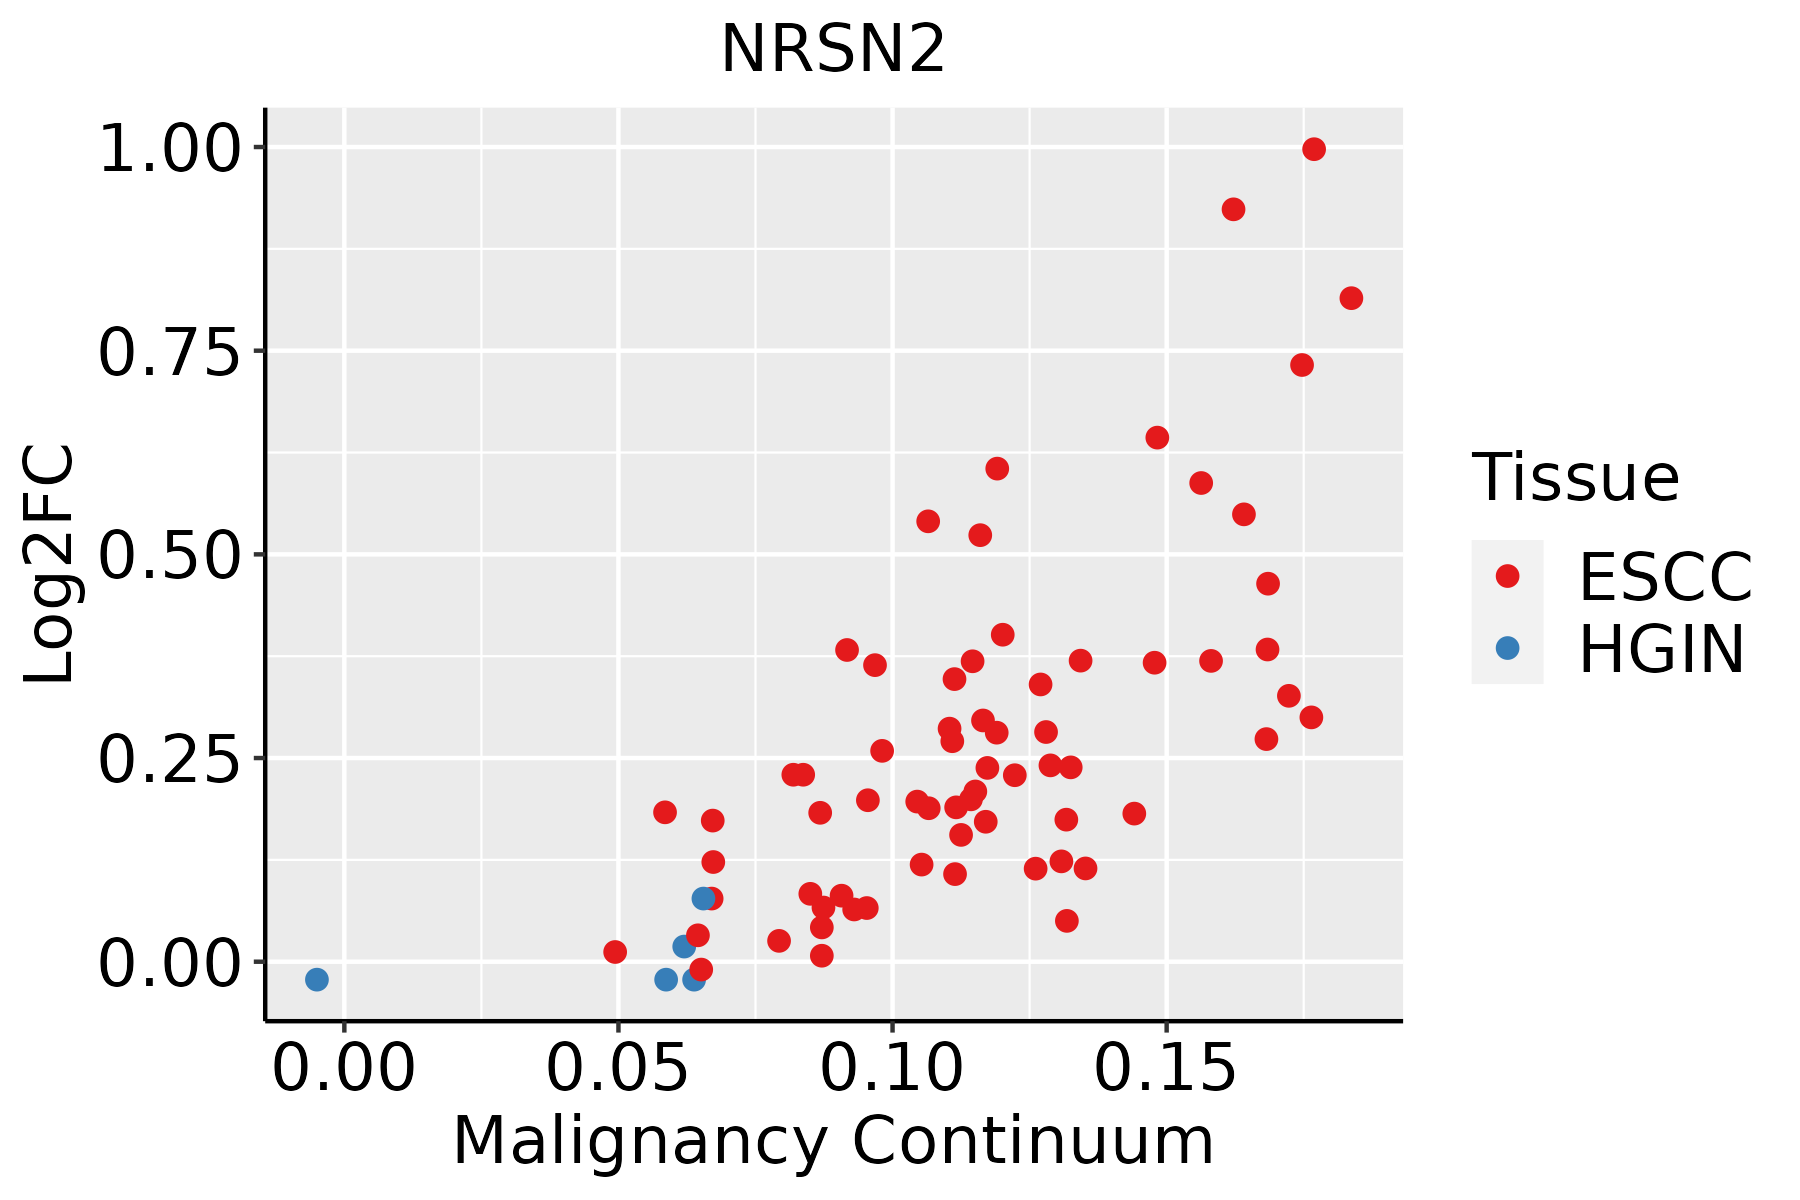 | ESCC: Esophageal squamous cell carcinoma |
| HGIN: High-grade intraepithelial neoplasias | ||
| LGIN: Low-grade intraepithelial neoplasias | ||
| Liver | 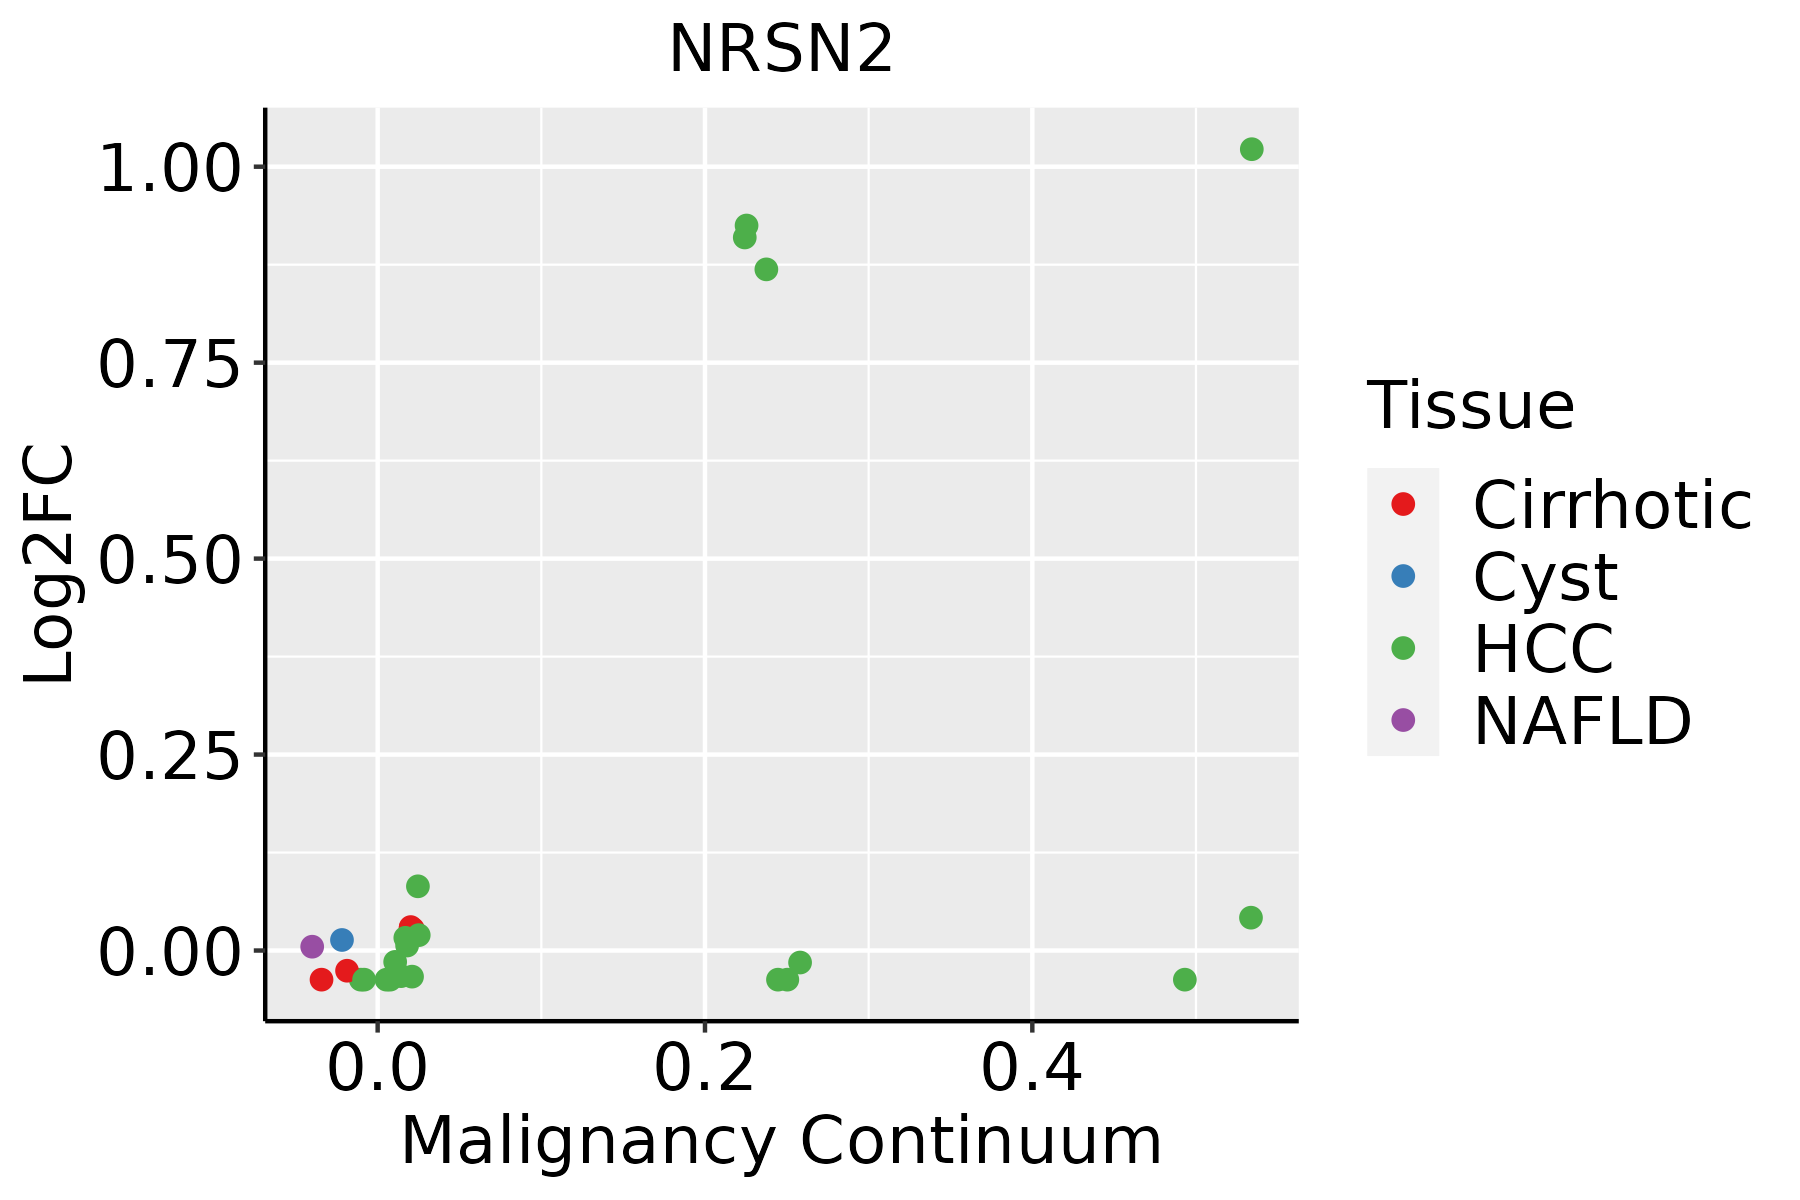 | HCC: Hepatocellular carcinoma |
| NAFLD: Non-alcoholic fatty liver disease | ||
| Oral Cavity |  | EOLP: Erosive Oral lichen planus |
| LP: leukoplakia | ||
| NEOLP: Non-erosive oral lichen planus | ||
| OSCC: Oral squamous cell carcinoma |
| ∗log2FC in expression of this searched gene in stem-like cells from each diseased tissue sample relative to stem-like cells in normal samples in each tissue plotted against the malignancy continuum. Samples are colored based on if they are from different disease stage. |
Top |
Malignant transformation related pathway analysis |
| Find out the enriched GO biological processes and KEGG pathways involved in transition from healthy to precancer to cancer |
| Tissue | Disease Stage | Enriched GO biological Processes |
| Colorectum | AD |  |
| Colorectum | SER |  |
| Colorectum | MSS |  |
| Colorectum | MSI-H |  |
| Colorectum | FAP |  |
| ∗Top 15 enriched GO BP terms are showed in the bar plot of each disease state in each tissue. Each row represents a significant GO biological process which is colored according to the -log10(p.adjust). |
| Page: 1 2 3 4 5 6 7 8 9 |
| GO ID | Tissue | Disease Stage | Description | Gene Ratio | Bg Ratio | pvalue | p.adjust | Count |
| Page: 1 |
| Pathway ID | Tissue | Disease Stage | Description | Gene Ratio | Bg Ratio | pvalue | p.adjust | qvalue | Count |
| Page: 1 |
Top |
Cell-cell communication analysis |
| Identification of potential cell-cell interactions between two cell types and their ligand-receptor pairs for different disease states |
| Ligand | Receptor | LRpair | Pathway | Tissue | Disease Stage |
| Page: 1 |
Top |
Single-cell gene regulatory network inference analysis |
| Find out the significant the regulons (TFs) and the target genes of each regulon across cell types for different disease states |
| TF | Cell Type | Tissue | Disease Stage | Target Gene | RSS | Regulon Activity |
| ∗The dot plots of a searched regulon are shown for all cell subpopulations in each disease state of each tissue based on the regulon specific score inferred using pySCENIC and by calculating the average expression. |
| Page: 1 |
Top |
Somatic mutation of malignant transformation related genes |
| Annotation of somatic variants for genes involved in malignant transformation |
| Hugo Symbol | Variant Class | Variant Classification | dbSNP RS | HGVSc | HGVSp | HGVSp Short | SWISSPROT | BIOTYPE | SIFT | PolyPhen | Tumor Sample Barcode | Tissue | Histology | Sex | Age | Stage | Therapy Types | Drugs | Outcome |
| NRSN2 | SNV | Missense_Mutation | rs780211474 | c.164G>A | p.Arg55Gln | p.R55Q | Q9GZP1 | protein_coding | tolerated(0.67) | benign(0) | TCGA-AO-A128-01 | Breast | breast invasive carcinoma | Female | <65 | I/II | Chemotherapy | doxorubicin | SD |
| NRSN2 | insertion | Nonsense_Mutation | novel | c.364_365insCTCAGGATTCCAAATAAAACATGACAG | p.Leu122delinsProGlnAspSerLysTerAsnMetThrVal | p.L122delinsPQDSK*NMTV | Q9GZP1 | protein_coding | TCGA-A2-A0T2-01 | Breast | breast invasive carcinoma | Female | >=65 | III/IV | Chemotherapy | xeloda | PD | ||
| NRSN2 | SNV | Missense_Mutation | novel | c.314N>T | p.Ala105Val | p.A105V | Q9GZP1 | protein_coding | tolerated(0.16) | benign(0.12) | TCGA-AA-3949-01 | Colorectum | colon adenocarcinoma | Female | >=65 | III/IV | Unknown | Unknown | SD |
| NRSN2 | SNV | Missense_Mutation | c.316N>T | p.Ala106Ser | p.A106S | Q9GZP1 | protein_coding | deleterious(0.02) | probably_damaging(0.996) | TCGA-AA-A01R-01 | Colorectum | colon adenocarcinoma | Male | <65 | III/IV | Chemotherapy | 5-fluorouracil | PD | |
| NRSN2 | SNV | Missense_Mutation | c.547T>C | p.Phe183Leu | p.F183L | Q9GZP1 | protein_coding | tolerated(0.51) | benign(0.001) | TCGA-CK-5913-01 | Colorectum | colon adenocarcinoma | Female | <65 | I/II | Unknown | Unknown | SD | |
| NRSN2 | SNV | Missense_Mutation | rs139750306 | c.161N>A | p.Arg54His | p.R54H | Q9GZP1 | protein_coding | tolerated(0.81) | benign(0) | TCGA-D5-6928-01 | Colorectum | colon adenocarcinoma | Male | >=65 | I/II | Unknown | Unknown | SD |
| NRSN2 | SNV | Missense_Mutation | rs527857076 | c.310N>T | p.Arg104Trp | p.R104W | Q9GZP1 | protein_coding | deleterious(0.01) | possibly_damaging(0.707) | TCGA-A5-A0G1-01 | Endometrium | uterine corpus endometrioid carcinoma | Female | >=65 | I/II | Unknown | Unknown | SD |
| NRSN2 | SNV | Missense_Mutation | rs145813295 | c.466N>A | p.Asp156Asn | p.D156N | Q9GZP1 | protein_coding | tolerated(0.16) | benign(0.007) | TCGA-AJ-A3EL-01 | Endometrium | uterine corpus endometrioid carcinoma | Female | <65 | I/II | Unknown | Unknown | SD |
| NRSN2 | SNV | Missense_Mutation | rs372152096 | c.559G>A | p.Ala187Thr | p.A187T | Q9GZP1 | protein_coding | tolerated(0.76) | benign(0) | TCGA-AP-A1DR-01 | Endometrium | uterine corpus endometrioid carcinoma | Female | <65 | III/IV | Chemotherapy | cisplatin | SD |
| NRSN2 | SNV | Missense_Mutation | novel | c.590C>T | p.Thr197Ile | p.T197I | Q9GZP1 | protein_coding | deleterious(0.05) | probably_damaging(0.956) | TCGA-AX-A1CE-01 | Endometrium | uterine corpus endometrioid carcinoma | Female | <65 | I/II | Unspecific | Paclitaxel | SD |
| Page: 1 2 3 |
Top |
Related drugs of malignant transformation related genes |
| Identification of chemicals and drugs interact with genes involved in malignant transfromation |
| (DGIdb 4.0) |
| Entrez ID | Symbol | Category | Interaction Types | Drug Claim Name | Drug Name | PMIDs |
| Page: 1 |

Copyright 2023-Present -The University of Texas Health Science Center at Houston |