
|
|||||
|
 | |
| |
| |
| |
| |
| |
|
Gene: NRN1 |
Gene summary for NRN1 |
| Gene information | Species | Human | Gene symbol | NRN1 | Gene ID | 51299 |
| Gene name | neuritin 1 | |
| Gene Alias | NRN | |
| Cytomap | 6p25.1 | |
| Gene Type | protein-coding | GO ID | GO:0000902 | UniProtAcc | Q9NPD7 |
Top |
Malignant transformation analysis |
| Identification of the aberrant gene expression in precancerous and cancerous lesions by comparing the gene expression of stem-like cells in diseased tissues with normal stem cells |
| Entrez ID | Symbol | Replicates | Species | Organ | Tissue | Adj P-value | Log2FC | Malignancy |
| 51299 | NRN1 | LZE7T | Human | Esophagus | ESCC | 2.29e-03 | 3.17e-01 | 0.0667 |
| 51299 | NRN1 | LZE8T | Human | Esophagus | ESCC | 2.07e-05 | 3.30e-01 | 0.067 |
| 51299 | NRN1 | P2T-E | Human | Esophagus | ESCC | 2.40e-06 | 1.18e-01 | 0.1177 |
| 51299 | NRN1 | P4T-E | Human | Esophagus | ESCC | 1.37e-29 | 9.49e-01 | 0.1323 |
| 51299 | NRN1 | P8T-E | Human | Esophagus | ESCC | 7.05e-10 | 3.25e-01 | 0.0889 |
| 51299 | NRN1 | P10T-E | Human | Esophagus | ESCC | 6.62e-42 | 9.79e-01 | 0.116 |
| 51299 | NRN1 | P11T-E | Human | Esophagus | ESCC | 5.27e-11 | 7.71e-01 | 0.1426 |
| 51299 | NRN1 | P15T-E | Human | Esophagus | ESCC | 1.10e-46 | 1.41e+00 | 0.1149 |
| 51299 | NRN1 | P16T-E | Human | Esophagus | ESCC | 3.11e-29 | 6.20e-01 | 0.1153 |
| 51299 | NRN1 | P19T-E | Human | Esophagus | ESCC | 1.61e-10 | 1.04e+00 | 0.1662 |
| 51299 | NRN1 | P26T-E | Human | Esophagus | ESCC | 1.79e-58 | 1.88e+00 | 0.1276 |
| 51299 | NRN1 | P28T-E | Human | Esophagus | ESCC | 5.57e-24 | 8.33e-01 | 0.1149 |
| 51299 | NRN1 | P32T-E | Human | Esophagus | ESCC | 2.65e-06 | 2.19e-01 | 0.1666 |
| 51299 | NRN1 | P37T-E | Human | Esophagus | ESCC | 7.88e-04 | 2.39e-01 | 0.1371 |
| 51299 | NRN1 | P38T-E | Human | Esophagus | ESCC | 4.19e-03 | 3.42e-01 | 0.127 |
| 51299 | NRN1 | P42T-E | Human | Esophagus | ESCC | 4.46e-02 | 1.27e-01 | 0.1175 |
| 51299 | NRN1 | P44T-E | Human | Esophagus | ESCC | 8.37e-07 | 3.56e-01 | 0.1096 |
| 51299 | NRN1 | P49T-E | Human | Esophagus | ESCC | 1.79e-24 | 2.63e+00 | 0.1768 |
| 51299 | NRN1 | P56T-E | Human | Esophagus | ESCC | 6.30e-03 | 2.73e-01 | 0.1613 |
| 51299 | NRN1 | P61T-E | Human | Esophagus | ESCC | 1.53e-22 | 5.60e-01 | 0.099 |
| Page: 1 2 |
| Tissue | Expression Dynamics | Abbreviation |
| Esophagus |  | ESCC: Esophageal squamous cell carcinoma |
| HGIN: High-grade intraepithelial neoplasias | ||
| LGIN: Low-grade intraepithelial neoplasias | ||
| Oral Cavity | 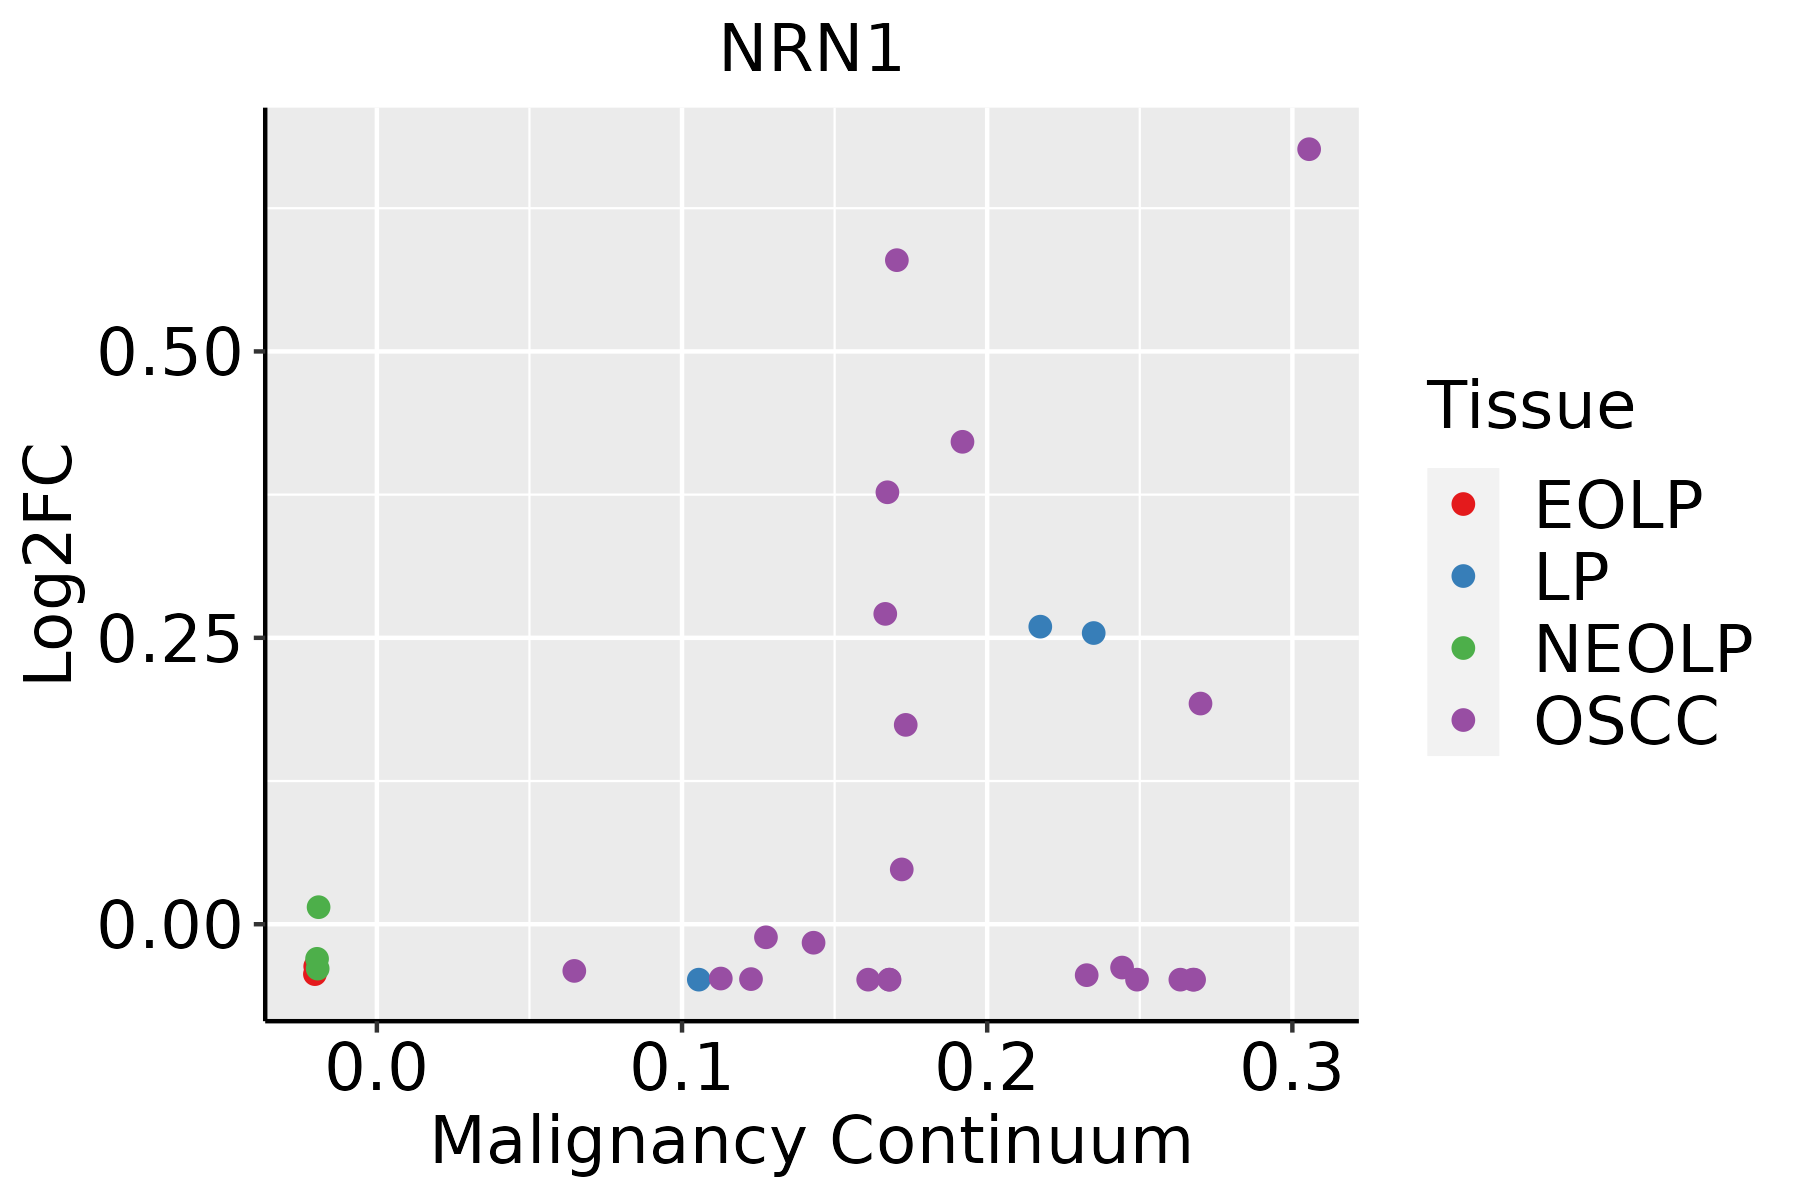 | EOLP: Erosive Oral lichen planus |
| LP: leukoplakia | ||
| NEOLP: Non-erosive oral lichen planus | ||
| OSCC: Oral squamous cell carcinoma | ||
| Thyroid | 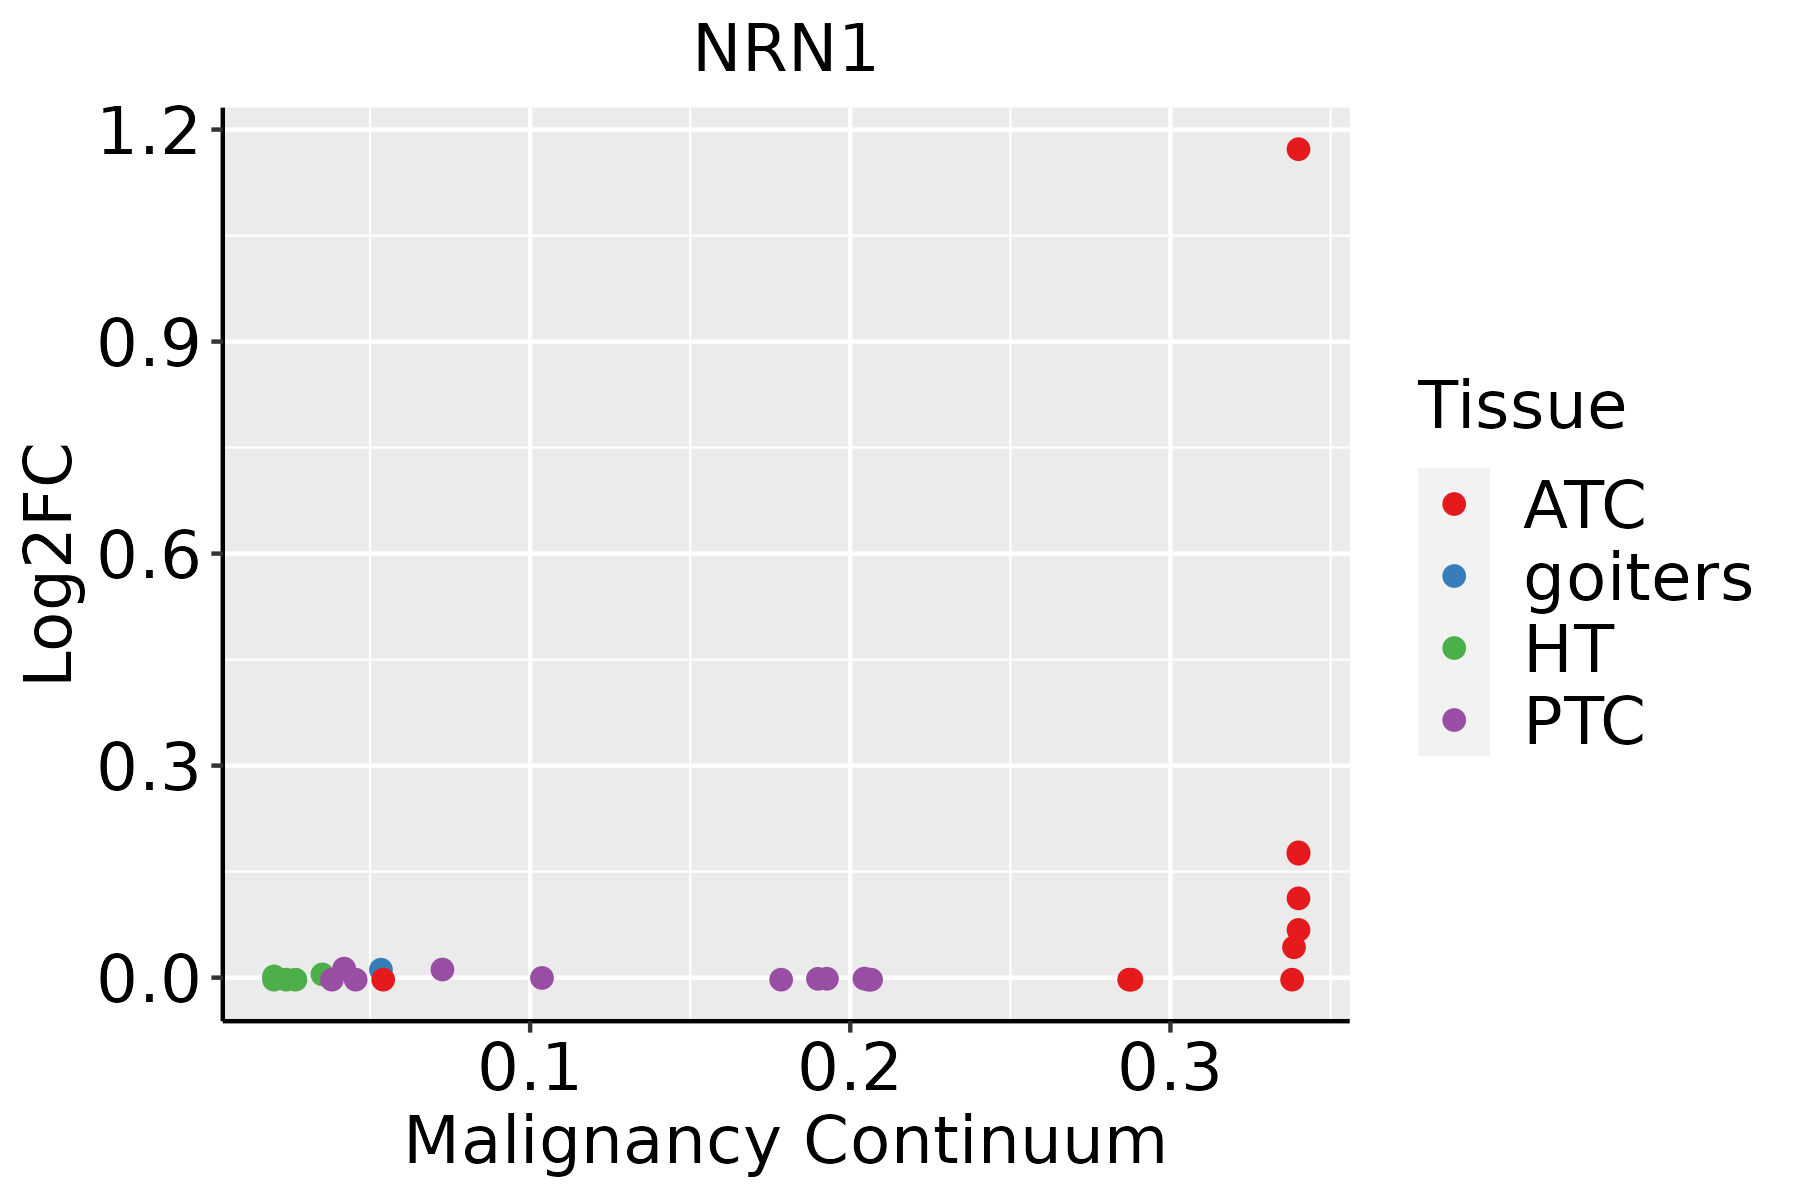 | ATC: Anaplastic thyroid cancer |
| HT: Hashimoto's thyroiditis | ||
| PTC: Papillary thyroid cancer |
| ∗log2FC in expression of this searched gene in stem-like cells from each diseased tissue sample relative to stem-like cells in normal samples in each tissue plotted against the malignancy continuum. Samples are colored based on if they are from different disease stage. |
Top |
Malignant transformation related pathway analysis |
| Find out the enriched GO biological processes and KEGG pathways involved in transition from healthy to precancer to cancer |
| Tissue | Disease Stage | Enriched GO biological Processes |
| Colorectum | AD |  |
| Colorectum | SER |  |
| Colorectum | MSS |  |
| Colorectum | MSI-H |  |
| Colorectum | FAP |  |
| ∗Top 15 enriched GO BP terms are showed in the bar plot of each disease state in each tissue. Each row represents a significant GO biological process which is colored according to the -log10(p.adjust). |
| Page: 1 2 3 4 5 6 7 8 9 |
| GO ID | Tissue | Disease Stage | Description | Gene Ratio | Bg Ratio | pvalue | p.adjust | Count |
| GO:0016049110 | Esophagus | ESCC | cell growth | 289/8552 | 482/18723 | 1.29e-10 | 3.77e-09 | 289 |
| GO:006056010 | Esophagus | ESCC | developmental growth involved in morphogenesis | 131/8552 | 234/18723 | 9.28e-04 | 4.73e-03 | 131 |
| GO:004858810 | Esophagus | ESCC | developmental cell growth | 125/8552 | 234/18723 | 1.01e-02 | 3.46e-02 | 125 |
| GO:001604917 | Oral cavity | OSCC | cell growth | 268/7305 | 482/18723 | 6.55e-14 | 3.51e-12 | 268 |
| GO:00485889 | Oral cavity | OSCC | developmental cell growth | 116/7305 | 234/18723 | 6.20e-04 | 3.50e-03 | 116 |
| GO:00605609 | Oral cavity | OSCC | developmental growth involved in morphogenesis | 116/7305 | 234/18723 | 6.20e-04 | 3.50e-03 | 116 |
| GO:19901388 | Oral cavity | OSCC | neuron projection extension | 86/7305 | 172/18723 | 2.13e-03 | 9.80e-03 | 86 |
| GO:001604927 | Thyroid | ATC | cell growth | 241/6293 | 482/18723 | 4.27e-14 | 2.35e-12 | 241 |
| GO:199013824 | Thyroid | ATC | neuron projection extension | 89/6293 | 172/18723 | 6.63e-07 | 9.13e-06 | 89 |
| GO:004858823 | Thyroid | ATC | developmental cell growth | 114/6293 | 234/18723 | 1.11e-06 | 1.44e-05 | 114 |
| GO:006056019 | Thyroid | ATC | developmental growth involved in morphogenesis | 114/6293 | 234/18723 | 1.11e-06 | 1.44e-05 | 114 |
| Page: 1 |
| Pathway ID | Tissue | Disease Stage | Description | Gene Ratio | Bg Ratio | pvalue | p.adjust | qvalue | Count |
| Page: 1 |
Top |
Cell-cell communication analysis |
| Identification of potential cell-cell interactions between two cell types and their ligand-receptor pairs for different disease states |
| Ligand | Receptor | LRpair | Pathway | Tissue | Disease Stage |
| Page: 1 |
Top |
Single-cell gene regulatory network inference analysis |
| Find out the significant the regulons (TFs) and the target genes of each regulon across cell types for different disease states |
| TF | Cell Type | Tissue | Disease Stage | Target Gene | RSS | Regulon Activity |
| ∗The dot plots of a searched regulon are shown for all cell subpopulations in each disease state of each tissue based on the regulon specific score inferred using pySCENIC and by calculating the average expression. |
| Page: 1 |
Top |
Somatic mutation of malignant transformation related genes |
| Annotation of somatic variants for genes involved in malignant transformation |
| Hugo Symbol | Variant Class | Variant Classification | dbSNP RS | HGVSc | HGVSp | HGVSp Short | SWISSPROT | BIOTYPE | SIFT | PolyPhen | Tumor Sample Barcode | Tissue | Histology | Sex | Age | Stage | Therapy Types | Drugs | Outcome |
| NRN1 | SNV | Missense_Mutation | novel | c.176C>T | p.Ala59Val | p.A59V | protein_coding | tolerated(0.18) | possibly_damaging(0.794) | TCGA-AN-A046-01 | Breast | breast invasive carcinoma | Female | >=65 | I/II | Unknown | Unknown | SD | |
| NRN1 | SNV | Missense_Mutation | c.257N>T | p.Thr86Met | p.T86M | protein_coding | tolerated(0.11) | possibly_damaging(0.799) | TCGA-EA-A50E-01 | Cervix | cervical & endocervical cancer | Female | <65 | I/II | Unknown | Unknown | PD | ||
| NRN1 | SNV | Missense_Mutation | novel | c.449C>T | p.Ala150Val | p.A150V | protein_coding | tolerated(0.32) | benign(0.288) | TCGA-VS-A9U6-01 | Cervix | cervical & endocervical cancer | Female | <65 | I/II | Chemotherapy | cisplatin | PD | |
| NRN1 | SNV | Missense_Mutation | c.403N>A | p.Glu135Lys | p.E135K | protein_coding | deleterious(0.01) | probably_damaging(0.996) | TCGA-AA-3984-01 | Colorectum | colon adenocarcinoma | Female | <65 | I/II | Unknown | Unknown | SD | ||
| NRN1 | SNV | Missense_Mutation | novel | c.194N>T | p.Ser65Leu | p.S65L | protein_coding | deleterious(0) | probably_damaging(0.995) | TCGA-CA-6717-01 | Colorectum | colon adenocarcinoma | Male | <65 | I/II | Chemotherapy | oxaliplatin | CR | |
| NRN1 | SNV | Missense_Mutation | c.338N>T | p.Ala113Val | p.A113V | protein_coding | tolerated(0.11) | possibly_damaging(0.72) | TCGA-CM-6675-01 | Colorectum | colon adenocarcinoma | Male | <65 | I/II | Chemotherapy | fluorouracil | PD | ||
| NRN1 | SNV | Missense_Mutation | c.403G>A | p.Glu135Lys | p.E135K | protein_coding | deleterious(0.01) | probably_damaging(0.996) | TCGA-F5-6814-01 | Colorectum | rectum adenocarcinoma | Male | <65 | I/II | Unknown | Unknown | SD | ||
| NRN1 | deletion | Frame_Shift_Del | c.337delN | p.Ala113ArgfsTer8 | p.A113Rfs*8 | protein_coding | TCGA-A6-2686-01 | Colorectum | colon adenocarcinoma | Female | >=65 | I/II | Unknown | Unknown | SD | ||||
| NRN1 | SNV | Missense_Mutation | novel | c.416G>A | p.Ser139Asn | p.S139N | protein_coding | tolerated(0.11) | benign(0.157) | TCGA-AJ-A2QO-01 | Endometrium | uterine corpus endometrioid carcinoma | Female | >=65 | I/II | Unknown | Unknown | SD | |
| NRN1 | SNV | Missense_Mutation | c.403N>A | p.Glu135Lys | p.E135K | protein_coding | deleterious(0.01) | probably_damaging(0.996) | TCGA-AX-A0J0-01 | Endometrium | uterine corpus endometrioid carcinoma | Female | <65 | I/II | Unknown | Unknown | SD |
| Page: 1 2 3 |
Top |
Related drugs of malignant transformation related genes |
| Identification of chemicals and drugs interact with genes involved in malignant transfromation |
| (DGIdb 4.0) |
| Entrez ID | Symbol | Category | Interaction Types | Drug Claim Name | Drug Name | PMIDs |
| Page: 1 |

Copyright 2023-Present -The University of Texas Health Science Center at Houston |